Multiple metrics on one chart #2359
Comments
|
Hi, unfortunately is not that easy with netdata currently. Either of these will work with netdata:
Of course, if you need to do that a lot, you could archive netdata metrics to a time-series database (see backends) and use grafana to build the charts you want. This however, will use a lot more resources. Your request however, is valid. Netdata should allows us to cherry pick metrics and create the charts the way we want them. So, I will leave it open as enhancement. |
|
👍 for this feature. I want to put two related stats into a single graph but I don't know how to do that. I see there's dimensions support but I don't know how to make that work with statsd. Right now I have separate graphs but its really a pain to correlate between multiple graphs. |
|
@simongui for statsd metrics this is already in place with synthetic charts: https://github.com/firehol/netdata/wiki/statsd#synthetic-statsd-charts I use them extensibly. They are magic... |
|
Oh interesting, I'll try this out! In a custom chart, can I use multiple statsd metrics as dimensions as well somehow? Also, how do I discover what the metric names are? I'm not sure how myapp.* works because it seems I'm getting the following in go: Is giving me a metric of I'm also not clear where these synthetic charts show up? I created a .conf file but I don't know where these show up to use? |
that is the idea
The metric name to be matched will be
For these charts to show up, they need to match a metric. Otherwise, they do not exist. |
|
Hmm I must be doing something wrong because it's not showing up in the dashboard. I've added the .conf file and I've restarted netdata. |
|
Example: statsd metrics: File I sent to statsd: I got these private charts:
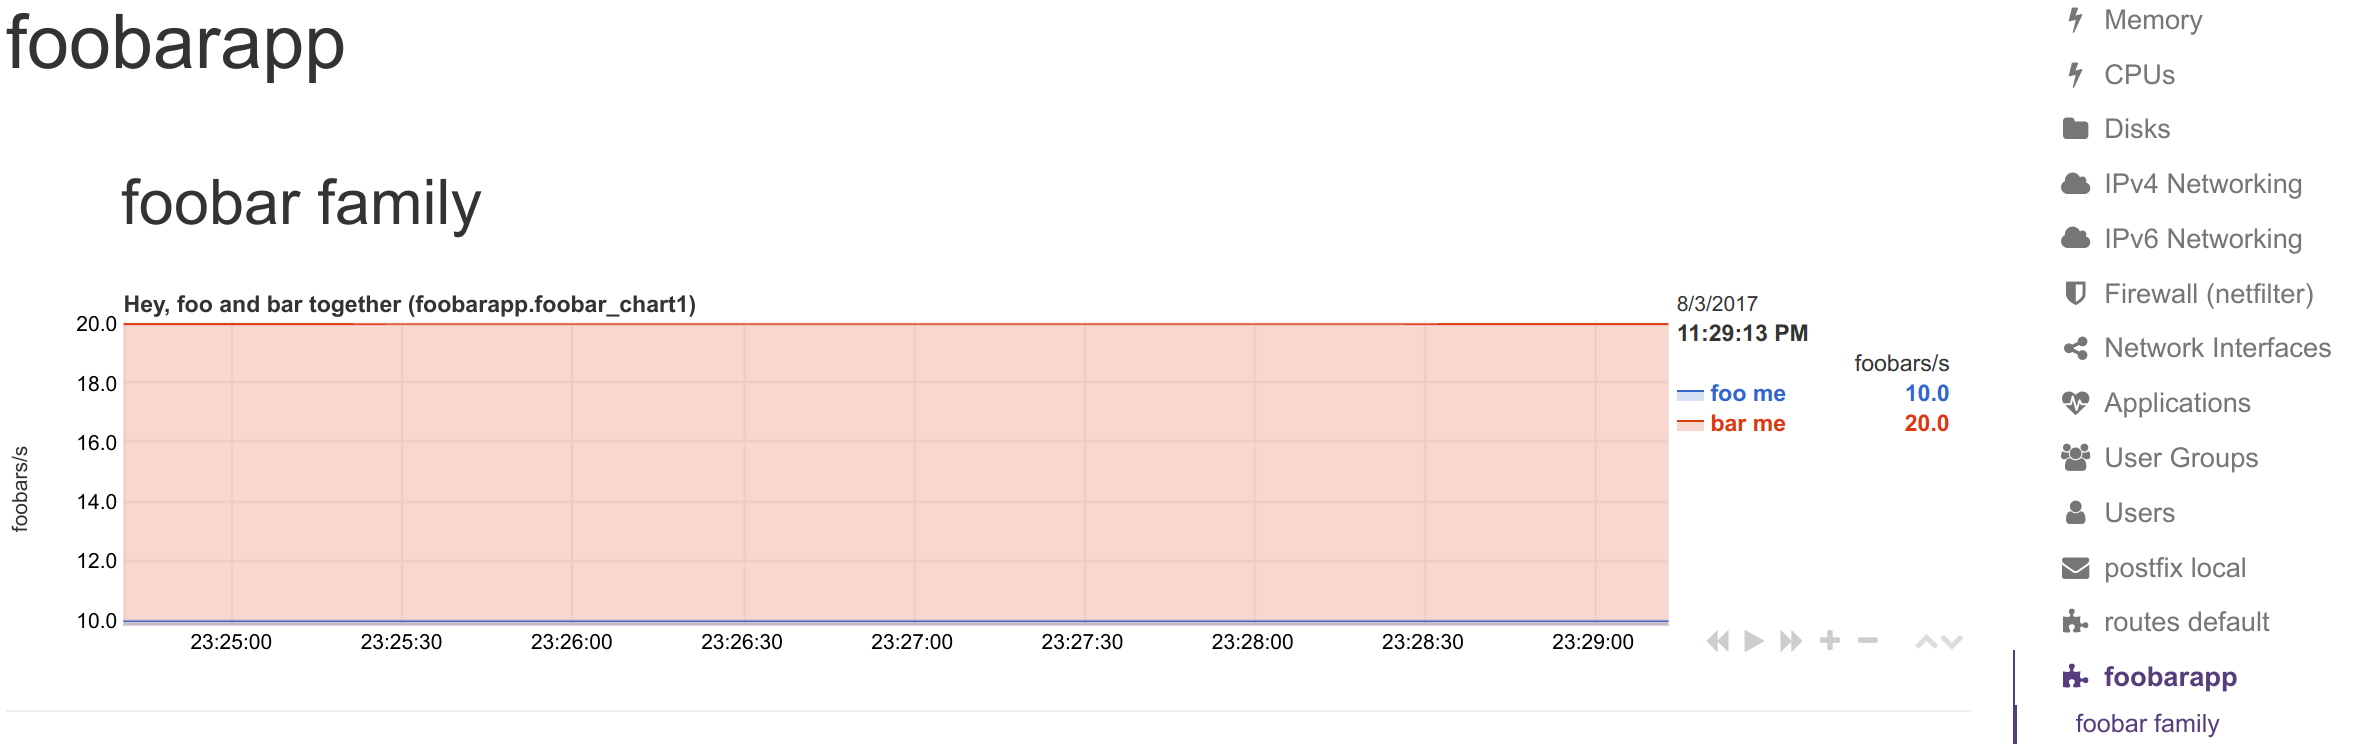
and this synthetic chart:
|
|
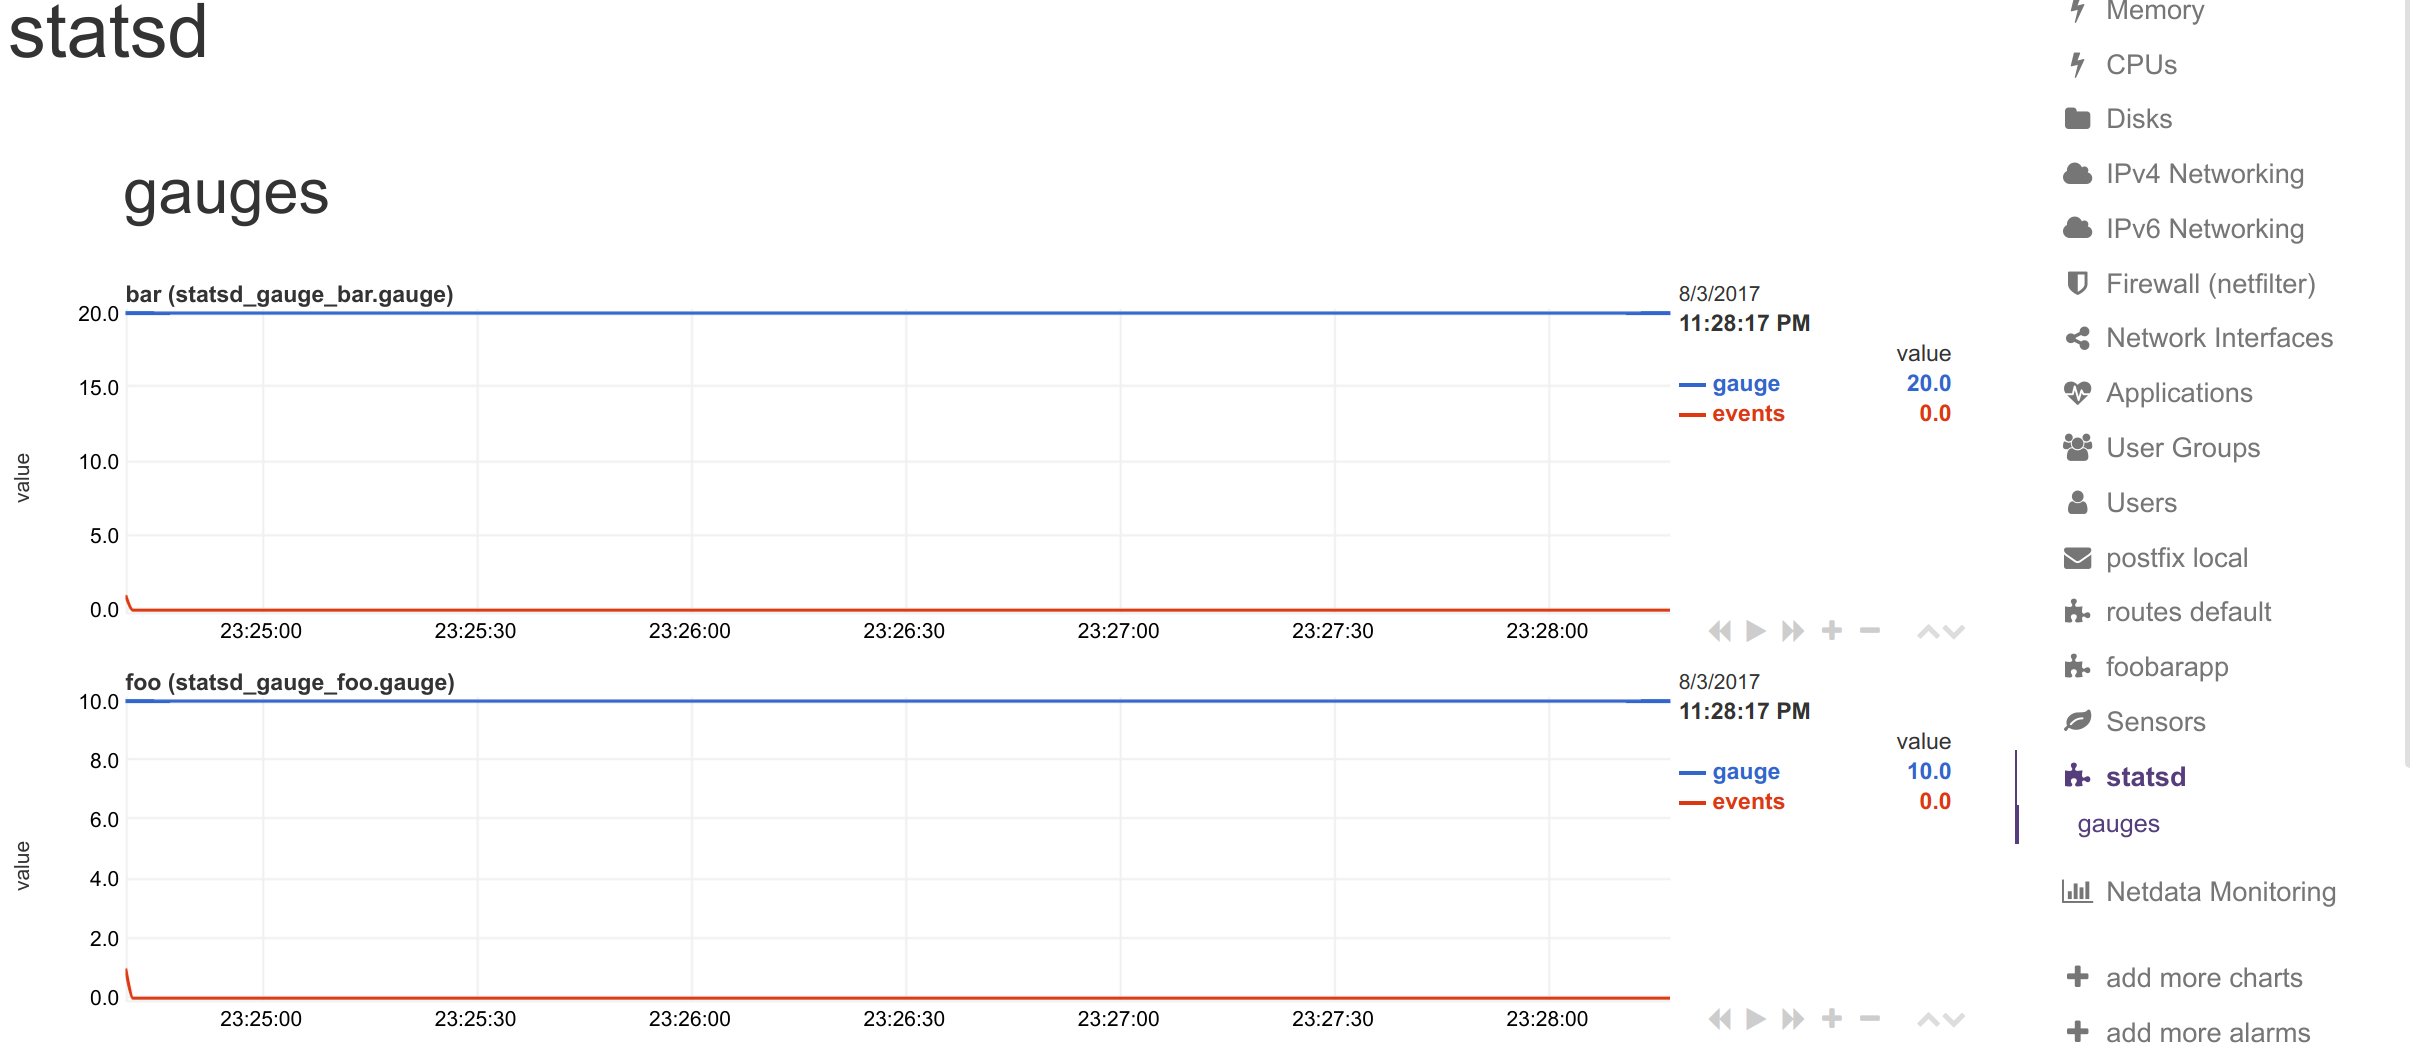
It still doesn't seem to be working for me. I have these gauges showing up. Notice the application doesn't show up on the right either.
I've used this .conf file. |

|
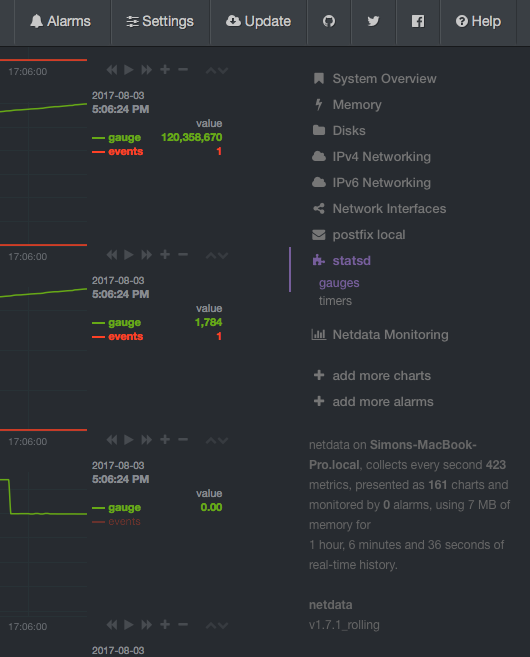
hm.. could you please post the whole charts menu? |
|
|
|
strange... It works for me:
Could you please remove all other |

|
I've also noticed in my custom chart, I can't do the following. I can't do this either. Only this works. Is it failing to load because the metrics are missing or improperly used? |
|
Did you post any values to these metrics after you created the .conf file? |
|
|
|
So I can't make my own custom dashboard that combine multiple gauges? I am pushing metrics to these gauges as we speak and have been the whole time. I can see them updating under statsd. There's no app shown in the menu at all. What could prevent that from happening? |
|
Please follow this procedure.
The idea is that:
If it still does not show up, please stop netdata, delete |
|
Here's the error log, thanks for all the help by the way! |
|
I don't see any statsd errors. Do you have the |
|
I have |
|
Closing this feature request. We will re-evaluate the request internally. |
I wrote a simple plugin according to method 2 here. It works well in my usecase. https://gist.github.com/lyc8503/5698e5194001cbfc753dcdc2673f3afe |
How can I show multiple
cgroup_CONTAINER_NAME.mem_usageon same chart with legend specified by myself? I think I can achieve that by creating own plugin but I don't understand how to gather information from other plugins.Thank you!
The text was updated successfully, but these errors were encountered: