pluginsd python.d slowly eating more and more CPU due to smartd collection #6532
Comments
|
Hey @aleks-mariusz So you are saying that the only enabled python collector is This is strange because How it works - it reads only one line and only if the log files is modified every netdata/collectors/python.d.plugin/smartd_log/smartd_log.chart.py Lines 545 to 556 in adb7026 read last line func netdata/collectors/python.d.plugin/python_modules/bases/collection.py Lines 76 to 84 in adb7026 Maybe the func is bugged, but this is very unlikely. However you can test the func in the python interpreter.
Could you update to the latest and see if the problem is sovled or not. |
|
@aleks-mariusz have you tried to run python.d in debug mode ?
|
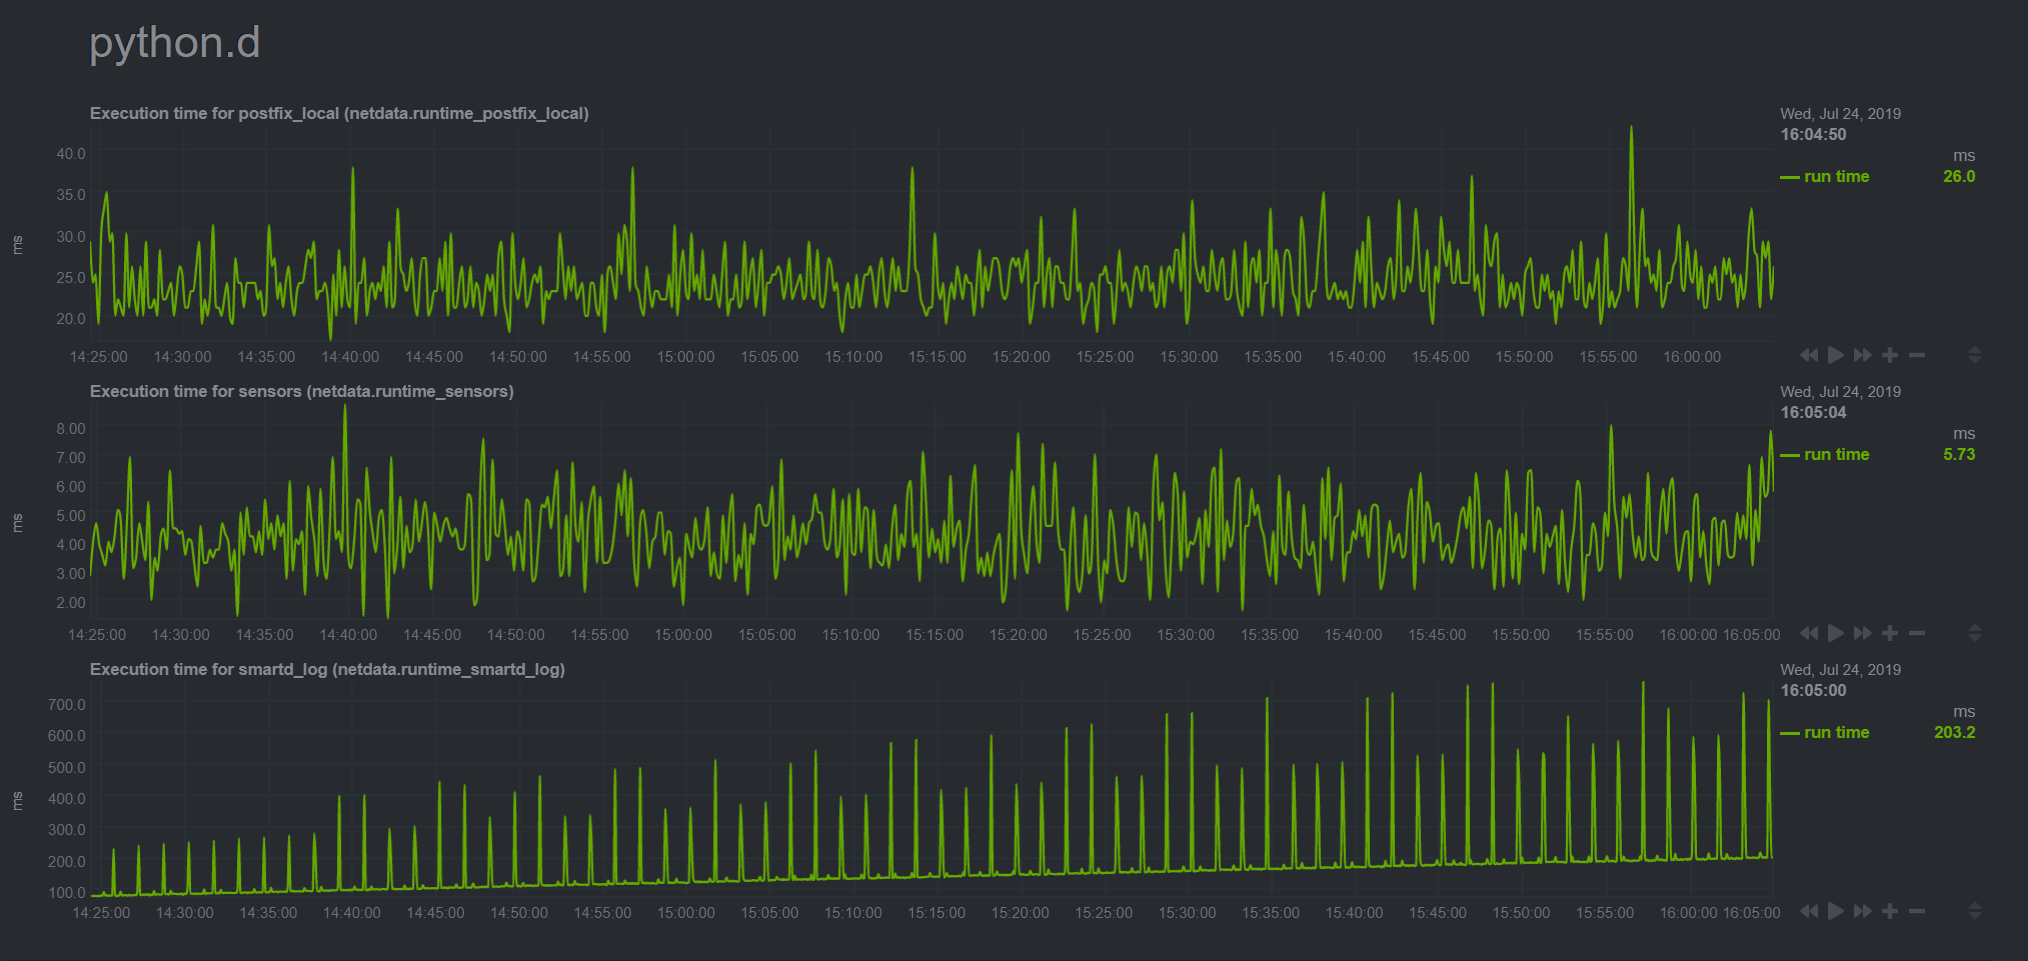
i would imagine it should be pretty lightweight, however, the graph below shows a gradually increasing execution time for this collector specifically..
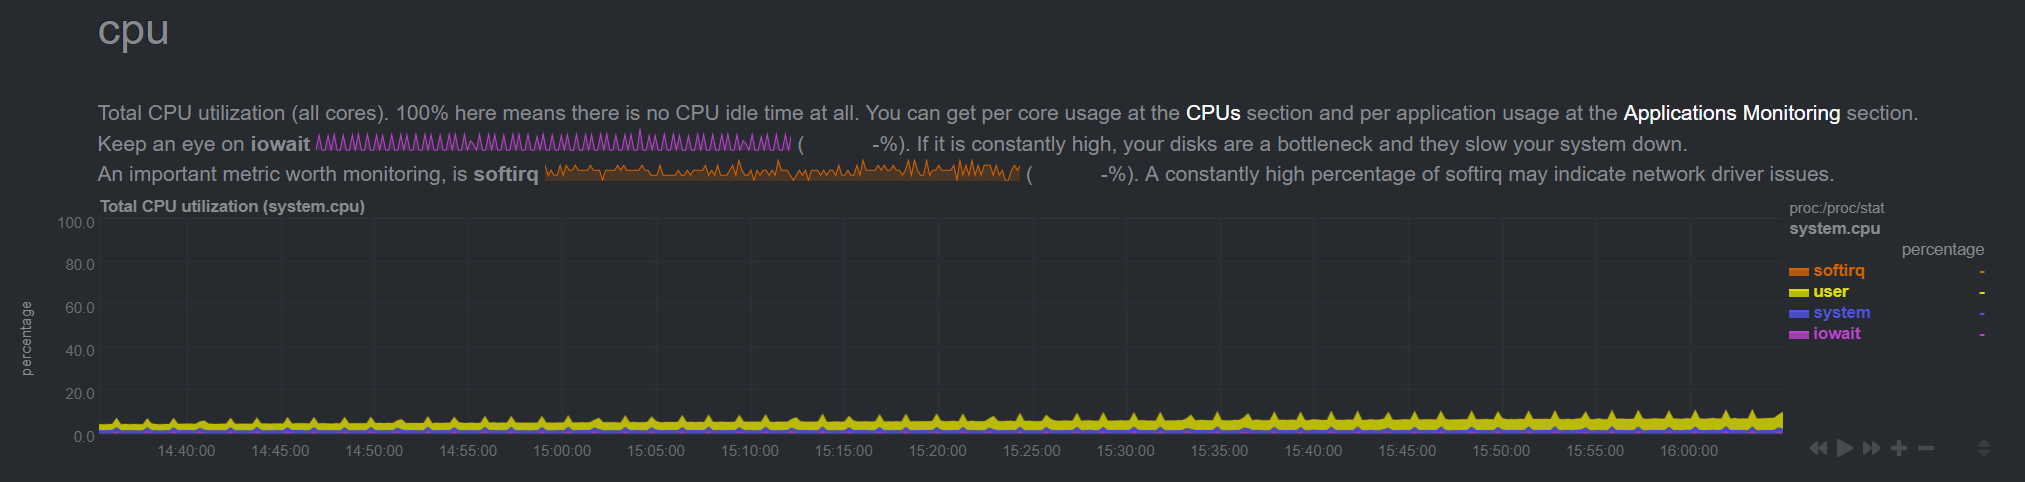
And this corresponds fairly well with the gradual rate of increase in CPU consumption of the python.d plugin..
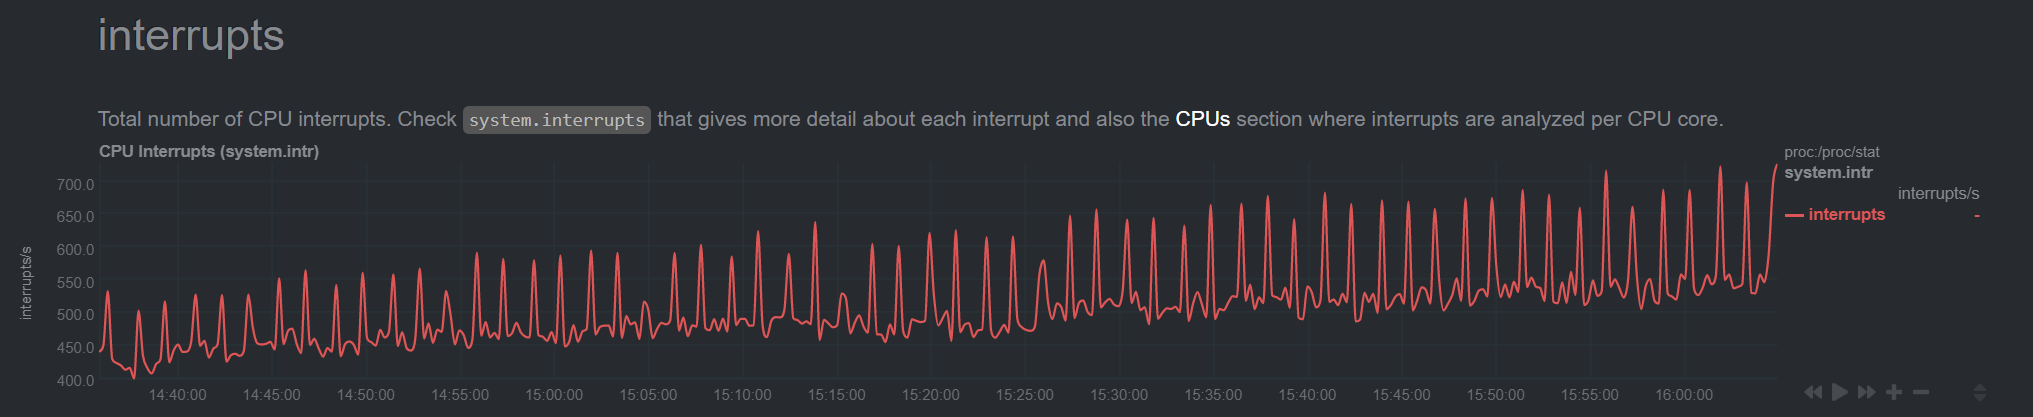
these is a corresponding with time spent in interrupts on the rise, but these are LOC interrupt which just means the system is becoming more busy handling multithreading
Seems not unreasonable to thus suspect the smartd collector code (the other 2 runtimes that python.d is reporting on with its self-monitoring graph are
Considering neither file you linked to has changed since 1.15.0 was released, i'm doubtful that it's been fixed :-) However, if you have an RPM of say a nightly build you can point me to, i can give it a try and rollback easily if it doesn't solve things..
Nothing in the output of running the above jumps out at me as unusual. I see it polling pretty frequently.. which seems unecessary as smartd attributes don't typically change within seconds of each other and take on the order of a minute or two to update.. However again the symptom happens very gradually and takes several hours to manifest (the CPU usage gradually creeps very roughly at 10% usage increase every hour or two?) |

it returns cached data. As i said it reads one line (last one) and only if the file is changed. netdata/collectors/python.d.plugin/smartd_log/smartd_log.chart.py Lines 637 to 645 in 19f1bd1 netdata/collectors/python.d.plugin/smartd_log/smartd_log.chart.py Lines 545 to 547 in 19f1bd1 netdata/collectors/python.d.plugin/smartd_log/smartd_log.chart.py Lines 553 to 556 in 19f1bd1 |
|
Lets try to debug it. netdata/collectors/python.d.plugin/smartd_log/smartd_log.chart.py Lines 643 to 645 in 19f1bd1 You can add |
|
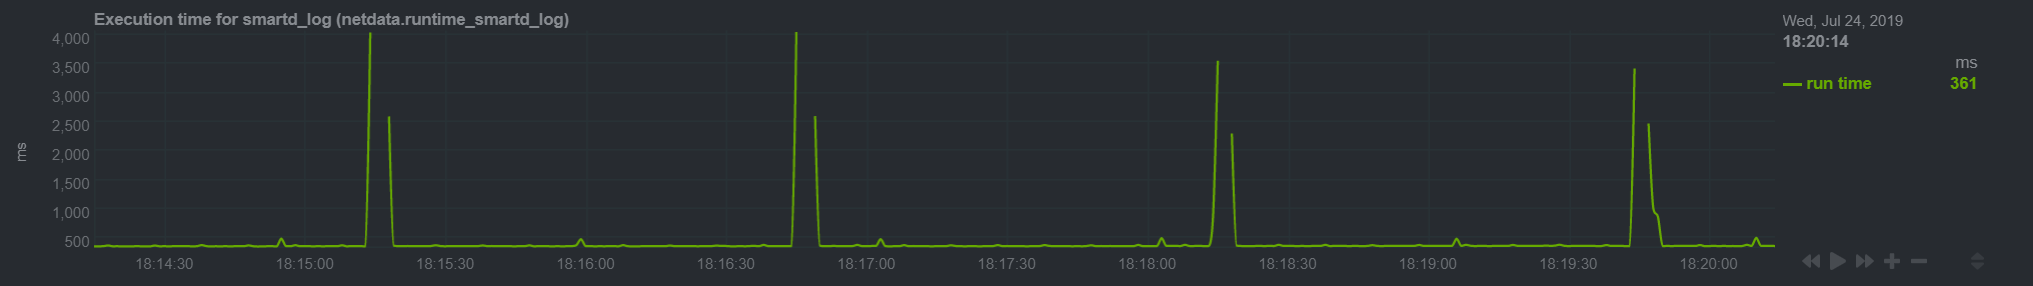
How often smartd logs to the files? Sorry, which files specifically are we asking about? The CSV ones in possibly relatedly, from this graph at the normal time-scale, the execution value currently hovers during "idle" currently at roughly 360ms (!), then that starts to spike every 90 seconds to a value about 10x as much in a second, then 5 seconds later it returns to the "low" value of 360ms.. there are also syncopated tiny bumps (barely reaching an execution value time of 500ms), roughly 60 seconds apart..
there's a clear correlation between how often smartd is writing to the CSV files and the spike and accompanying gaps.. but what's more concerning is that between those spikes the "idle" time it hovering at continually increases higher and higher.. THIS is the cause of the gradual CPU usage increase.. i am guessing there's something with the way the python code is handling my huge CSV files, that only grow (the largest of my CSV files is almost 60M and there are 12 of them, as evident from the upward trend of CPU usage by python.d that mirror image matches the execution time for the graph for smartd in a previous comment:
Attaching the log output of the debug run after the code change: |

|
could you do
|
|
|
@aleks-mariusz could you test the fix? |
|
applied the fix and restarted netdata on my nas.. will leave this running overnight, will report back tomorrow morning (i'm in GMT+1) how it looks.. by then should be pretty evident if the plugin's process is requiring more cycles as per the symptom described above, |
|
We can test it very fast Change the value to 1
|
|
hey clever thinking about changing the rescan interval to expedite the simulation.. however it was late in the day and it didn't occur to me, plus i just thought the easiest, most realistic test would be with all the other settings and values as is (only the patch applied).. in any case, i am happy to confirm that CPU usage has remained low and has not crept up at all any more, so your reasoning for the fix was spot on!
now the execution time is fairly consistent and doesn't show any upward trend over the time frame above and previously of 90 minutes.. I have to ask though, what's the reason for the re.sub() deduplicating of the underscores in the first place, that the fix still preserve but saves a raw_name w/o any modification ? |

|
i want to keep name clean because it is used as dimension name netdata/collectors/python.d.plugin/smartd_log/smartd_log.chart.py Lines 729 to 733 in 8e695f0
looks better then
|
raw_name is needed because we check if the disk log file is already collected before Disk objcet is created netdata/collectors/python.d.plugin/smartd_log/smartd_log.chart.py Lines 676 to 686 in b74cc9a
|
|
awesome explanation! thanks for being so thorough, recognizing the issue so quickly and resolving it with 24 hours of reporting it.. i <3 netdata and it's good to see it's in good hands! Looking forward to v1.17 being released (as an RPM one day)! :-D |
What do you mean "one day"? https://packagecloud.io/netdata/netdata !!! |
Bug report summary
Several hours after (re)starting netdata, the python /usr/libexec/netdata/plugins.d/python.d.plugin plugin ends up using 100% of one CPU. This happens gradually, and it appears to be related to my smartd collection.
I've attached a screenshot of the CPU usage hovering around ~27% (so this roughly is 1 core of a 4 core system).
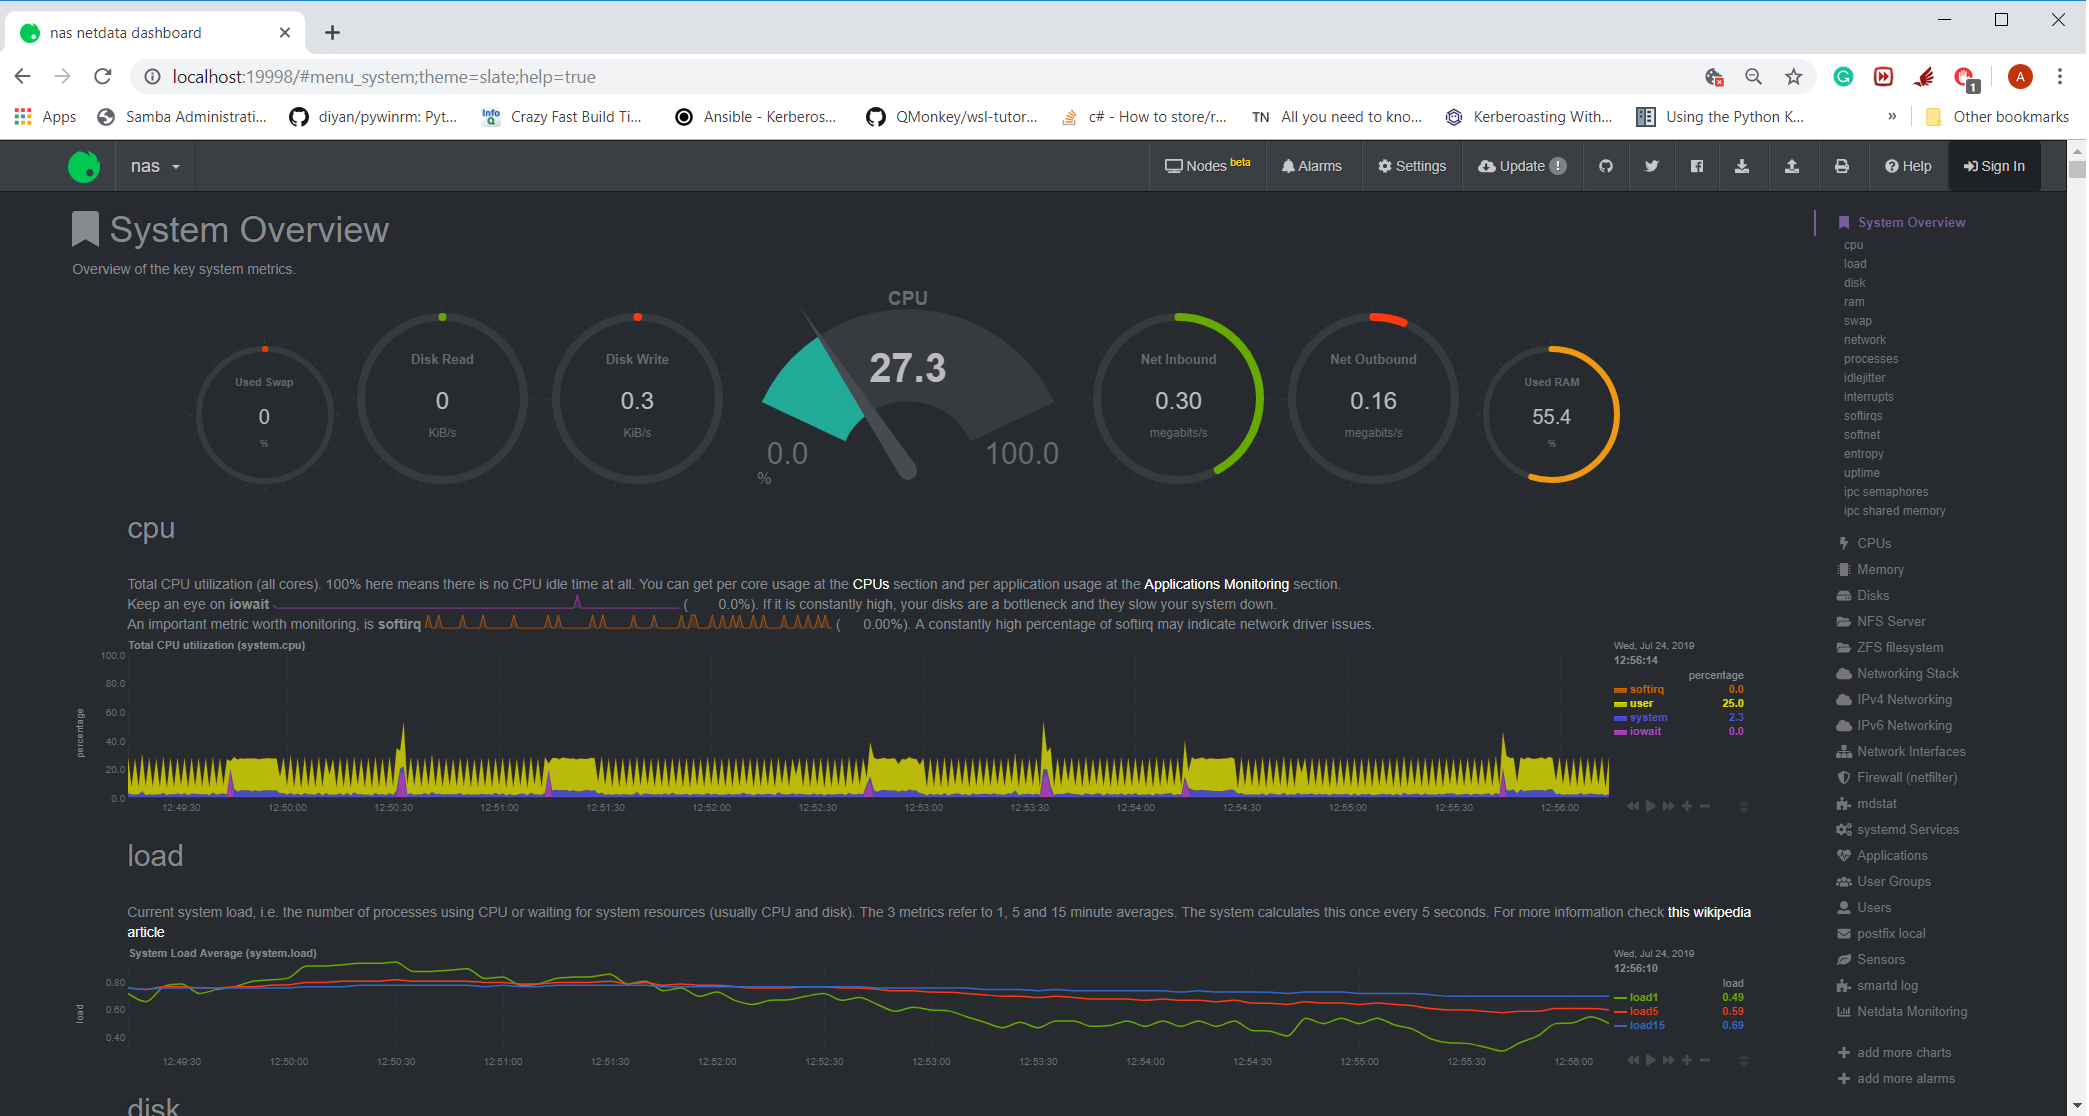
I'm not too familiar with netdata internals but from the errors in the log files (attached after expected behavior below), it looks like the time it takes to collect something from smartctl is skewing the clock time of the samples possibly?
If we look at the graph for execution time for smartd_log, there are periods where it exceeds 10 seconds and there are gaps in both that graph (as well as the smartd related graphs in the relevant section)
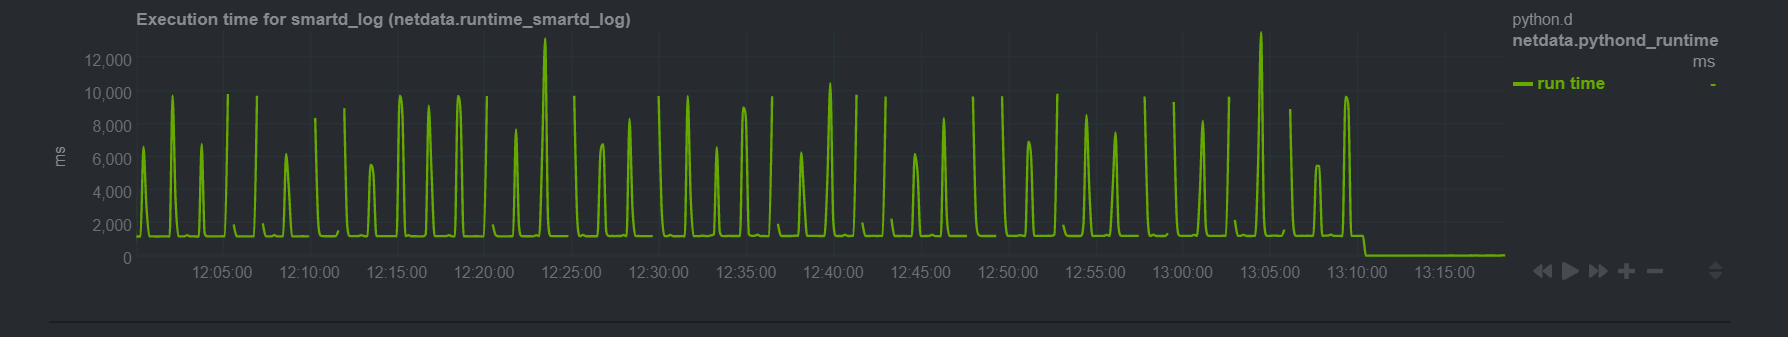
(the flat lining at the right of the graph is me restarting netdata to re-set the CPU usage).OS / Environment
CentOS 7.6 with netdata installed as an RPM (from epel repo), running on a NAS box w/ 11 sata drives (3 for OS/caching and 8 for data), running on top of ZFS (that shouldn't matter though), perhaps the quantity of drives does?
Netdata version (ouput of
netdata -V)netdata v1.15.0
Component Name
python.d.plugin
Steps To Reproduce
start (or re-start) netdata, have the smartd collector enabled (by default if smartmontools RPM is installed), the CPU usage starts off reasonable (single digit usage of one core), over time this uses more and more cycles and eventually it consumes 100% of the single core it's running on
Expected behavior
should stay low CPU usage regardless of how long netdata was running
Log entries
tailing the output of /var/log/netdata/error.log shows the following
The text was updated successfully, but these errors were encountered: