Spencer Krum (@nibalizer)
In this workshop you'll be introduced to Falco, a security tool. Falco is a Cloud Native Computing Foundation (CNCF) incubating project and is Open Source(Apache 2 Licensed).
Falco helps you identify security threats in real time by detecting malicious activity. It works by watching system calls as they are processed by the kernel. This means it's much harder for bad actors to hide from falco, and that falco has first-class container and kubernetes support.
![]()
To get you hands on access with Falco we're giving you a free IBM Cloud Account and free IBM Cloud Kubernetes Cluster. You require zero money or credit card info to do this workshop.
Table of Contents
-
- Account
- Cloud Shell
- Kubernetes Cluster checkout
- Kubernetes 101 really fast
-
Installing Falco in Kubernetes
- Verify Kubernetes Configuration
- Installing Helm
- Cloning charts repo
- Configure values.yaml for helm
- Helm install
-
- Tail logs in pod
- Create events
- Switch to json output
- Read more events, use jq
-
- slack output / discord output
- set custom string in falco sidekick
- brief view of other outputs
-
- rule edit
- apply using helm
- trigger rule
- adjust macros
- apply using helm
- trigger rule
- write a rule from scratch
- adjust macros
- trigger rule
-
- Setup LogDNA
- Configure kubernetes to ship logs to LogDNA
-
- Configure
- Use go client
- Use python client
- Use rust client
- For python client - make it do another thing (batch probably)
Sign up for a free IBM Cloud account or log in with this link. Or if that doesn't work - simply going to cloud.ibm.com and pressing 'create an account' will work.
You might want to ask your IBM instructor to whitelist the public IP and or the above signup link at the following registration whitelisting site: https://cloud.ibm.com/registration/whitelist
If you have already an IBM lite account or a Pay-As-You-Go account please access your IBM Cloud Dashboard by clicking the above link, and check the Step 4 - Next Steps section.


You will need to do a verification step. Tell your instructor if you have any issues.
Instead of creating a Kubernetes cluster in your account, we are giving you access to a pre-created cluster in an IBM controlled (and paid) account. This gives you the full paid cluster experience which is superior to the limitations of a free trial and doesn't require you to put in a credit card.
Navigate to the cluster checkout page. Use the password ikslab and use the email you signed up for IBM Cloud with.

You've been given a cluster. You'll see the following view. This means a cluster has been granted to you.

Return to the main cloud page at cloud.ibm.com

Once there, use the user account switcher (see screenshot) to switch accounts to "1840867-IBM". We'll do the majority of the work in this account. If this worked, you should see "1" under the resource summary in the middle left.
Log in to the IBM Cloud to access the dashboard.
Click on the top right terminal icon to launch the IBM Cloud Shell.

Run the ibmcloud ks clusters command to verify the terminal and setup for access to the cluster
ibmcloud ks clusters
it's ok to ignore warnings you may see about versions of plugins or kubernetes cluster versions
If you don't see any clusters listed, you probably need to switch accounts. See "Switching accounts to the IBM provided account" above.

Configure the kubectl cli available within the terminal for access to your cluster.
ibmcloud ks cluster config --cluster mycluster
Verify access to the Kubernetes API.
kubectl get namespace
You should see output similar to the following, if so, then your're ready to continue.
NAME              STATUS   AGE
default           Active   125m
ibm-cert-store    Active   121m
ibm-system        Active   124m
kube-node-lease   Active   125m
kube-public       Active   125m
kube-system       Active   125m
In some of the labs, you will be creating Kubernetes resources by applyig .yaml files representing the desired state for the resource. To save typing in all of that, clone the lab repository into your web terminal:
git clone https://github.com/nibalizer/falco-workshop
you should see:
Cloning into 'falco-workshop'...
remote: Enumerating objects: 61, done.
remote: Counting objects: 100% (61/61), done.
remote: Compressing objects: 100% (44/44), done.
remote: Total 61 (delta 13), reused 61 (delta 13), pack-reused 0
Unpacking objects: 100% (61/61), done.
This is an optional exercise. If you are new to Kubernetes, these basics will give you some baseline experience (we move quite quickly later).
In this part of the lab we will deploy an application called guestbook that has already been built and uploaded to DockerHub under the nameibmcom/guestbook:v1. In Kubernetes, creating an application means deploying a set of pods that run containers. In this lab, you will begin with the most simple scenario of creating a deployment with a single pod using the kubectl cli.
-
Create the
guestbookapplication deployment:kubectl create deployment guestbook --image=ibmcom/guestbook:v1This action will take a bit of time. To check the status of the running application, you can use:
kubectl get podsYou should see output similar to the following:
$ kubectl get pods
NAME                          READY     STATUS              RESTARTS   AGE
guestbook-59bd679fdc-bxdg7    0/1       ContainerCreating   0          1m
Eventually, the status should show up as
Running.$ kubectl get pods NAME READY STATUS RESTARTS AGE guestbook-59bd679fdc-bxdg7 1/1 Running 0 1m
The end result of the run command is not just the pod containing our application containers, but a Deployment resource that manages the lifecycle of those pods.
-
Once the status reads
Running, we need to expose that deployment as a Service so that it can be accessed. By specifying a service type ofNodePort, the service will also be mapped to a high-numbered port on each cluster node. Theguestbookapplication listens on port 3000, so this is also specified in the command. Run:kubectl expose deployment guestbook --type="NodePort" --port=3000$ kubectl expose deployment guestbook --type="NodePort" --port=3000 service "guestbook" exposed
-
To find the port used on that worker node, examine your new service:
kubectl get service guestbook$ kubectl get service guestbook NAME TYPE CLUSTER-IP EXTERNAL-IP PORT(S) AGE guestbook NodePort 172.21.12.235 <none> 3000:30805/TCP 1m
The output shows that the
<nodeport>is30805. The service will take incoming connections to the high numbered port,30805and forward to port3000to the container inside the pod. For a service of type NodePort, a port in the range 30000-32767 is automatically chosen, and could be different for you. -
guestbookis now running on your cluster, and exposed to the internet. We need to find out where it is accessible. The worker nodes running in the container service get external IP addresses. Run$ ibmcloud cs workers <name-of-cluster>, and note the public IP listed on the<public-IP>line.ibmcloud ks workers -c mycluster$ ibmcloud ks workers -c mycluster OK ID Public IP Private IP Flavor State Status Zone Version kube-hou02-pa1e3ee39f549640aebea69a444f51fe55-w1 184.172.252.167 10.76.194.30 free normal Ready hou02 1.14.7_1535
We can see that our
<public-IP>is184.172.252.167. -
Now that you have both the address and the port, you can now access the application in the web browser at
<public-IP>:<nodeport>. In the example case this is184.172.252.167:30805. Enter in a browser tab your IP address and NodePort for your deployment. Try out the guestbook by putting in a few entries. Keep this browser tab handy as you can use it in the next exercise as well.
Congratulations, you've now deployed an application to Kubernetes!
At its core, you can think of Kubernetes as being a highly-available database and a collection of watchers and controllers. Kubernetes objects and their required metadata, such as a name and their desired state, are stored in this database and the watchers and controllers act to ensure that the configuration of actual resources in the cluster matches the state stored in the database.

Included in Kubernetes are a number of basic objects necessary for supporting applications as well as abstractions to simplify the configuration and management of applications. The most common basic object is a pod which encapsulates one or more containers along with storage resources, a unique network address and configuration options. The pod reflects the smallest unit of deployment. Although pods are technically transient, they will usually run until something destroys them, either a human operator or a controller. A Deployment is an abstraction that you can use to create a deployment of an application. It provides support for horizontally scaling pods, updating the container image used by the pods and also rollbacks.
To create your application, you used the kubectl command to create a deployment object and provided a name for the deployment, "guestbook", and also the container image to use. These options were combined with defaults for the object to create the desired state that was stored in the database. Reconciliation of the desired state resulted in a single pod being started in the cluster. Then, you used the kubectl expose command to make the deployment resource accessible both inside and outside of the cluster. This command creates a Service for a number of different resource types (deployment, replica set, replication controler, pod) to allow access to a network port on the resource.
You may want to set up an alias for kubectl to make typing faster. This is optional.
alias k=kubectlCongratulations, you've finished the preamble. On to the meat of the workshop.
Falco is a cloud-native runtime security system that works with both containers and raw Linux hosts. It is developed by Sysdig and is an incubating project in the Cloud Native Computing Foundation. Falco works by looking at file changes, network activity, the process table, and other data for suspicious behavior and then sending alerts through a pluggable back end. It inspects events at the system call level of a host through a kernel module or an extended BPF probe. Falco contains a rich set of rules that you can edit for flagging specific abnormal behaviors and for creating allow lists for normal computer operations.
In this tutorial, you learn to install and set up Falco on a Kubernetes cluster on IBM Cloud, create a synthetic security incident, and view the incident in Falco. Then, you send all security incidents into LogDNA for aggregation. Finally, you wire up Falco to send security alerts at run time to Slack. This tutorial works equally well on standard Kubernetes and on Red Hat OpenShift on IBM Cloud.
From wikipedia:
In computing, a system call (commonly abbreviated to syscall) is the programmatic way in which a computer program requests a service from the kernel of the operating system on which it is executed. This may include hardware-related services (for example, accessing a hard disk drive), creation and execution of new processes, and communication with integral kernel services such as process scheduling. System calls provide an essential interface between a process and the operating system.
System Calls are involved whenever your code is actually doing something on the system. Writing files, reading files, opening network ports, getting the system time, etc all eventually result in a system call being performed. Let's see them in action:
Create a file:
[nibz@fermi falco]$ echo "this is a test" > test.txt
Dump the file to standard out
[nibz@fermi falco]$ cat test.txt
this is a test
Imagine that test.txt held some data we wanted to keep secure. Any attempt by a program to read that data should be considered a potential breach.
Now run the cat command inside strace, which will run the same command but show you which systemcalls are being run. Note that strace is not available on the cloud shell. See "Running without strace" below.
[nibz@fermi falco]$ strace cat test.txt
execve("/usr/bin/cat", ["cat", "test.txt"], 0x7ffe85066b98 /* 34 vars */) = 0
brk(NULL)                               = 0x55a7ee915000
arch_prctl(0x3001 /* ARCH_??? */, 0x7ffe23bc1780) = -1 EINVAL (Invalid argument)
access("/etc/ld.so.preload", R_OK)      = -1 ENOENT (No such file or directory)
openat(AT_FDCWD, "/etc/ld.so.cache", O_RDONLY|O_CLOEXEC) = 3
fstat(3, {st_mode=S_IFREG|0644, st_size=97284, ...}) = 0
mmap(NULL, 97284, PROT_READ, MAP_PRIVATE, 3, 0) = 0x7f63bc95d000
close(3)                                = 0
openat(AT_FDCWD, "/usr/lib/libc.so.6", O_RDONLY|O_CLOEXEC) = 3
read(3, "\177ELF\2\1\1\3\0\0\0\0\0\0\0\0\3\0>\0\1\0\0\0\220\202\2\0\0\0\0\0"..., 832) = 832
pread64(3, "\6\0\0\0\4\0\0\0@\0\0\0\0\0\0\0@\0\0\0\0\0\0\0@\0\0\0\0\0\0\0"..., 784, 64) = 784
pread64(3, "\4\0\0\0\20\0\0\0\5\0\0\0GNU\0\2\0\0\300\4\0\0\0\3\0\0\0\0\0\0\0", 32, 848) = 32
pread64(3, "\4\0\0\0\24\0\0\0\3\0\0\0GNU\0\364[g\253(\257\25\201\313\250\344q>\17\323\262"..., 68, 880) = 68
fstat(3, {st_mode=S_IFREG|0755, st_size=2159552, ...}) = 0
mmap(NULL, 8192, PROT_READ|PROT_WRITE, MAP_PRIVATE|MAP_ANONYMOUS, -1, 0) = 0x7f63bc95b000
pread64(3, "\6\0\0\0\4\0\0\0@\0\0\0\0\0\0\0@\0\0\0\0\0\0\0@\0\0\0\0\0\0\0"..., 784, 64) = 784
mmap(NULL, 1868448, PROT_READ, MAP_PRIVATE|MAP_DENYWRITE, 3, 0) = 0x7f63bc792000
mmap(0x7f63bc7b8000, 1363968, PROT_READ|PROT_EXEC, MAP_PRIVATE|MAP_FIXED|MAP_DENYWRITE, 3, 0x26000) = 0x7f63bc7b8000
mmap(0x7f63bc905000, 311296, PROT_READ, MAP_PRIVATE|MAP_FIXED|MAP_DENYWRITE, 3, 0x173000) = 0x7f63bc905000
mmap(0x7f63bc951000, 24576, PROT_READ|PROT_WRITE, MAP_PRIVATE|MAP_FIXED|MAP_DENYWRITE, 3, 0x1be000) = 0x7f63bc951000
mmap(0x7f63bc957000, 12960, PROT_READ|PROT_WRITE, MAP_PRIVATE|MAP_FIXED|MAP_ANONYMOUS, -1, 0) = 0x7f63bc957000
close(3)                                = 0
mmap(NULL, 8192, PROT_READ|PROT_WRITE, MAP_PRIVATE|MAP_ANONYMOUS, -1, 0) = 0x7f63bc790000
arch_prctl(ARCH_SET_FS, 0x7f63bc95c5c0) = 0
mprotect(0x7f63bc951000, 12288, PROT_READ) = 0
mprotect(0x55a7ee160000, 4096, PROT_READ) = 0
mprotect(0x7f63bc9a1000, 4096, PROT_READ) = 0
munmap(0x7f63bc95d000, 97284)           = 0
brk(NULL)                               = 0x55a7ee915000
brk(0x55a7ee936000)                     = 0x55a7ee936000
fstat(1, {st_mode=S_IFCHR|0620, st_rdev=makedev(0x88, 0x9), ...}) = 0
openat(AT_FDCWD, "test.txt", O_RDONLY)  = 3
fstat(3, {st_mode=S_IFREG|0644, st_size=15, ...}) = 0
fadvise64(3, 0, 0, POSIX_FADV_SEQUENTIAL) = 0
mmap(NULL, 139264, PROT_READ|PROT_WRITE, MAP_PRIVATE|MAP_ANONYMOUS, -1, 0) = 0x7f63bc76e000
read(3, "this is a test\n", 131072)     = 15
write(1, "this is a test\n", 15this is a test
)        = 15
read(3, "", 131072)                     = 0
munmap(0x7f63bc76e000, 139264)          = 0
close(3)                                = 0
close(1)                                = 0
close(2)                                = 0
exit_group(0)                           = ?
+++ exited with 0 +++
In our systemcall output this line appears:
openat(AT_FDCWD, "test.txt", O_RDONLY) = 3
By identifying that pairing of systemcal = openat and filename = 'test.txt' we can identify when a potential security event has happened. This is the core of what Falco is going to do for you.
This falco rule would be able to detect that behavior:
- rule: Read secure .txt file
  desc: >
    an attempt to read the secure file test.txt
  condition: >
    fd.name = 'test.txt' and open_read
    and proc_name_exists
    and not proc.name in (whitelisted_programs)
  output: >
    Sensitive file opened for reading by non-trusted program (user=%user.name user_loginuid=%user.loginuid program=%proc.name
    command=%proc.cmdline file=%fd.name parent=%proc.pname gparent=%proc.aname[2] ggparent=%proc.aname[3] gggparent=%proc.aname[4] container_id=%container.id image=%container.image.repository)
  priority: WARNING
  tags: [filesystem, simple_test]
And the log line you'd get:
Sep 23 20:37:30 nibz-falco-dev falco: {"output":"20:37:30.199241060: Warning Sensitive file opened for reading by non-trusted program (user=root program=cat command=cat test.txt file=/root/test.txt parent=sudo gparent=bash ggparent=sshd gggparent=sshd)","priority":"Warning","rule":"Read sensitive file untrusted","time":"2020-09-23T20:37:30.199241060Z", "output_fields": {"evt.time":1600893450199241060,"fd.name":"/root/test.txt","proc.aname[2]":"bash","proc.aname[3]":"sshd","proc.aname[4]":"sshd","proc.cmdline":"cat /root/test.txt","proc.name":"cat","proc.pname":"sudo","user.name":"root"}}
Falco has configuration options to send these alerts to a variety of places. Syslog, slack, discord, lambda, IBM Cloud Functions, are all supported. For extensibility HTTP and gRPC are exposed to write your own sinks for events.
In the following section we'll go through the steps of installing falco, creating events, and processing those events with output tools.
The cloud shell environment doesn't have strace installed. We'll instead use a binary created by Liz Rice. "Strace in 60 lines of go"
Download the binary from remote server:
mytestmytest@cloudshell:~$ wget http://52.117.127.35:8080/strace-from-scratch

--2020-09-25 22:50:52--  http://52.117.127.35:8080/strace-from-scratch
Connecting to 52.117.127.35:8080... connected.
HTTP request sent, awaiting response... 200 OK
Length: 2450248 (2.3M) [application/octet-stream]
Saving to: ‘strace-from-scratch’

strace-from-scratch                        100%[=====================================================================================>]   2.34M  8.79MB/s    in 0.3s

2020-09-25 22:50:53 (8.79 MB/s) - ‘strace-from-scratch’ saved [2450248/2450248]
Mark as executable and run it:
mytestmytest@cloudshell:~$ chmod +x strace-from-scratch
mytestmytest@cloudshell:~$ ./strace-from-scratch cat myfile
Run [cat myfile]
Wait returned: stop signal: trace/breakpoint trap
yeet
        3|read
        1|write
        6|close
        5|fstat
        7|mmap
        4|mprotect
        2|munmap
        3|brk
        3|access
        1|execve
        1|arch_prctl
        1|fadvise64
        4|openat
You can see the openat syscall at the end of the output.
- Verify your
ibmcloudkubernetes cluster is valid
$ ibmcloud ks cluster get --cluster nibz-development
Retrieving cluster nibz-development...
OK

Name:                           nibz-development
ID:                             br3dsptd0mfheg0375g0
State:                          normal
Created:                        2020-05-21T20:02:47+0000
Location:                       dal12
Master URL:                     https://c108.us-south.containers.cloud.ibm.com:31236
Public Service Endpoint URL:    https://c108.us-south.containers.cloud.ibm.com:31236
Private Service Endpoint URL:   https://c108.private.us-south.containers.cloud.ibm.com:31236
Master Location:                Dallas
Master Status:                  Ready (4 days ago)
Master State:                   deployed
Master Health:                  normal
Ingress Subdomain:              nibz-development-dff43bc8701fcd5837d6de963718ad39-0000.us-south.containers.appdomain.cloud
Ingress Secret:                 nibz-development-dff43bc8701fcd5837d6de963718ad39-0000
Workers:                        3
Worker Zones:                   dal12
Version:                        1.18.2_1512
Creator:                        -
Monitoring Dashboard:           -
Resource Group ID:              75e353d82014457991ec7cbac09854ea
Resource Group Name:            Default
$ ibmcloud ks cluster config --cluster nibz-development
OK
The configuration for nibz-development was downloaded successfully.

Added context for nibz-development to the current kubeconfig file.
You can now execute 'kubectl' commands against your cluster. For example, run 'kubectl get nodes'.

$ kubectl get nodes -o wide
NAME            STATUS   ROLES    AGE     VERSION       INTERNAL-IP     EXTERNAL-IP     OS-IMAGE             KERNEL-VERSION      CONTAINER-RUNTIME
10.241.155.14   Ready    <none>   4d23h   v1.18.2+IKS   10.241.155.14   169.59.251.12   Ubuntu 18.04.4 LTS   4.15.0-99-generic   containerd://1.3.4
10.241.155.17   Ready    <none>   4d23h   v1.18.2+IKS   10.241.155.17   169.59.251.13   Ubuntu 18.04.4 LTS   4.15.0-99-generic   containerd://1.3.4
10.241.155.32   Ready    <none>   4d23h   v1.18.2+IKS   10.241.155.32   169.59.251.14   Ubuntu 18.04.4 LTS   4.15.0-99-generic   containerd://1.3.4
The container runtime environment is containerd.
Installing the Helm Client (helm)
You may have the helm client installed already, however, we want version 3 of helm. Verify with which helm and helm version on the command line. If you have helm version 3 already, skip to "Using the helm chart"
The Helm client (helm) can be installed from source or pre-built binary releases. In this lab, we are going to use the pre-built binary release (Linux amd64) from the Helm community. Refer to the Helm install docs for more details.
-
Download the latest release of Helm v3 for your environment, the steps below are for
Linux amd64, adjust the examples as needed for your environment. The cloud shell is runningLinux amd64. -
Unpack it:
$ tar -zxvf helm-v3.<x>.<y>-linux-amd64.tgz. -
Create a binary dir and put it at the front of your path (to cloak the old helm version).
$ mkdir -p ${HOME}/bin
$ cp linux-amd64/helm ${HOME}/bin
$ echo '' >> .bashrc # don't ask
$ echo 'export PATH=${HOME}/bin:${PATH}' >> .bashrc
$ source .bashrc- The Helm client is now installed and can be tested with the commands
helm helpandhelm version.
$ helm version
version.BuildInfo{Version:"v3.3.4", GitCommit:"a61ce5633af99708171414353ed49547cf05013d", GitTreeState:"clean", GoVersion:"go1.14.9"}
The source code you need is in the helm chart:
$ git clone https://github.com/falcosecurity/charts
Cloning into 'charts'...
remote: Enumerating objects: 456, done.
remote: Counting objects: 100% (456/456), done.
remote: Compressing objects: 100% (158/158), done.
remote: Total 456 (delta 316), reused 416 (delta 295), pack-reused 0
Receiving objects: 100% (456/456), 182.27 KiB | 2.76 MiB/s, done.
Resolving deltas: 100% (316/316), done.

$ cd charts/falco
$ ls
CHANGELOG.md  Chart.yaml  ci  OWNERS  README.md  rules  templates  values.yaml
This is the helm chart for installing falco. The entrypoint for configuration is values.yaml.
$ head values.yaml
# Default values for falco.

image:
  registry: docker.io
  repository: falcosecurity/falco
  tag: 0.25.0
  pullPolicy: IfNotPresent

docker:
  enabled: false
This lays out what version of falco you will be using, in this case 0.25.0. As this tutorial ages, you might try changing the tag to later versions or the master tag. The values.yaml file is our main entry point for configuration changes to the falco daemon, you can return to it often.
Change enabled: true to enabled: false in the docker stanza. You only use containerd support on the IBM Cloud so you want to disable Docker so that Kubernetes metadata is properly retrieved by the daemon. To do that set enabled: true to enabled: false in the docker section of the config command, around line 9.
$ helm install falco .
NAME: falco
LAST DEPLOYED: Tue May 26 19:42:59 2020
NAMESPACE: default
STATUS: deployed
REVISION: 1
TEST SUITE: None
NOTES:
Falco agents are spinning up on each node in your cluster. After a few
seconds, they are going to start monitoring your containers looking for
security issues.

No further action should be required.
And validate:
$ helm list
NAME    NAMESPACE       REVISION        UPDATED                                 STATUS          CHART           APP VERSION
falco   default         1               2020-09-26 00:34:51.827988144 +0000 UTC deployed        falco-1.4.0     0.25.0

$ k get pod
NAME          READY   STATUS    RESTARTS   AGE
falco-pwc5l   1/1     Running   0          4m47s

$ k logs falco-pwc5l
* Setting up /usr/src links from host
* Running falco-driver-loader with: driver=module, compile=yes, download=yes
* Unloading falco module, if present
* Trying to dkms install falco module

Kernel preparation unnecessary for this kernel.  Skipping...

Building module:
cleaning build area....
make -j4 KERNELRELEASE=4.15.0-99-generic -C /lib/modules/4.15.0-99-generic/build M=/var/lib/dkms/falco/96bd9bc560f67742738eb7255aeb4d03046b8045/build...........
cleaning build area....

DKMS: build completed.

falco.ko:
Running module version sanity check.

depmod...

DKMS: install completed.
* falco module installed in dkms, trying to insmod
* Success: falco module found and loaded in dkms
Tue May 26 19:43:39 2020: Falco initialized with configuration file /etc/falco/falco.yaml
Tue May 26 19:43:39 2020: Loading rules from file /etc/falco/falco_rules.yaml:
Tue May 26 19:43:40 2020: Loading rules from file /etc/falco/falco_rules.local.yaml:
Tue May 26 19:43:42 2020: Starting internal webserver, listening on port 8765
Don't worry if your output doesn't exactly match the above. However you should see the pods go into 'Running' state and the logs should be free of errors and mention "Falco initialized...".
During its first-run installation, Falco uses Dynamic Kernel Module Support (DKMS) to compile and install a kernel module, which is how Falco picks up the system calls.
Falco uses a service account in Kubernetes to access the Kubernetes API. Falco needs that access to be able to tie security incidents to the relevant container. The helm chart sets up a common role-based access control triple approach: a ServiceAccount, a ClusterRole, and a ClusterRoleBinding. The ClusterRole has the information around what access is being given. If you change nothing in these files, the Falco daemon can only read and list, but not modify any object in the Kubernetes API.
$ ls templates/clusterrolebinding.yaml templates/service account.yaml templates/clusterrole.yaml
templates/clusterrolebinding.yaml  templates/clusterrole.yaml  templates/serviceaccount.yaml
$ k get clusterrole falco
NAME    CREATED AT
falco   2020-05-26T19:43:00Z
$ k get serviceaccount falco
NAME    SECRETS   AGE
falco   1         7m54s
$ k get clusterrolebinding falco
NAME    ROLE                AGE
falco   ClusterRole/falco   7m59s
You can inspect these resources deeper with the -o yaml flag. Note that not all kubernetes resources are namespaced. clusterrole and clusterrolebinding are not namespaced but serviceaccount is namespaced.
Falco runs a daemonset for the falco daemon itself. Daemonsets are a nice fit for falco as they ensure a single copy of the program per physical node.
$ k get ds
NAME    DESIRED   CURRENT   READY   UP-TO-DATE   AVAILABLE   NODE SELECTOR   AGE
falco   3         3         3       3            3           <none>          11m
Falco's configuration is split up into several files. falco.yaml refers to configuration of the daemon's particulars: output type, ports, etc. The other *_rules.yaml files contain the checks that Falco fires against (shells being opened, files being modified, etc.). falco.yaml will be templated out by the helm chart and the rules files will be copied directly. The daemonset mounts this configmap under /etc/falco.
# The template for falco.yaml:

$ head -n 25 templates/configmap.yaml | tail -n 15
  falco.yaml: |-
    # File(s) or Directories containing Falco rules, loaded at startup.
    # The name "rules_file" is only for backwards compatibility.
    # If the entry is a file, it will be read directly. If the entry is a directory,
    # every file in that directory will be read, in alphabetical order.
    #
    # falco_rules.yaml ships with the falco package and is overridden with
    # every new software version. falco_rules.local.yaml is only created
    # if it doesn't exist. If you want to customize the set of rules, add
    # your customizations to falco_rules.local.yaml.
    #
    # The files will be read in the order presented here, so make sure if
    # you have overrides they appear in later files.
    rules_file:
      {{- range .Values.falco.rulesFile }}

# The rules files:

$ ls rules/
application_rules.yaml  falco_rules.local.yaml  falco_rules.yaml  k8s_audit_rules.yaml
# Inspect in kubernetes
k get cm falco
NAME    DATA   AGE
falco   5      16m
Now, take a peek at the configuration you set up for Falco.
Run the following command to tell the DaemonSet to run with the service account and permissions you set up earlier:
$ kubectl get ds falco -o yaml | grep serviceAcc
      serviceAccount: falco-account
Check out the serviceaccount for details. This configuration provides read access to almost everything in the Kubernetes API server.
You mount many important directories from the Kubernetes host into the Falco pod:
$ k get ds falco -o yaml | grep -A 11 volumes:
      volumes:
        - name: containerd-socket
          hostPath:
            path: /run/containerd/containerd.sock
        - name: dev-fs
          hostPath:
            path: /dev
        - name: proc-fs
          hostPath:
            path: /proc
        - name: boot-fs
          hostPath:
This step enables Falco to interact with the container runtime environment to pull container metadata (like the container name and underlying image name) and to query the host's process table to discover process names. Also note that this example maps the containerd-socket as well as the docker-socket. This is because IBM Cloud Kubernetes Service uses containerd as the container runtime.
Falco is configured by several YAML files that you set up via a ConfigMap. falco.yaml configures server settings and falco_rules.yaml contains rules for what to alert on and at what level.
$ ls rules/
application_rules.yaml  falco_rules.local.yaml  falco_rules.yaml  k8s_audit_rules.yaml
This rule watches for potentially nefarious Netcat commands and throws alerts when it sees them at the WARNING level.
$ cat rules/falco_rules.yaml | grep -A 12 'Netcat Remote'
- rule: Netcat Remote Code Execution in Container
  desc: Netcat Program runs inside container that allows remote code execution
  condition: >
    spawned_process and container and
    ((proc.name = "nc" and (proc.args contains "-e" or proc.args contains "-c")) or
     (proc.name = "ncat" and (proc.args contains "--sh-exec" or proc.args contains "--exec"))
    )
  output: >
    Netcat runs inside container that allows remote code execution (user=%user.name
    command=%proc.cmdline container_id=%container.id container_name=%container.name image=%container.image.repository:%container.image.tag)
  priority: WARNING
  tags: [network, process]
Now you can see Falco in action. You tail the logs in one terminal, and then synthetically create some events in the other terminal and watch the events come through the logs.
Run the following command:
$ k get pod
NAME          READY   STATUS    RESTARTS   AGE
falco-5lqs4   1/1     Running   0          23m
falco-lm2x2   1/1     Running   0          23m
falco-pwc5l   1/1     Running   0          23m
$ k logs -f falco-pwc5l
* Setting up /usr/src links from host
* Running falco-driver-loader with: driver=module, compile=yes, download=yes
* Unloading falco module, if present
* Trying to dkms install falco module

Kernel preparation unnecessary for this kernel.  Skipping...

Building module:
cleaning build area....
make -j4 KERNELRELEASE=4.15.0-99-generic -C /lib/modules/4.15.0-99-generic/build M=/var/lib/dkms/falco/96bd9bc560f67742738eb7255aeb4d03046b8045/build...........
cleaning build area....

DKMS: build completed.

falco.ko:
Running module version sanity check.

depmod...

DKMS: install completed.
* falco module installed in dkms, trying to insmod
* Success: falco module found and loaded in dkms
Tue May 26 19:43:39 2020: Falco initialized with configuration file /etc/falco/falco.yaml
Tue May 26 19:43:39 2020: Loading rules from file /etc/falco/falco_rules.yaml:
Tue May 26 19:43:40 2020: Loading rules from file /etc/falco/falco_rules.local.yaml:
Tue May 26 19:43:42 2020: Starting internal webserver, listening on port 8765
19:43:41.617274000: Notice Container with sensitive mount started (user=root command=container:1dab04047700 k8s.ns=default k8s.pod=falco-pwc5l container=1dab04047700 image=docker.io/falcosecurity/falco:0.23.0 mounts=/var/run/docker.sock:/host/var/run/docker.sock::true:private,/run/containerd/containerd.sock:/host/run/containerd/containerd.sock::true:private,/dev:/host/dev::false:private,/proc:/host/proc::false:private,/boot:/host/boot::false:private,/lib/modules:/host/lib/modules::true:private,/usr:/host/usr::false:private,/var/data/kubelet/pods/cae458b5-8f6e-4dac-8a44-cfbddbeb8a61/volumes/kubernetes.io~empty-dir/dshm:/dev/shm::true:private,/etc:/host/etc::false:private,/var/data/kubelet/pods/cae458b5-8f6e-4dac-8a44-cfbddbeb8a61/volumes/kubernetes.io~configmap/config-volume:/etc/falco::false:private,/var/data/kubelet/pods/cae458b5-8f6e-4dac-8a44-cfbddbeb8a61/volumes/kubernetes.io~secret/falco-token-v9x4v:/var/run/secrets/kubernetes.io/serviceaccount::false:private,/var/data/kubelet/pods/cae458b5-8f6e-4dac-8a44-cfbddbeb8a61/etc-hosts:/etc/hosts::true:private,/var/data/kubelet/pods/cae458b5-8f6e-4dac-8a44-cfbddbeb8a61/containers/falco/0ae053db:/dev/termination-log::true:private) k8s.ns=default k8s.pod=falco-pwc5l container=1dab04047700
$ k get pod
NAME          READY   STATUS    RESTARTS   AGE
falco-5lqs4   1/1     Running   0          23m
falco-lm2x2   1/1     Running   0          23m
falco-pwc5l   1/1     Running   0          23m
$ k exec -it falco-pwc5l /bin/bash
root@falco-pwc5l:/# echo "I'm in!"
I'm in!
root@falco-pwc5l:/# cat /etc/shadow > /dev/null
root@falco-pwc5l:/#
In the first terminal you can see the events:
20:07:06.837415779: Notice A shell was spawned in a container with an attached terminal (user=root k8s.ns=default k8s.pod=falco-pwc5l container=1dab04047700 shell=bash parent=runc cmdline=bash terminal=34816 container_id=1dab04047700 image=docker.io/falcosecurity/falco) k8s.ns=default k8s.pod=falco-pwc5l container=1dab04047700
20:07:33.395518344: Warning Sensitive file opened for reading by non-trusted program (user=root program=cat command=cat /etc/shadow file=/etc/shadow parent=bash gparent=<NA> ggparent=<NA> gggparent=<NA> container_id=1dab04047700 image=docker.io/falcosecurity/falco) k8s.ns=default k8s.pod=falco-pwc5l container=1dab04047700 k8s.ns=default k8s.pod=falco-pwc5l container=1dab04047700
You can see interesting details about the security event in the logs. However, there is a more structured way to get the logs out. Let's explore that now.
Modify the helm chart to make Falco output logs in json mode
vim values.yaml
Change jsonOutput: false to jsonOutput: true on line 108.
Use helm to pick up changes
$ helm list
NAME    NAMESPACE       REVISION        UPDATED                                 STATUS          CHART           APP VERSION
falco   default         1               2020-05-26 19:42:59.122742141 +0000 UTC deployed        falco-1.1.8     0.23.0
$ helm upgrade falco .
Release "falco" has been upgraded. Happy Helming!
NAME: falco
LAST DEPLOYED: Tue May 26 20:18:31 2020
NAMESPACE: default
STATUS: deployed
REVISION: 2
TEST SUITE: None
NOTES:
Falco agents are spinning up on each node in your cluster. After a few
seconds, they are going to start monitoring your containers looking for
security issues.

No further action should be required.
If you're fast, you'll be able to see the pods restarting:
k get pod
NAME          READY   STATUS        RESTARTS   AGE
falco-bs6rw   1/1     Running       0          6s
falco-lm2x2   0/1     Terminating   0          35m
falco-pwc5l   1/1     Running       0          35m
After, you can repeat the earlier procedure to generate a security event. You'll de a result like this, in json.
{"output":"20:20:00.598526480: Notice A shell was spawned in a container with an attached terminal (user=root k8s.ns=default k8s.pod=falco-5tjrp container=fc8aefdf0c4e shell=bash parent=runc cmdline=bash terminal=34816 container_id=fc8aefdf0c4e image=docker.io/falcosecurity/falco) k8s.ns=default k8s.pod=falco-5tjrp container=fc8aefdf0c4e","priority":"Notice","rule":"Terminal shell in container","time":"2020-05-26T20:20:00.598526480Z", "output_fields": {"container.id":"fc8aefdf0c4e","container.image.repository":"docker.io/falcosecurity/falco","evt.time":1590524400598526480,"k8s.ns.name":"default","k8s.pod.name":"falco-5tjrp","proc.cmdline":"bash","proc.name":"bash","proc.pname":"runc","proc.tty":34816,"user.name":"root"}}
When you process the event with jq, Falco gives useful information about the security event and the full Kubernetes context for the event, such as pod name and namespace:
$ echo '{"output":"20:20:00.598526480: Notice A shell was spawned in a container with an attached terminal (user=root k8s.ns=default k8s.pod=falco-5tjrp container=fc8aefdf0c4e shell=bash parent=runc cmdline=bash terminal=34816 container_id=fc8aefdf0c4e image=docker.io/falcosecurity/falco) k8s.ns=default k8s.pod=falco-5tjrp container=fc8aefdf0c4e","priority":"Notice","rule":"Terminal shell in container","time":"2020-05-26T20:20:00.598526480Z", "output_fields": {"container.id":"fc8aefdf0c4e","container.image.repository":"docker.io/falcosecurity/falco","evt.time":1590524400598526480,"k8s.ns.name":"default","k8s.pod.name":"falco-5tjrp","proc.cmdline":"bash","proc.name":"bash","proc.pname":"runc","proc.tty":34816,"user.name":"root"}}' | jq '.'
{
  "output": "20:20:00.598526480: Notice A shell was spawned in a container with an attached terminal (user=root k8s.ns=default k8s.pod=falco-5tjrp container=fc8aefdf0c4e shell=bash parent=runc cmdline=bash terminal=34816 container_id=fc8aefdf0c4e image=docker.io/falcosecurity/falco) k8s.ns=default k8s.pod=falco-5tjrp container=fc8aefdf0c4e",
  "priority": "Notice",
  "rule": "Terminal shell in container",
  "time": "2020-05-26T20:20:00.598526480Z",
  "output_fields": {
    "container.id": "fc8aefdf0c4e",
    "container.image.repository": "docker.io/falcosecurity/falco",
    "evt.time": 1590524400598526500,
    "k8s.ns.name": "default",
    "k8s.pod.name": "falco-5tjrp",
    "proc.cmdline": "bash",
    "proc.name": "bash",
    "proc.pname": "runc",
    "proc.tty": 34816,
    "user.name": "root"
  }
}
Now you can trigger the Netcat rule you displayed earlier:
root@falco-daemonset-99p8j:/# nc -l 4444
^C
kubectl logs falco-daemonset-99p8j
...

{"output":"20:28:20.374390553: Notice Network tool launched in container (user=root command=nc -l 4444 parent_process=bash container_id=fc8aefdf0c4e container_name=falco image=docker.io/falcosecurity/falco:0.23.0) k8s.ns=default k8s.pod=falco-5tjrp container=fc8aefdf0c4e k8s.ns=default k8s.pod=falco-5tjrp container=fc8aefdf0c4e","priority":"Notice","rule":"Launch Suspicious Network Tool in Container","time":"2020-05-26T20:28:20.374390553Z", "output_fields": {"container.id":"fc8aefdf0c4e","container.image.repository":"docker.io/falcosecurity/falco","container.image.tag":"0.23.0","container.name":"falco","evt.time":1590524900374390553,"k8s.ns.name":"default","k8s.pod.name":"falco-5tjrp","proc.cmdline":"nc -l 4444","proc.pname":"bash","user.name":"root"}}
...

$ echo '{"output":"20:28:20.374390553: Notice Network tool launched in container (user=root command=nc -l 4444 parent_process=bash container_id=fc8aefdf0c4e container_name=falco image=docker.io/falcosecurity/falco:0.23.0) k8s.ns=default k8s.pod=falco-5tjrp container=fc8aefdf0c4e k8s.ns=default k8s.pod=falco-5tjrp container=fc8aefdf0c4e","priority":"Notice","rule":"Launch Suspicious Network Tool in Container","time":"2020-05-26T20:28:20.374390553Z", "output_fields": {"container.id":"fc8aefdf0c4e","container.image.repository":"docker.io/falcosecurity/falco","container.image.tag":"0.23.0","container.name":"falco","evt.time":1590524900374390553,"k8s.ns.name":"default","k8s.pod.name":"falco-5tjrp","proc.cmdline":"nc -l 4444","proc.pname":"bash","user.name":"root"}}' | jq '.'
{
  "output": "20:28:20.374390553: Notice Network tool launched in container (user=root command=nc -l 4444 parent_process=bash container_id=fc8aefdf0c4e container_name=falco image=docker.io/falcosecurity/falco:0.23.0) k8s.ns=default k8s.pod=falco-5tjrp container=fc8aefdf0c4e k8s.ns=default k8s.pod=falco-5tjrp container=fc8aefdf0c4e",
  "priority": "Notice",
  "rule": "Launch Suspicious Network Tool in Container",
  "time": "2020-05-26T20:28:20.374390553Z",
  "output_fields": {
    "container.id": "fc8aefdf0c4e",
    "container.image.repository": "docker.io/falcosecurity/falco",
    "container.image.tag": "0.23.0",
    "container.name": "falco",
    "evt.time": 1590524900374390500,
    "k8s.ns.name": "default",
    "k8s.pod.name": "falco-5tjrp",
    "proc.cmdline": "nc -l 4444",
    "proc.pname": "bash",
    "user.name": "root"
  }
}
You saw what kind of events Falco can discover and a bit of how to configure them.
The Falco Sidekick is a alert processing and forwarding utility for Falco.
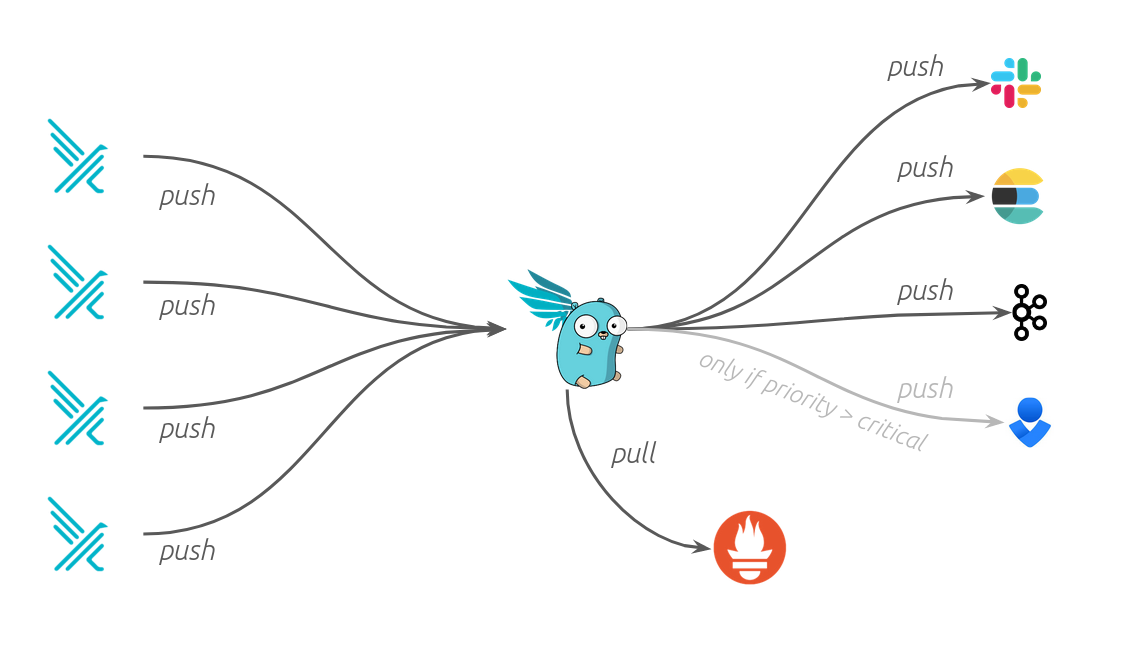
Falcosidekick is a simple golang http daemon. Any number of falco daemons (remember, it's one per kubernetes host) can forward events to the sidekick. The sidekick then forwards the events to it's configured outputs.
Currently available outputs are :
- Slack
- Rocketchat
- Mattermost
- Teams
- Datadog
- Discord
- AlertManager
- Elasticsearch
- Loki
- NATS
- Influxdb
- AWS Lambda
- AWS SQS
- SMTP (email)
- Opsgenie
- StatsD (for monitoring of
falcosidekick) - DogStatsD (for monitoring of
falcosidekick) - Webhook
- Azure Event Hubs
Note: POST ing to http://localhost:2801/test (the sidekick listen address and port, with an empty payload and url string) will generate a test message, very useful for developing plugins or debugging configuration.
To set up the sidekick, we'll do the following:
- Set up a discord webhook
- Configure
values.yamlinside the sidekick helm chart (stored in the same repo as the falco chart) - Deploy the sidekick with helm
- Test the sidekick
- Re-configure falco to forward events to the sidekick
Discord is a chat application similar to slack that is popular with gamers. A sample test discord server has been set up for you to test falco chat alerts with. If you'd like to use slack or one of the other outputs for the sidekick, that's fine. Follow the docs at the sidekick github.
Join the discord server with this discord invite. This discord webhook will be used later when configuring the webhook.
$ cd ~/charts/falcosidekick/
$ head values.yaml
# Default values for falcosidekick.
# This is a YAML-formatted file.
# Declare variables to be passed into your templates.

replicaCount: 1

image:
  repository: falcosecurity/falcosidekick
  tag: 2.13.0
  pullPolicy: IfNotPresent
Open the values.yaml file and configure the following discord configuration:
Set tag to latest.
Set debug to true.
Set customfields to participantCodename:<make something up>
Example:
config:

  debug: true
  ##
  ## a list of comma separated custom fields to add to falco events, syntax is "key:value,key:value"
  customfields: "participantCodename:yeetalizer"
This will help you tell which alerts are yours in the server, since everyone is using the same webhook
Set the discord configuration (near the bottom of the file):
  discord:
    webhookurl: "https://discord.gg/URL_PROVIDED_BY_INSTRUCTOR"
    icon: ""
    minimumpriority: ""
No other changes are required.
mytestmytest@cloudshell:~/charts/falcosidekick$ helm install falcosidekick .
NAME: falcosidekick
LAST DEPLOYED: Sat Sep 26 00:54:23 2020
NAMESPACE: default
STATUS: deployed
REVISION: 1
NOTES:
1. Get the application URL by running these commands:
  export POD_NAME=$(kubectl get pods --namespace default -l "app.kubernetes.io/name=falcosidekick,app.kubernetes.io/instance=falcosidekick" -o jsonpath="{.items[0].metadata.name}")
  kubectl port-forward $POD_NAME 2801:2801
  echo "Visit http://127.0.0.1:2801 to use your application"
mytestmytest@cloudshell:~/charts/falcosidekick$ k get pod
NAME                            READY   STATUS    RESTARTS   AGE
falco-9vmz4                     1/1     Running   0          19m
falcosidekick-6d58575cd-q5mbj   0/1     Running   0          5s
mytestmytest@cloudshell:~/charts/falcosidekick$ helm list
NAME            NAMESPACE       REVISION        UPDATED                                 STATUS          CHART                   APP VERSION
falco           default         1               2020-09-26 00:34:51.827988144 +0000 UTC deployed        falco-1.4.0             0.25.0
falcosidekick   default         1               2020-09-26 00:54:23.685505563 +0000 UTC deployed        falcosidekick-0.1.25    2.14.0
mytestmytest@cloudshell:~/charts/falcosidekick$ k get pod
NAME                            READY   STATUS    RESTARTS   AGE
falco-9vmz4                     1/1     Running   0          19m
falcosidekick-6d58575cd-q5mbj   1/1     Running   0          14s
To debug/test, set up a port forward to the falcosidekick daemon.
export POD_NAME=$(kubectl get pods --namespace default -l "app.kubernetes.io/name=falcosidekick,app.kubernetes.io/instance=falcosidekick" -o jsonpath="{.items[0].metadata.name}")

mytestmytest@cloudshell:~/charts/falcosidekick$ echo $POD_NAME
falcosidekick-6d58575cd-bl8f4
mytestmytest@cloudshell:~/charts/falcosidekick$ kubectl port-forward $POD_NAME 2801:2801 &
[1] 5683
The & at the end of the last command is important, it will send the port-forward to the background.
With that setup you can do a test payload to the sidekick:
$ curl -X POST localhost:2801/test
Handling connection for 2801
If everything went well, you should see an alert in the discord!

Now that we have the sidekick installed and running, we need to tell falco to send alerts to the sidekick. We do this by modifying the helm chart/values.yaml again.
cd ~/charts/falco
First, verify that the sidekick is deployed with the name falcosidekick in kubernetes. This means we can use DNS auto-discovery. Techncially, this means that the sidekick is deployed behind a kubernetes service named falcosidekick.
$ kubectl get svc
NAME            TYPE        CLUSTER-IP     EXTERNAL-IP   PORT(S)    AGE
falcosidekick   ClusterIP   172.21.4.145   <none>        2801/TCP   48m
kubernetes      ClusterIP   172.21.0.1     <none>        443/TCP    33h
Now make some changes to the values.yaml
jsonOutput: true
jsonIncludeOutputProperty: true

...

  httpOutput:
    enabled: true
    url: http://falcosidekick:2801
mytestmytest@cloudshell:~/charts/falco$ helm upgrade falco .
Release "falco" has been upgraded. Happy Helming!
NAME: falco
LAST DEPLOYED: Sat Sep 26 03:15:34 2020
NAMESPACE: default
STATUS: deployed
REVISION: 2
TEST SUITE: None
NOTES:
Falco agents are spinning up on each node in your cluster. After a few
seconds, they are going to start monitoring your containers looking for
security issues.

No further action should be required.
Validate:
mytestmytest@cloudshell:~/charts/falco$ k get pod
NAME                             READY   STATUS    RESTARTS   AGE
falco-hgl4s                      1/1     Running   0          2m1s
falcosidekick-696b7b5bbc-4nnxw   1/1     Running   0          4m18s

# synthetic security event
mytestmytest@cloudshell:~/charts/falco$ k exec -it falco-hgl4s /bin/bash
root@falco-hgl4s:/# exit
exit
With any luck you should be seeing real event alerts in your discord.

The core utility of Falco is crafting a set of rules general enough to identify malicious behavior but specific enough to not alert on everyday activies and leave you sitting in a pile of alerts.
Falco rules are specified in a YAML dialect and are decently expressive.
A simple rule:
- rule: Delete or rename shell history
  desc: Detect shell history deletion
  condition: >
    open_write and evt.arg.name contains "bash_history"
  output: >
    Shell history had been deleted or renamed (user=%user.name type=%evt.type command=%proc.cmdline fd.name=%fd.name name=%evt.arg.na
me path=%evt.arg.path oldpath=%evt.arg.oldpath %container.info)
  priority:
    WARNING
  tags: [process, example]
Now that you've seen a number of Falco events, the rules that specify them should look somewhat familiar. This page is a reference for rules syntax. Rules authors define a number of metadata fields, a conditon, and a string formatted output. In more advanced configurations it's expected you'll be using JSON, but it's also encouraget to pass the "pretty string" along in the json payload so it can be used in human-readable contexts further down the alert pipeline.
Read (or skim) this documentation which lists what fields you have access to when writing conditions.
Operations: The language supports a number of useful operators, all inherited from the Sysdig filter syntax. An incomplete list is below:
| feature | syntax | example |
|---|---|---|
| equals | = | evt.type=open |
| not equals | != | proc.name!="" |
| and | and | evt.is_open_write=true and fd.typechar='f' |
| or | or | |
| less than | =< | |
| grt than | => | |
| list | (a, b) | |
| contains | in | fd.directory in (/bin, /sbin, /usr/bin, /usr/sbin) |
| starts with | startswith | fd.name startswith /etc |
| parens | () | evt.type in (accept,listen) |
Macros:
Macros are supported and several are included by default to ease rule writing. This list contains the default macros, and is a great resource for rule writing examples.
Now we can look at something more complicated:
The shell history rule from the default rules:
- rule: Delete or rename shell history
  desc: Detect shell history deletion
  condition: >
    (modify and (
      evt.arg.name contains "bash_history" or
      evt.arg.name contains "zsh_history" or
      evt.arg.name contains "fish_read_history" or
      evt.arg.name endswith "fish_history" or
      evt.arg.oldpath contains "bash_history" or
      evt.arg.oldpath contains "zsh_history" or
      evt.arg.oldpath contains "fish_read_history" or
      evt.arg.oldpath endswith "fish_history" or
      evt.arg.path contains "bash_history" or
      evt.arg.path contains "zsh_history" or
      evt.arg.path contains "fish_read_history" or
      evt.arg.path endswith "fish_history")) or
    (open_write and (
      fd.name contains "bash_history" or
      fd.name contains "zsh_history" or
      fd.name contains "fish_read_history" or
      fd.name endswith "fish_history") and evt.arg.flags contains "O_TRUNC")
  output: >
    Shell history had been deleted or renamed (user=%user.name type=%evt.type command=%proc.cmdline fd.name=%fd.name name=%evt.arg.na
me path=%evt.arg.path oldpath=%evt.arg.oldpath %container.info)
  priority:
    WARNING
  tags: [process, mitre_defense_evasion]
You may have noticed a number of alerts unrelated to any security incidents. These are incorrect alerts that are identified in our rules but not whitelisted.
If you need some errors try something like this:
kubectl create deployment guestbook --image=quay.io/nibalizer/utilities
Note: If you're just trying to create a ton of errors, falco has a synthetic error creator. Github is here.
03:30:10.941260660: Notice Setuid or setgid bit is set via chmod (fd=<NA> filename=/var/data/cripersistentstorage/io.containerd.snapshotter.v1.overlayfs/snapshots/184/fs/usr/lib/openssh/ssh-keysign mode=S_IXOTH|S_IROTH|S_IXGRP|S_IRGRP|S_IXUSR|S_IWUSR|S_IRUSR|S_ISUID user=root process=containerd command=containerd container_id=host container_name=host image=<NA>:<NA>) k8s.ns=<NA> k8s.pod=<NA> container=host k8s.ns=<NA> k8s.pod=<NA> container=host
This alert is because containerd, as part of the platform, is doing it's job to create and manage files.
The following code can whitelist the alert. Add it to ~/charts/falco/rules/falco_rules.yaml. This is a git-diff output to show clearly (hopefully) where the code needs to go.
diff --git a/falco/rules/falco_rules.yaml b/falco/rules/falco_rules.yaml
index 2fef4ea..3f262d9 100644
--- a/falco/rules/falco_rules.yaml
+++ b/falco/rules/falco_rules.yaml
@@ -863,6 +863,12 @@
 - macro: ipsec_writing_conf
   condition: (proc.name=start-ipsec.sh and fd.directory=/etc/ipsec)

+- macro: containerd_manage_files
+  condition: >
+    proc.name = "containerd"
+    and proc.cmdline contains "/var/data/cripersistentstorage"
+    and user.name = "root"
+
 - macro: exe_running_docker_save
   condition: >
     proc.name = "exe"
@@ -2628,6 +2634,7 @@
     consider_all_chmods and chmod and (evt.arg.mode contains "S_ISUID" or evt.arg.mode contains "S_ISGID")
     and not proc.name in (user_known_chmod_applications)
     and not exe_running_docker_save
+    and not containerd_manage_files
     and not user_known_set_setuid_or_setgid_bit_conditions
   output: >
     Setuid or setgid bit is set via chmod (fd=%evt.arg.fd filename=%evt.arg.filename mode=%evt.arg.mode user=%user.name process=%proc.name
Apply the updated rules by just applying the helm chart.
$ helm upgrade falco .
Release "falco" has been upgraded. Happy Helming!
NAME: falco
LAST DEPLOYED: Sat Sep 26 04:13:22 2020
NAMESPACE: default
STATUS: deployed
REVISION: 3
TEST SUITE: None
NOTES:
Falco agents are spinning up on each node in your cluster. After a few
seconds, they are going to start monitoring your containers looking for
security issues.

No further action should be required.
Congratulations! You've reached the end of the primary workshop. There are two more exercises but both are optional. We hope you got a good view of Falco and the IBM Cloud!
A cloud native application based on microservices contains many parts that create logs. A logging service that is able to collect all distributed logs in one place is a highly recommended tool. There are many logging solutions that you can install directly into your Kubernetes or OpenShift cluster. But then you have an additional application that needs to be maintained and one that needs persistent storage as well to store logs for a period of time. Additionally, log aggregation is a core component of any security team's responsibility.
IBM Cloud offers "Logging as a Service" in the form of IBM Log Analysis with LogDNA. It offers features to filter, search, and tail log data, define alerts, and design custom views to monitor application and system logs. You can test "IBM Log Analysis with LogDNA" for free with somewhat limited capabilities and we will show you in this lab how to connect your OpenShift cluster to an instance of it.
Official documentation for setting up the LogDNA agent for an OpenShift cluster is here.
In the IBM Cloud Platform, logs are aggregated using LogDNA. LogDNA has native support for injesting logs from kubernetes so it is easy to connect LogDNA and your hosted Kubernetes cluster.
However, because your kubernetes cluster is in an IBM service account and that is a separate account from your free trial account, connecting them requires a few extra steps.
| service | your account | ibm tutorial account |
|---|---|---|
| Log DNA | x | |
| Managed Kubernetes | x | |
| Serverless functions | x | |
| Cloud Shell | x |
To get started, open a new tab to cloud.ibm.com and switch to your account, not the "1840867-IBM" account. Keep your cloud-shell tab open, and in the tutorial account, we'll use it soon.
For the following instructions use the IBM Cloud Shell to enter the commands.
-
In your browser log in to the IBM Cloud dashboard
-
Make sure you are using your own account.
-
From the "burger menu" select "Observability"

-
-
Create an "IBM Log Analysis with LogDNA" instance
-
Do not create an "Activity Tracker with LogDNA" Service.
-
Select "Logging" on the left
-
Click "Create a logging instance"

- Leave the default name or choose your own ("logdna-openshift")
-
-
In the next dialog:
-
Select a region close to your OpenShift cluster
-
Leave the "Lite" pricing plan but take note of the other plans; those are the full featured plans. But you need a paid account to use those. We will use Lite for this lab.
-
Scroll down a bit
-
Leave the service name and the "Default" resource group
-
Click "Create" at the bottom of the dialog.

-
-
Click on "Edit log sources"

-
Select the "Kubernetes" tab. Copy, paste, and execute the commands into your IBM Cloud Shell:

-
Check that the logging agent is running with:
$ kubectl get all -n ibm-observe


Then you can view (and search) logs from falco (and the rest of the cluster) via the webUI.

Congratulations! You've completed extra exercise 1
Falco has a options for configuring gRPC connections by clients. This makes it possible to write custom clients to consume events with any falco client utilities.
Clients exist in go, python, and rust.
There are two ways to connect, one is via a network socket the other is via a unix domain socket. For this example it makes the most sense to use the network socket.
This is a self-directed exercise. If you are able to accomplish it, let the instructor know, and we'll get you some falco swag for your effort.
Steps:
- Generate x509 certs. Use the certificates section here. You'll need a full CA toolchain. Server and client certs (sorry!)
- Configure falco via helm, to use the certs and open up a network socket. relevant values
- Configure "grpcOutput.enabled" to "true". Falco by default wont send events even if grpc network socket is open.
- Configure a
kubectl port-forwardcommand.kubectl port-forward svc/falco 5060might work or is a good start. - Install one of the clients. The go and python are the best supported right now. You can test eaily using the
examples/directory inside both repositories. pip install falcodoes work in the cloud shell, that's where I'd start.
You'll know you've been successfull when you have a running loop of events feeding out your commandline in the cloud shell. Please let your instructor know, we'd love to send you some swag.
Thank you for attending the workshop. The falco community would love for you to join if you are interested. We have slack (#falco on the kubernetes slack), a weekly meeting, and a mailing list.