Skip to content
New issue

Have a question about this project? Sign up for a free GitHub account to open an issue and contact its maintainers and the community.

By clicking “Sign up for GitHub”, you agree to our terms of service and privacy statement. We’ll occasionally send you account related emails.

Already on GitHub? Sign in to your account

Aggregate area:performs the operation only on one field #30

Closed
sourcebits-piyush opened this issue Aug 20, 2013 · 30 comments
Closed

Aggregate area:performs the operation only on one field #30

sourcebits-piyush opened this issue Aug 20, 2013 · 30 comments
Assignees

Comments

@sourcebits-piyush
Copy link

Hi,
actually when i drop the two fields in aggregate area,then it performs the aggregate function only on one field.but i need it to perform that functionality on all the fields that is present in aggregation area.
is there any way to do that.
thanks in advance.

@nicolaskruchten
Copy link
Owner

There isn't right now but that's a good idea!

I assume you mean sum() or average() right?

@ghost ghost assigned nicolaskruchten Aug 21, 2013
@stephanvd
Copy link

If i understand you correctly this is the same functionality i needed for some lightweight BI.

The result looks like this:
screen shot 2013-10-31 at 10 27 49 am
(hours, turnover and profit_margin being the aggregator fields)

I wrote a custom renderer and aggregator to achieve this: https://gist.github.com/stephanvd/7246890

Written in plain javascript as that's what we use. It's quick and dirty but i would be happy to help with a neater Coffeescript version.

Let me know what you think.

@nicolaskruchten
Copy link
Owner

This is really cool, thanks for sharing! I'll take a closer look in the coming days to see how this could be incorporated into the core or if we can add it to this repo as a plugin or something :)

@nicolaskruchten
Copy link
Owner

Closing as duplicate of #73 ... Still working on a way to incorporate this into the library.

@javg151
Copy link

javg151 commented Dec 18, 2013

I have managed to render two or more columns in vals area, based in work of stephanvd

https://github.com/javg151/Projects/tree/master/PivotTable

Congratulation for all your previous work

I keep working in more features, one of them is compare two columns and get the percent of difference

@mopuru-murali
Copy link

Hi nicolaskruchten, Do we have update on this issue?!

@stephanvd, I got following err in multifactTableRenderer when I tried your code.
TypeError: pivotData.getRowKeys is not a function
rowKeys = pivotData.getRowKeys();

@javg151, given URL not working.
Could you plz paste your source code here for reference?

@kumar31rajesh
Copy link

Hi stephanvd,
I have tryed your code but it is not working properly with my code .Can you tell is there any more changes need to do.

@unk1911
Copy link

unk1911 commented Dec 29, 2014

hi @nicolaskruchten,

do you still plan to incorporate the multi-aggregator solution from @stephanvd? it works, i tried it.
the only problem with Stephan's MultifactAggregator is that although the table is rendered correctly, any attempt to use the UI to make alterations to the columns or to perform filtering, it breaks the view. it would be so amazing if the multi-aggregator became a standard part of the library... any chance of that happening?

@nicolaskruchten
Copy link
Owner

@unk1911 I'm not actively working on this, no.

Just to clarify your ask: you want to apply one operation (i.e. sum) to multiple fields? How would you envision this working when the operation actually already operates on multiple fields (i.e. Sum over Sum) ?

@unk1911
Copy link

unk1911 commented Jan 5, 2015

@nicolaskruchten

The Sum over Sum aggregator, though useful, doesn't work for the type of view that I need to present. What I have in the source data is financial data and I want my columns to show the totals summed up by the month of the year and my rows to be any of the other data dimensions. So for instance, using the following input array:

var data = [
["id", "sid", "group_name", "nov", "dec", "tot"],
[0, "cp", "C", "9", "12", "103.0"],
[0, "cp", "I", "1", "1", "12.0"],
[1, "mm", "I", "5", "4", "50.0"],
[1, "mm", "C", "10", "12", "120.0"],
[1, "mm", "C", "3", "4", "30.0"]
];

I would like to display the results so that the "sid" column appears on the y-axis, and the month totals appear on the x-axis. I can achieve this with a customized multi-aggregator. The resultant GUI ends up looking perfect:

sid nov dec tot
cp 10 13 115
mm 18 20 200
TOTALS 28 33 315

I can also easily redefine the code to display "group_name" instead of the "sid" on the y-axis and that works perfectly as well:

$("#output").pivotUI(data, {
rows: ["group_name"],
vals: ["nov","dec","tot"],
$.pivotUtilities.gchart_renderers),
aggregators: custom_aggregators,
renderers: custom_renderers,
hiddenAttributes: ["id","nov","dec","tot","sid"]
});

Output GUI:

group_name nov dec tot
C 22 28 253
I 6 5 62
TOTALS 28 33 315

So as you can see, everything is working perfectly with the custom_aggregator.
The issues I'm encountering is if I try to use any of the GUI features now, for example if filter display group_name="C", it breaks the GUI and I see a blank screen... I also can no longer drag/drop columns, any time I try to perform any of the functions the GUI breaks/shows a blank screen...

@nicolaskruchten
Copy link
Owner

@unk1911 I'm not really that familiar with stephanvd's code, and the core library has evolved a little bit since he wrote it, so I'm afraid I'm not in a good position to help you debug any incompatibility between them.

As to your question about integrating this into the core, given that as it says in the Gist it doesn't have multifield support, I'm afraid I won't be able to.

@unk1911
Copy link

unk1911 commented Jan 8, 2015

@nicolaskruchten
Nicolas,

I figured out the root cause of the problem. It may be a bug the code. If we look at pivot.coffee starting at line #729:

if initialRender
    vals = opts.vals
    i = 0
    @find(".pvtVals select.pvtAttrDropdown").each ->
    $(this).val vals[i]
    i++
    initialRender = false

You are only setting vals=opts.vals if this is the first time the module is invoked. That works fine but if the user then makes a change, perhaps filters on a field, or performs a drag/drop, what happens when the code gets invoked a second time, is the "vals" stays empty, and this is the reason the custom render was being passed an empty pivotData.valAttrs. That would causes the GUI to break/not display any data.

The fix was pretty straight-forward: place "vals=opts.vals" outside the if block:

vals = opts.vals
if initialRender
    i = 0
    @find(".pvtVals select.pvtAttrDropdown").each ->
    $(this).val vals[i]
    i++
    initialRender = false

Once I recompiled the .js with the above change to pivot.coffee, I was able to get the multi-field aggregator functionality working perfectly.

Let me know if you would like me to commit a new version of pivot.coffee, with @stephanvd's multi-field aggregator/renderer built-in. I can also post the test/example that I used, which shows this functionality in action...

Cheers,
-mike

@kumar31rajesh
Copy link

Hi unk1911,
Can you post your sample example for multi-field aggregator.

@unk1911
Copy link

unk1911 commented Jan 23, 2015

Hi @kumar31rajesh,

I have published my modified version of pivottable with the custom multi-field aggregator at:

https://github.com/unk1911/pivottable-multi-field-aggregator/tree/master

It's based on a relatively fresh version of pivottable.
The example file is located in ./examples/mf_agg.html

Note that the changes I made are in pivot.coffee, so it should compile into pivot.js. I was hoping @nicolaskruchten would somehow integrate it with his version some day :)

Note that the custom aggregator is called MFSum and the custom renderer is called MFTable.

Cheers,
-mike

@nicolaskruchten
Copy link
Owner

Hi @unk1911

thanks for your messages and work. I haven't forgotten about this but I haven't been able to look into the bug report you've posted. If/when I can fix the opts.vals thing, your aggregators should be compatible, although I'm hesitant to add the aggregators/renderers themselves to the library as I'm not sure I'm willing to keep maintaining them if the library changes, so perhaps I could list your repo in a page on the wiki of related projects/extensions or something?

@kumar31rajesh
Copy link

Hi @unk1911,

Thanks for giving the updated link .Only one minor issue is coming in case of if we put non numeric field on columns.I am checking the issue .
image

@unk1911
Copy link

unk1911 commented Jan 23, 2015

@nicolaskruchten
Nicolas,

Sounds good about linking. The crux of the update, when it comes to the core pivot.coffee library is essentially just a minor tweak on line #880 which involves setting the "vals=opts.vals" outside of the if initialRender block, as can be seen here:

https://github.com/unk1911/pivottable-multi-field-aggregator/blob/master/pivot.coffee

            vals = opts.vals if opts.aggregatorName? and opts.aggregatorName is "MFSum"
            if initialRender
                i = 0
                @find(".pvtVals select.pvtAttrDropdown").each ->
                    $(this).val vals[i]
                    i++
                initialRender = false

Cheers,
-m

@nicolaskruchten
Copy link
Owner

@unk1911 unfortunately I don't think I can make this change in the core library for a few reasons:

  1. the vals = opts.vals is set within the initialRender block for a reason: we only want to override the user's selection the first time the pivot table is rendered

  2. I don't want to start hardcoding references to specific aggregator names in the core library

Unfortunately, we'll just have to live with your fork...

@zuk38
Copy link

zuk38 commented May 20, 2015

Hello.
I make changes in @unk1911 version (remove problem with col length and colspan in header) and make this fiddle:
https://jsfiddle.net/dL86h8xr/

Cheers

@zek
Copy link

zek commented Jun 3, 2015

@zuk38 I tested your fiddle in my project and it doesnt work well and it's not updated to current pivottable.

2 years passed and still nothing changed about this situation. So sad.

@nicolaskruchten
Copy link
Owner

@drtzack the reason nothing has changed is that this feature request is fundamentally contrary to the architecture of this library. If you need this feature, you need a different library, there's no sense in complaining.

@csbatista
Copy link

Hi! I'm using multiple aggregators based on the codes posted here, but it is only working with pivotUI. What should I do for it to work with pivot?

(I modified the renderer to display each measure in one row, but when I call pivot instead of pivotUI it doesn't build the rows. Any tips on what I might be missing?)

@suchitkumar007
Copy link

@zuk38 in your fiddle if i'll put okres also in the row area the constructed table is disturbed . can you tell the area where i can fix it for any number of rows and column interchange.

@Dams591
Copy link

Dams591 commented Nov 14, 2016

Guys, any idea to add expand/collapse to MFTable renderer ?
Something like http://nagarajanchinnasamy.com/subtotal/examples/ but compatible with MFSum ?

@dharam1291
Copy link

Guys how to apply mfcount and other functionality

@Ryoto1624
Copy link

Hi,

Firstly i would like to thank you all for having customised javascript to have multiple aggregators. i am planning to implement this in outsystems. As i am new to javascript and outsystems any help to integrate it in outsystems will be great help.

Thanks in advance.

Ryoto

@desienjelina
Copy link

Hi,

I am sorry, I am the beginner. How to integrate this pivottable with codeigniter?

@nicolaskruchten
Copy link
Owner

@desienjelina please do not comment on old, closed issues like this.
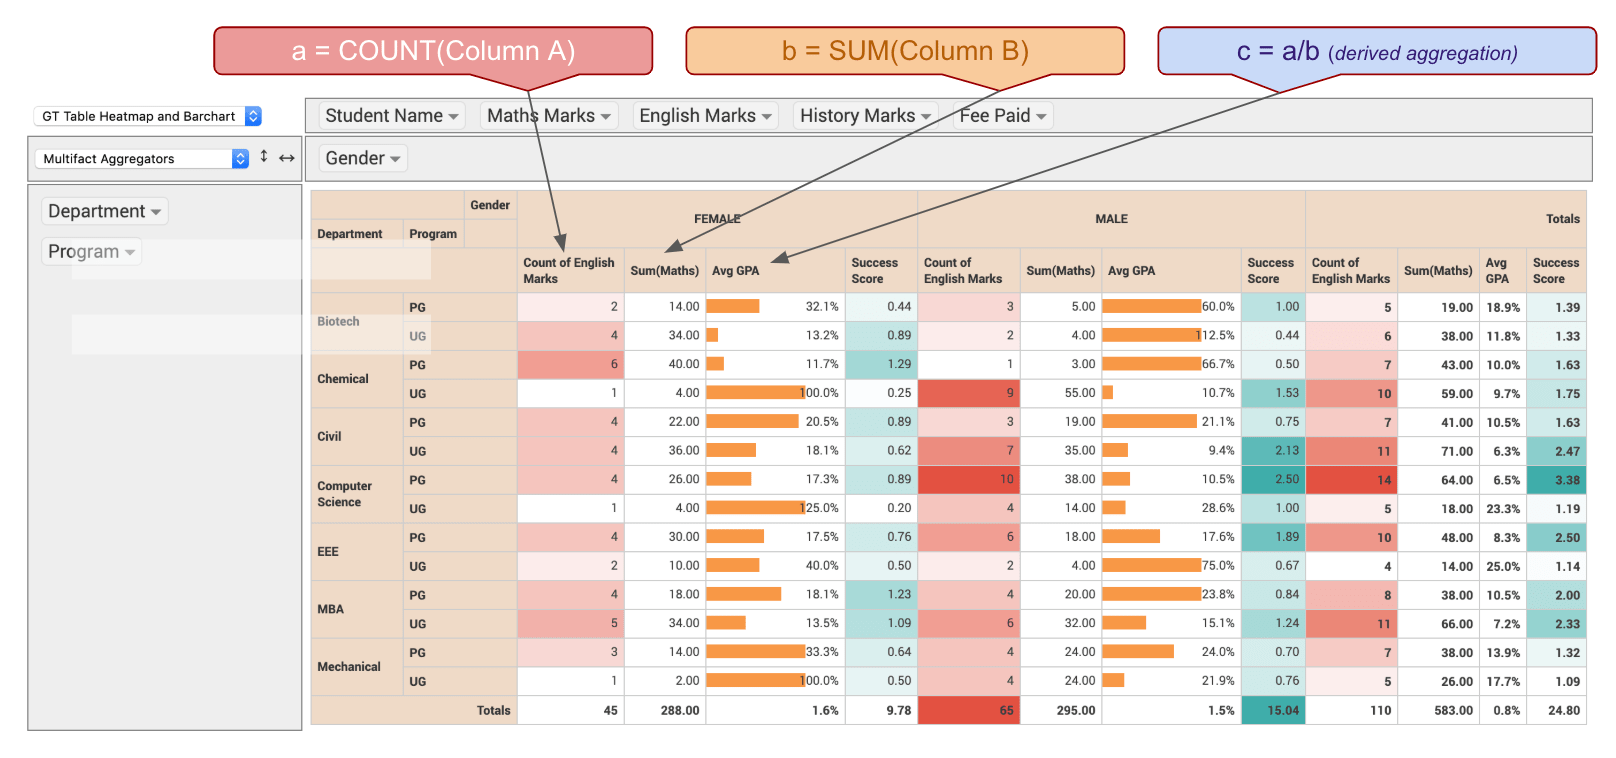
@pranjal-goswami
Copy link

Hi!
I have attempted to write a plugin for adding multiple aggregations on different fields and have published them here: https://github.com/pranjal-goswami/multifact-pivottable

Multifact-pivottable

Using this plugin you can :

  • Add multiple aggregations to the same pivottable: AVG(Column A), SUM(Column B)

  • Add derived aggregations :
    -- a = AVG(Column A)
    -- b = SUM(Column B)
    -- [c = b/a] as 'Success Score'

  • Hide an aggregate (in case you want to use the value in derived aggregate but not show it)

  • Hide an aggregate from row-totals section

  • Enhance rendering of aggregations using heatmap or barchart

  • Custom heatmap colors for each aggregation

A demo is available here: http://pranjalgoswami.in/multifact-pivottable/examples/

Will add detailed documentation if people find the plugin useful.

@jazo2212
Copy link

jazo2212 commented Oct 25, 2023

Hola estimados, es posible que en el comboList o comboBox donde se seleccionan los campos se pueda implementar hacer una selección multiple o selección mas de un registros para cargar la tabla dinámica??
Además, he tratado de personalizar la tabla dinámica incluyéndole un scroll en los registros y fijar el encabezado, pero no he logrado aún.
La tabla dinámica se carga desde un archivo Excel

Este es el código que tengo actualmente.

// pivote.js
// Función para crear Tabla Dinámica que se adapta a diferentes estructuras de datos
function criarTabelaDinamica(data) {
    // Verificar si los datos son un array de objetos
    if (Array.isArray(data) && data.length > 0 && typeof data[0] === 'object') {
        // Supongamos que el objeto data es una lista de objetos donde cada objeto representa una fila del Excel
        // Aquí se extraen las claves de un objeto para usarlas como nombres de columna
        const columnKeys = Object.keys(data[0]);
          // Función para generar colores aleatorios
          function generateRandomColors(count) {
            const colors = [];
              for (let i = 0; i < count; i++) {
                    const color = '#' + Math.floor(Math.random() * 16777215).toString(16);
                    colors.push(color);
             }
                     return colors;
          }
        // Aquí se configuran las opciones para la tabla dinámica
        const pivotOptions = {
            rows: [columnKeys[0]], // Tomamos la primera clave como fila
            cols: [columnKeys[1]], // Tomamos la segunda clave como columna
            aggregatorName: 'Sum',
            vals: [columnKeys[2]], // Tomamos la tercera clave como valor
            renderers: {
                'Table': $.pivotUtilities.renderers['Table'],
                'Table Barchart': $.pivotUtilities.renderers['Table Barchart'],
                'Heatmap': $.pivotUtilities.renderers['Heatmap'],
                'Row Heatmap': $.pivotUtilities.renderers['Row Heatmap'],
                'Col Heatmap': $.pivotUtilities.renderers['Col Heatmap'],
            }
        };
        // Crear la tabla dinámica
        $('#pivotTable').pivotUI(data, pivotOptions);
    } else {
        console.error('Los datos proporcionados no son válidos para crear la tabla dinámica.');
    }
}
// Función para manejar la carga de un archivo Excel
document.getElementById('fileUpload').addEventListener('change', function(event) {
    const file = event.target.files[0];
    if (file) {
        const reader = new FileReader();
        reader.onload = function(e) {
            const data = new Uint8Array(e.target.result);
            const workbook = XLSX.read(data, { type: 'array' });
            const sheetName = workbook.SheetNames[0]; // Suponiendo que los datos están en la primera hoja
            const jsonData = XLSX.utils.sheet_to_json(workbook.Sheets[sheetName]);
            criarTabelaDinamica(jsonData);
        };
        reader.readAsArrayBuffer(file);
    }
});


Esta es la linea que esta en mi tabla.html

<div id="pivotTable" class="pvtTable"> </div>

Tabla Dinamica Java Script

Sign up for free to join this conversation on GitHub. Already have an account? Sign in to comment
Projects
None yet
Development

No branches or pull requests