Wave band spectrum timeline #5
Comments
|
Hi Marcel, I'm still using the little time I have for Wavetuner to improve its infrastructure in order to make it easier for people to start working on it. |
|
Hi Martin, |
wow excellent info here |
|
Hey @IkkAlpha, please don't get your hopes to high... |
When doing neurofeedback at a local ergotherapist, we had configured this screen for training:
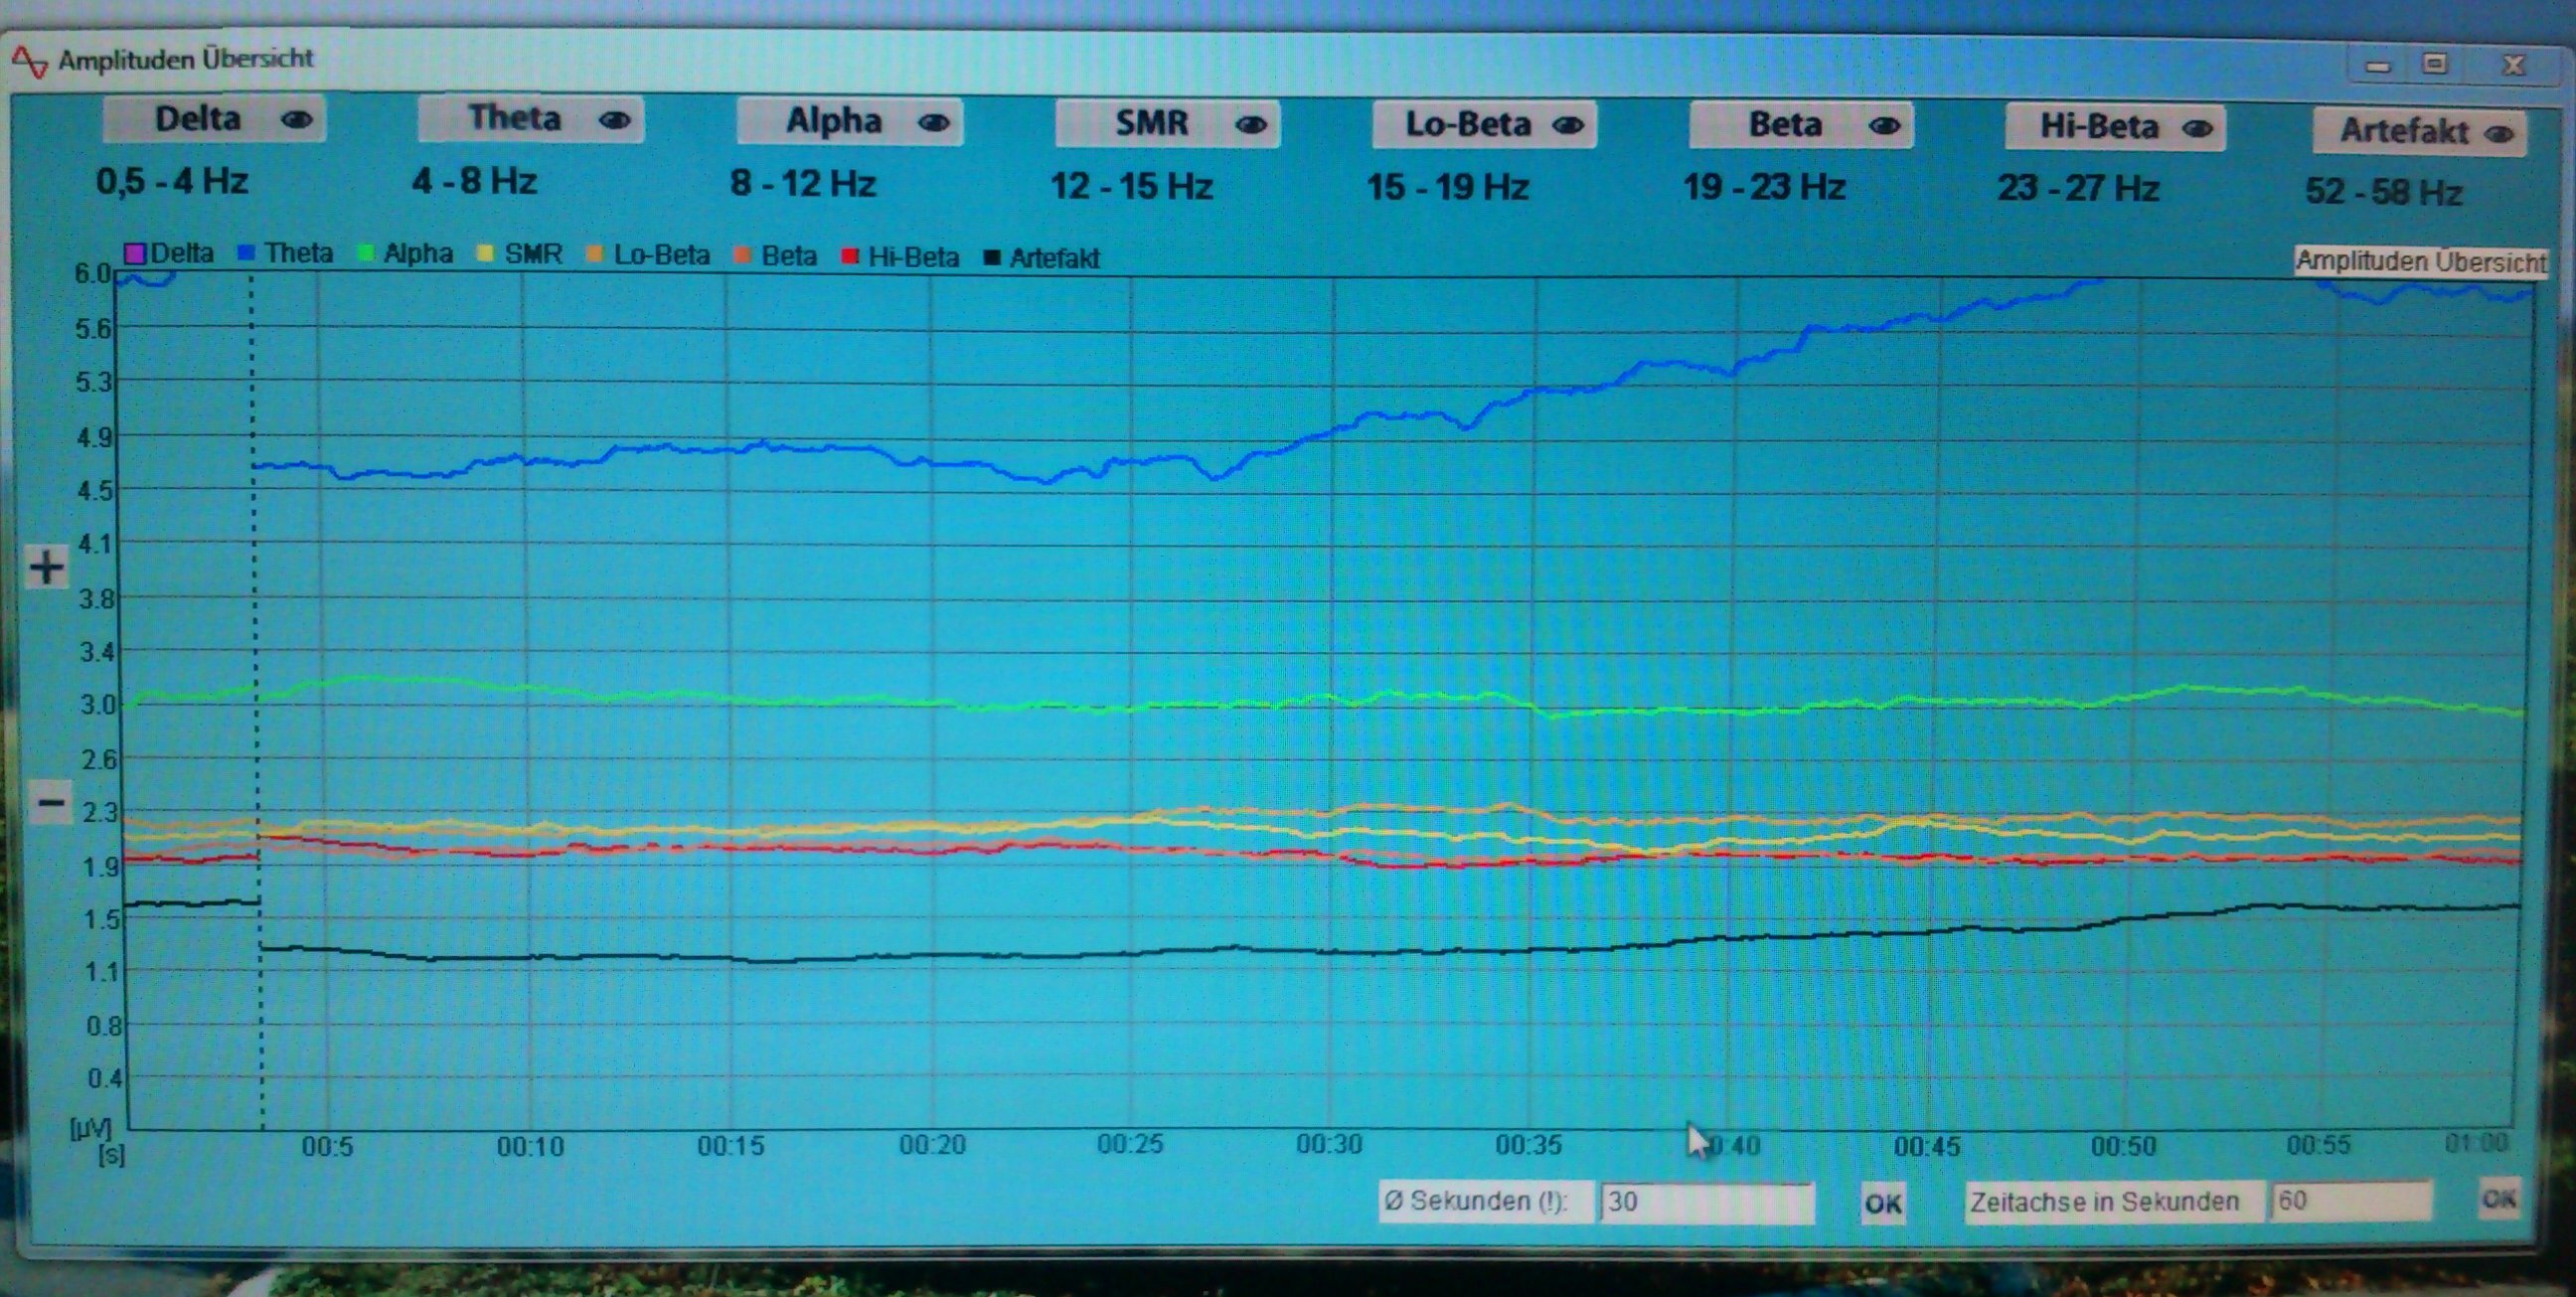
Notable useful features:
Also found some documentation for the µVoltage scale:
Document MindWave™ sensor specs
@neuro
http://support.neurosky.com/kb/technology/eeg-band-frequencies
http://support.neurosky.com/kb/technology/thinkgear-measurements-mindset-protgem
http://support.neurosky.com/kb/technology/how-to-convert-raw-values-to-voltage
Hope to get forward transforming this app into a fully adjustable Neurofeedback app C;
The text was updated successfully, but these errors were encountered: