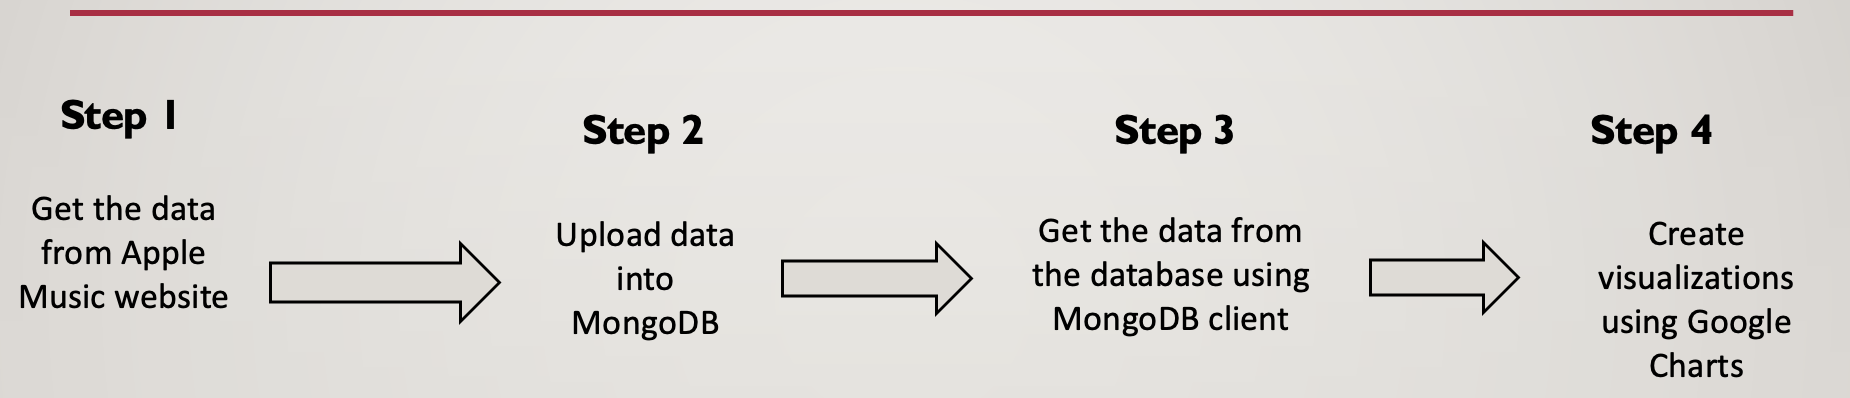
This project demonstrates the use of the Google Chart API which is an interactive web service that creates graphical charts from user-supplied data. Here, we scrape the data from https://music.apple.com/browse/top-charts/songs to get the top trending songs and artists. I have also added a few APIs to fetch the data
Flask – It’s a python web framework built for rapid development.
Mongodb - MongoDB is a source-available cross-platform document-oriented database program. Classified as a NoSQL database program, MongoDB uses JSON-like documents with optional schemas.
Google charts - The Google Chart API is an interactive Web service that creates graphical charts from user-supplied data.
Web template - http://freehtml5.co/
Running the Flask App

Populating MongoDB

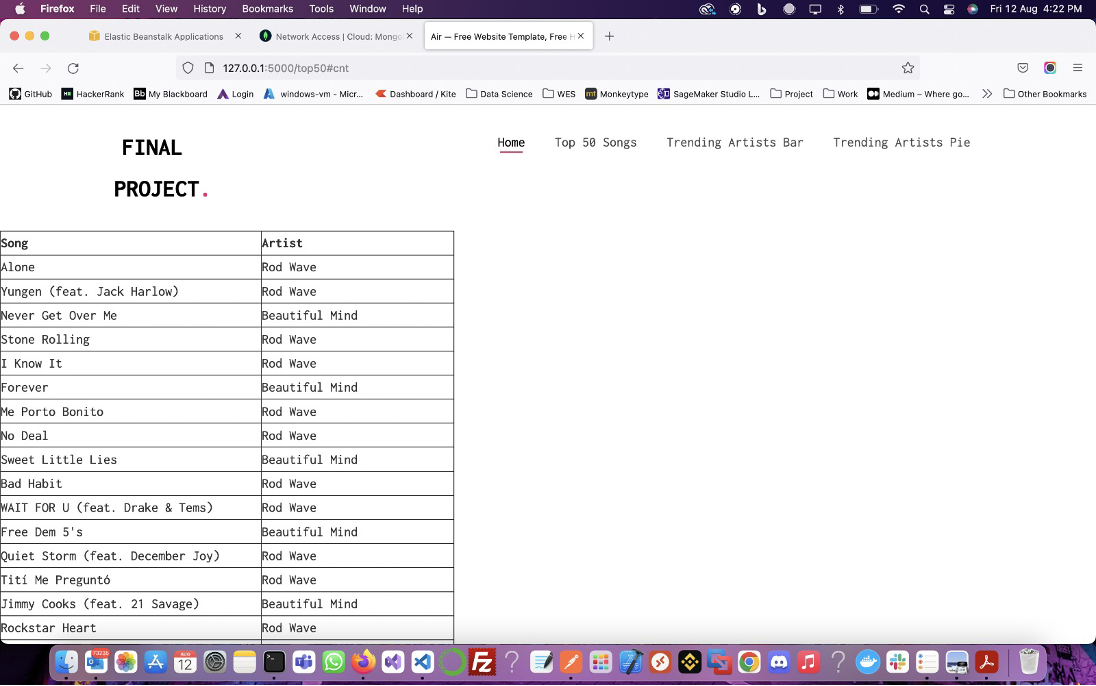
Testing the APIs


Homepage
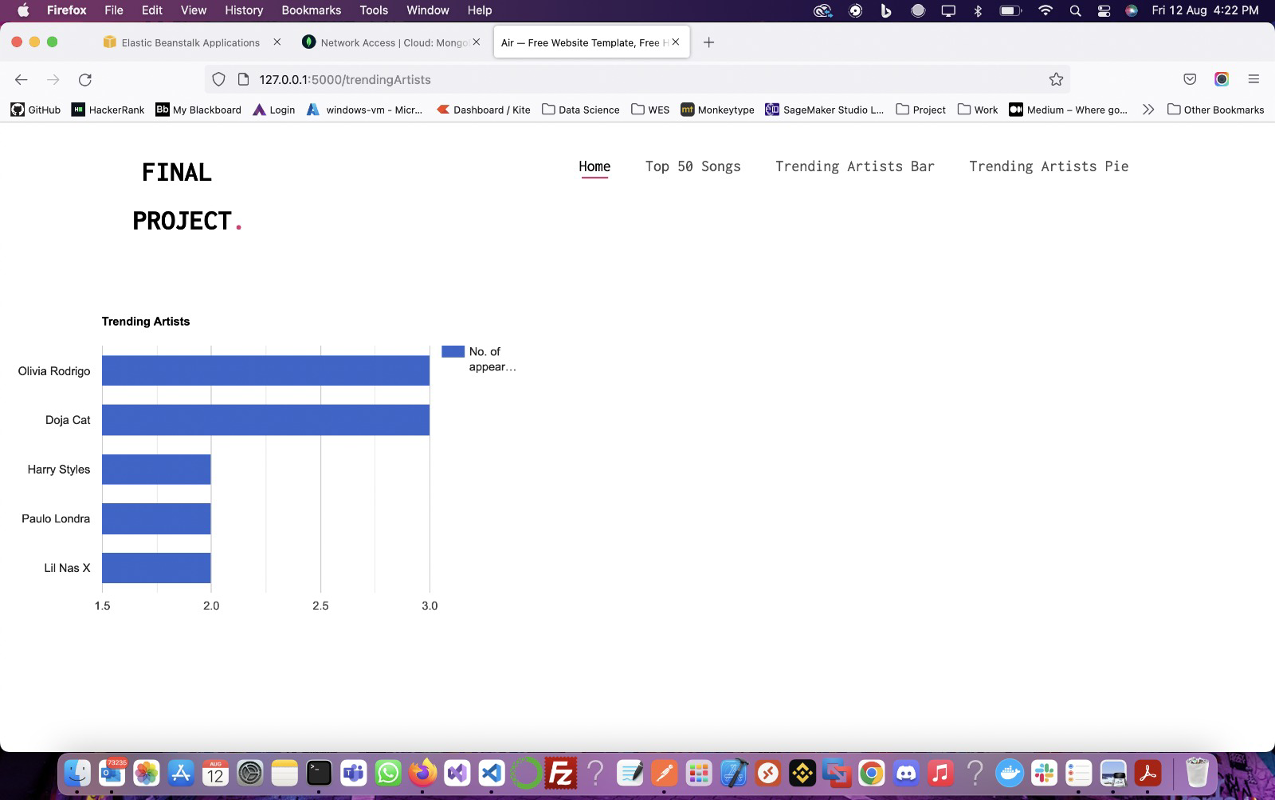
Google Charts
Bar Chart:
Pie Chart:
