对接 prometheus 使用 grafana 出图
bash <(curl -Ls unlock.moe/monitor) -serviceUsage of unlock-monitor:
-listen string
listen address (default ":9101")
-interval int
check interval (s) (default 60)
-service
setup systemd service
-hk
Hong Kong
-jp
Japan
-mul
Multination (default true)
-na
North America
-sa
South America
-tw
Taiwan
-u check update
-v show version
添加 JOB:
- job_name: checkmedia
    scrape_interval: 30s
    static_configs:
      - targets:
        - <your ip/domain>:9101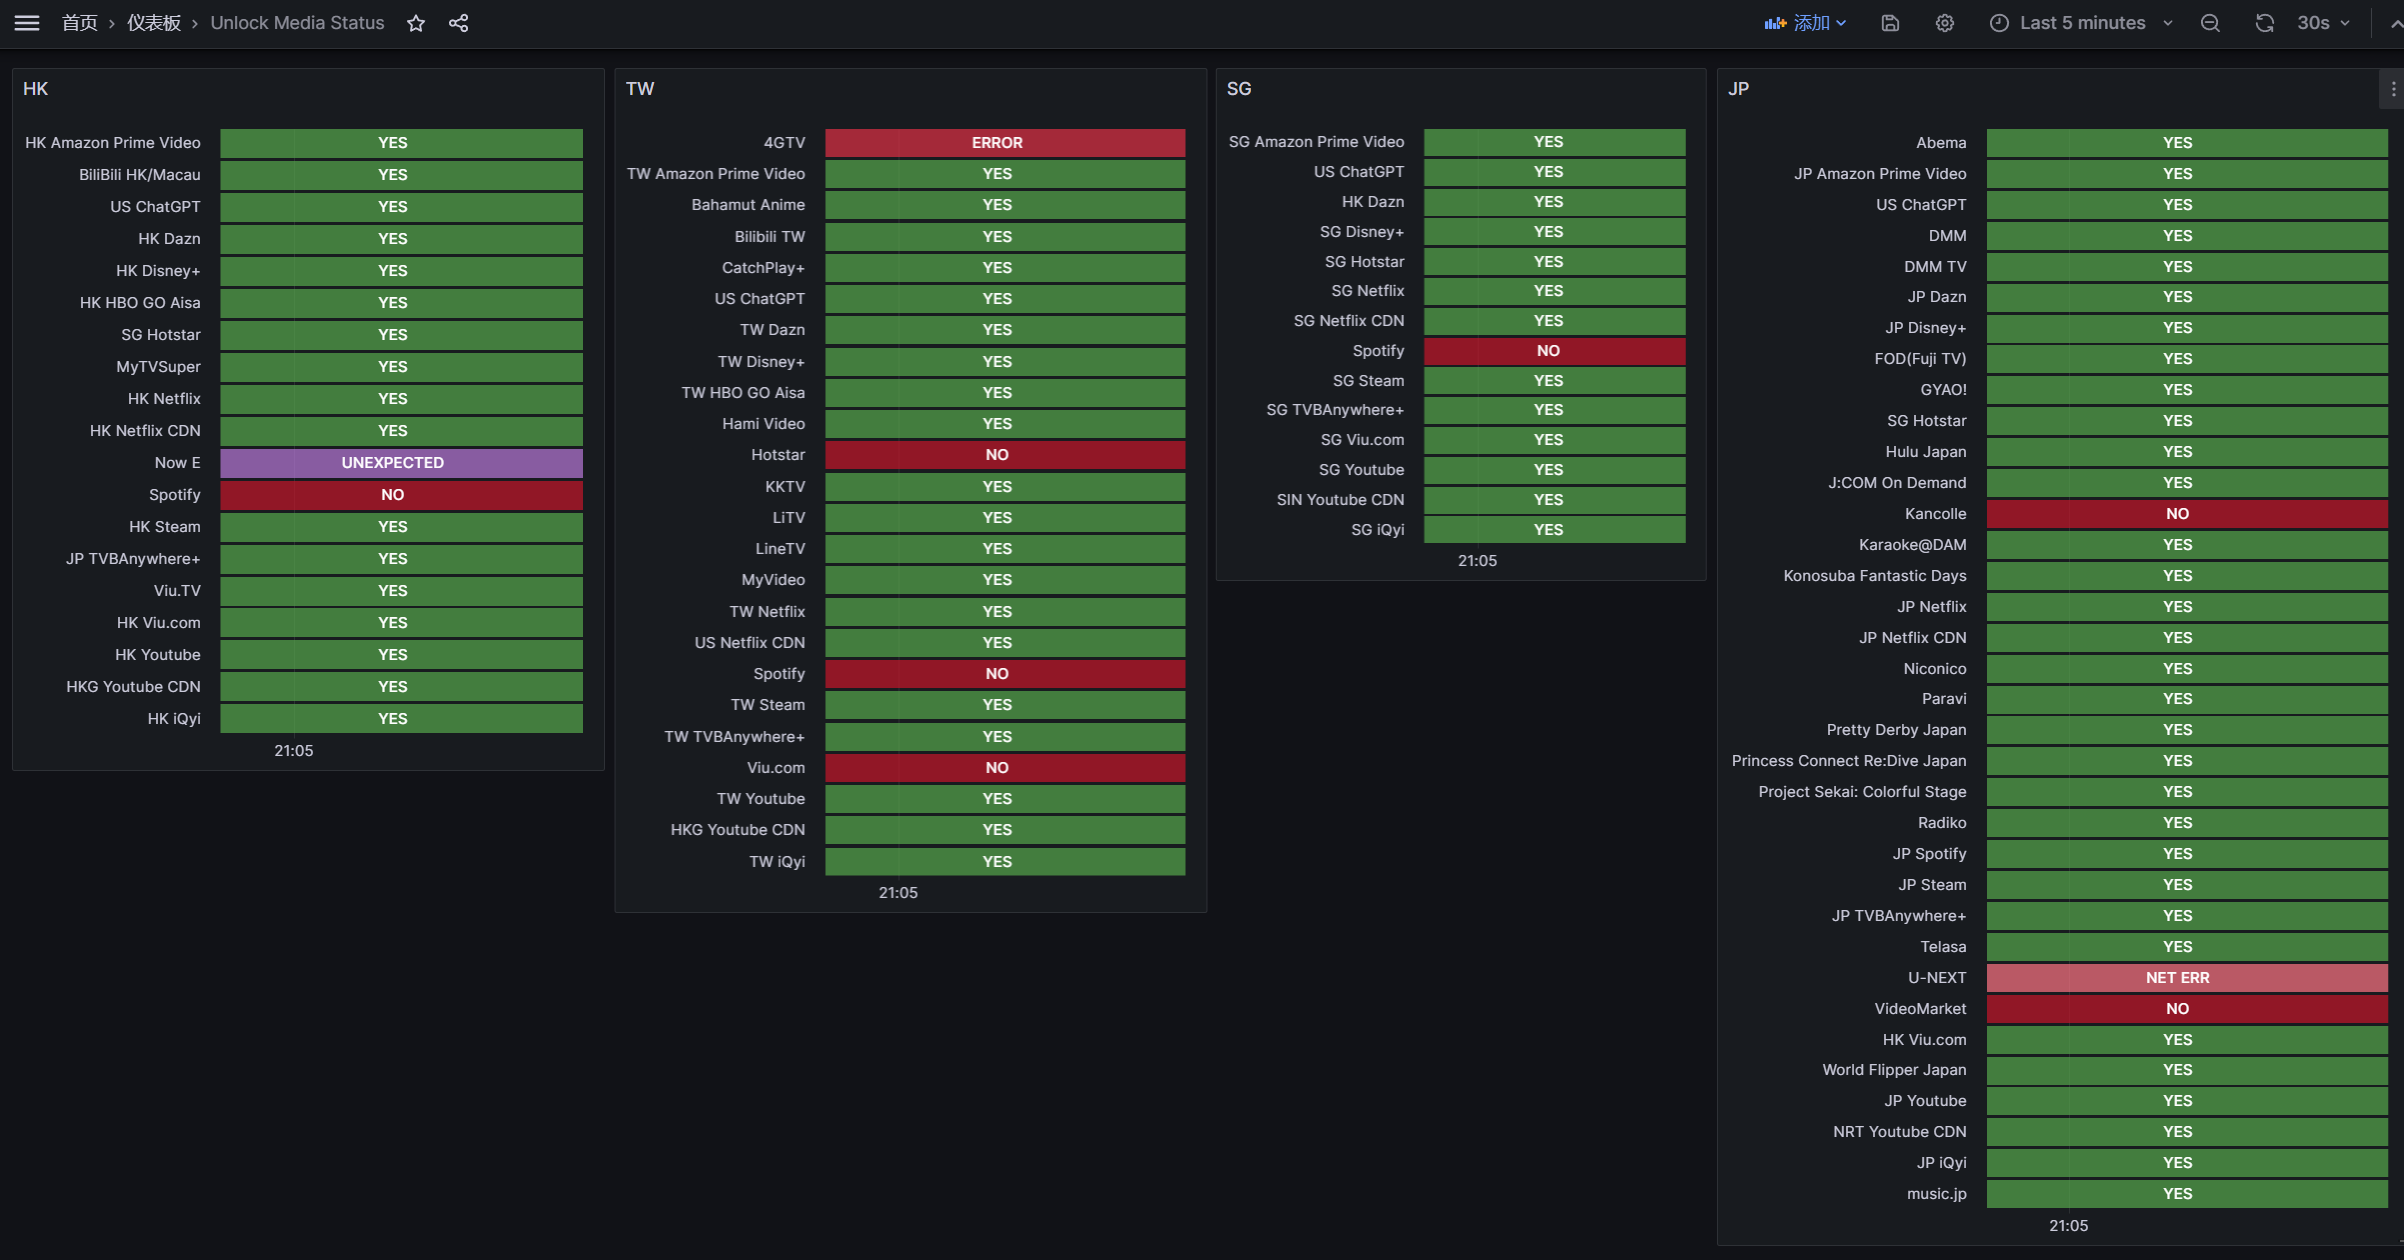
- ...Value mappings
| Status | Display Text |
|---|---|
| 1 | YES |
| 2 | Restricted |
| 3 | NO |
| 4 | BANNED |
| 5 | FAILED |
| 6 | UNEXPECTED |
| -1 | NET ERR |
| -2 | ERROR |