node.warn and node.error functions are printing twice on the debug window (Node-RED v2.2.2) #3514
Comments
|
Your flow works correctly on
|
|
Your flow works correctly on Node-RED version: 2.2.2 Can you replace the content of your function, with this? |
|
It prints the same timestamp... If I try using I've installed node-red with npm and I've recently updated it with the command |

|
The msg seems to be duplicated. |
|
I did it, I even restarted my machine... I actually have node-red installed on different computers with Ubuntu 20.04 and both of them are duplicating these messages. Going a little further, even when I edit the file ...
node.on("input", function(msg, send, done) {
node.warn('message')
...I still get this duplicated message... Even though it doesn't look like it's running the function twice because when I try |
|
@rafaelmuynarsk this doesn't happen for me in V2.2.2 either...
Do you have another node-red 2.2.2 installation to test this against? Have you modified any of the base node-red js files at all? How did you install node-red 2.2.2? |

How did you create the flows on those two machines? Did you recreate the flows from scratch each time? Or did you copy over the flow file or Import/Export from the editor? If you copied the flow file, can you open it up in a text editor, search for the Function nodes and check their |
|
Sorry about the delay, I ended up finding out that it's a problem with a different node that I made: https://www.npmjs.com/package/node-red-contrib-fast-debug-counter So this issue is not a problem with Node-RED. My idea was to use the debug node as basis for creating a node that can count messages arriving in it. But it turned out that just copying the debug node was too much and it did stuff that was not supposed to happen. |
|
I've just fixed it by erasing this part of the code: DebugNode.logHandler = new events.EventEmitter();
DebugNode.logHandler.on("log",function(msg) {
if (msg.level === RED.log.WARN || msg.level === RED.log.ERROR) {
sendDebug(msg);
}
});
RED.log.addHandler(DebugNode.logHandler);I'm not sure if I'll still see different bugs because I'm using a copy of the debug node. But by now everything seems to be working fine. Thanks for the responses. |
|
Just as a curiosity, is there any chance of adding a feature like this in the official Debug node? It'd be only an extra checkbox inside it. From my experience with Node-RED, counting the number of messages that are passing on the flow is also a way of debugging what's happening. Before creating this counter node with the official Debug node my flows used to always have a counter and a debug node connected in the same output. So having both of them in a single node made things more practical for me. |
|
While possibly useful I have not heard of much demand for counting messages as a means of debug. If it were to be implemented it would need a bit more design than just a tickbox. How would it be reset ? for example. Would it just replace the status - or be appended - or is that yet another option, etc... Certainly we can have the discussion |
|
For me, restarting it every time that something changes on the node makes more sense, something like this:
This way the node counts only the messages that arrived since its last deploy. I don't think that it makes sense to use the
Counting messages is useful in different situations for me. We could use it in situations like:
Here we have a flow that's passing 10000 messages in an instant and we have two rows: a. The counter in the first row is a subflow that is updating its status in each message that arrives in it. As we can see, it's slow to update the status of a node at a huge frequency (the same would be true for printing on the debug window). I understand that for some users not printing the status for each message that arrives could generate some confusion if we want to use the |


|
Yes - would definitely need to be implemented like your option b) - we need to be wary of overloading the websocket with too many updates. Especially if you have lots of debug nodes (in this mode). Would you like to propose a Pull Request ? |
|
If you dont mind, I have some suggestions...
Last one (controversial)...
|
|
Hmm
|
|
If this is being added, then adding a simple 'message count' option to the status list is more than sufficient. Resetting the value when the node is restarted is good enough for now. Although I wouldn't lose sleep if it support Adding an output is completely out of scope of this discussion. |
|
Ok - @rafaelmuynarsk - we're happy to consider an update to add count as a status option. Would you be up for creating a Pull Request, with just the minimum functionality as suggested ? |
|
RE:
|
|
Perhaps a better solution altogether would be a separate msg counter node (could also include statistics etc!) This could be used in-line (to avoid cloning of large messages). Leaving the debug to be a debug node? |
|
well there are several counter and speed type nodes already that could be tweaked - and indeed Rafael has also released one to do what he wants... ( node-red-contrib-fast-debug-counter ). This debate is whether to just enhance the existing debug to add this mode or not. |
|
@dceejay Sure, I'd be up for contributing to making these changes. I don't think I'll be able to work on that during the week but surely I can make it next weekend. On the node that I've published, I completely removed the Actually, I'm not familiar with making PRs. I was taking a look on the page https://nodered.org/about/contribute/ here, is it just about creating a new branch derived from the master branch and making the changes on the Debug node? Is there any extra procedure I should be aware of? @Steve-Mcl Even though having an official node with a counter that also includes some statistics would be nice as well, for me what really makes the difference and solves the problem is having a node that can print on the debug window and count messages at the same time. So probably in my case, I'd still use my published version of the node if the counter and debug nodes were separated on the official nodes from Node-RED :) |
|
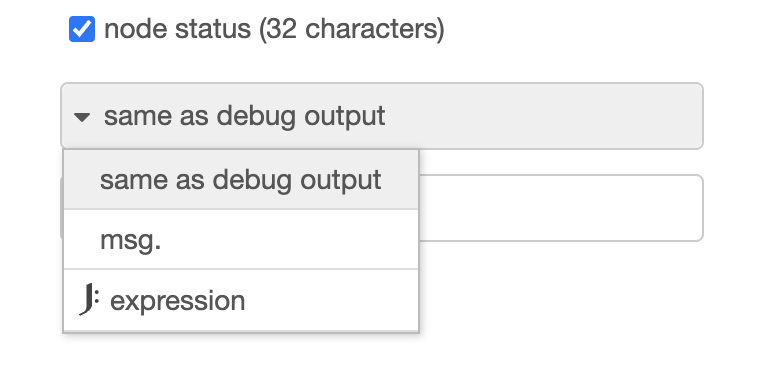
Great - as this is a new feature you need to make a new branch derived from the dev branch (not master) - and then yes edit the debug node code. Any problems just ask. (though I will be on vacation this weekend/next week for Easter so I may not respond so quick) Should be fairly simple to add a new statusType of count - then respond to that in the prepareStatus function - and clear count on close. (as a first pass). And in the html to add a new countType to the typedInput types. ("and then just draw the rest of the horse..." :-) ) |
|
I'm closing this issue as it was not a NR issue. If a PR arrives in the next week that adds the count status option, we can consider it for 3.0. Otherwise it will be bumped to 3.1 |
|
Hi everyone, sorry about the delay. It's actually taking me some time to figure out one last bug that I don't know how to solve yet. The basic functionality is ok already as the following:
I can explain the details about how I've implemented it in a next message... But now I'd like to ask about the bug. I'm having trouble making the status of the debug permanent in the sidebar as follows:
The logical part is ok since I'm using the variable |


|
Hi! A long shot: You could check especially this section here. It looks like you have to define |
|
@rafaelmuynarsk - how is your PR going? If your fork & modifications in a public repo somewhere? If so, I can take a look & help you overcome any issues. Time is running out to get this into the next release. |
|
Hi everyone, Sorry about the delay again, this week I've been mostly working with SQL stuff :s I took the time for finishing the debug node and I made a Pull Request just now. Actually, the only thing that I was missing to make it work was using
To make it simple, the logic behind the counter is based on this snippet: let lastTime = new Date().getTime();
let timeout = null;
for (let i = 0; i < 10; i++) {
if (timeout) { clearTimeout(timeout) }
timeout = setTimeout(() => console.log('Hello'), 200)
}Here it's an example in a loop, but the implemented idea is the same with messages. If the time between the actual message and the last message is bigger than 100 milliseconds it will just print the status of the message. Otherwise (if it's shorter than 100 milliseconds), it works as the last snippet... That means I store the id of a The final code then is like (in the .js file): if ( node.statusType === "counter" ){
const differenceOfTime = ((new Date()).getTime() - node.lastTime);
node.lastTime = new Date().getTime();
node.counter++;
if ( differenceOfTime > 100 ){
node.status({fill:"blue", shape:"ring", text: node.counter});
} else {
if (node.timeout) { clearTimeout(node.timeout) }
node.timeout = setTimeout(() => {
node.status({fill:"blue", shape:"ring", text: node.counter});
}, 200)
}
}I've created a new this.counter = 0; // it stores the value of the counter
this.lastTime = new Date().getTime(); // it stores the time when the last message arrived
this.timeout = null; // it stores the ID of the setTimeout() functionThere are some final considerations that I think are worth reviewing:
Since it doesn't update the status when messages arrive in an interval shorter than 100 milliseconds, it'll wait until the last message to print it. I can see a workaround for this issue using the So, this last point is more a question than a review... Is it ok leaving it like it is now? In my day-to-day cases of use that won't be an issue, but for some people it may be. Would it be worth implementing the logic with the JSON with tests from the GIFs: [{"id":"2f85f3fadd7e8acc","type":"debug","z":"e31af9f309041c23","name":"debug 1","active":false,"tosidebar":true,"console":false,"tostatus":true,"complete":"payload","targetType":"msg","statusVal":"","statusType":"counter","x":1180,"y":440,"wires":[]},{"id":"03da44dac24bcfe4","type":"inject","z":"e31af9f309041c23","name":"","props":[{"p":"payload"},{"p":"topic","vt":"str"}],"repeat":"","crontab":"","once":false,"onceDelay":0.1,"topic":"","payload":"","payloadType":"date","x":700,"y":440,"wires":[["17705a66856f885e"]]},{"id":"17705a66856f885e","type":"function","z":"e31af9f309041c23","name":"send 10000 messages","func":"for (let i = 0; i < 10000; i++) {\n\tnode.send(msg)\n}","outputs":1,"noerr":0,"initialize":"","finalize":"","libs":[],"x":940,"y":440,"wires":[["2f85f3fadd7e8acc"]]},{"id":"4bd7bbc82b575d98","type":"inject","z":"e31af9f309041c23","name":"","props":[{"p":"payload"},{"p":"topic","vt":"str"}],"repeat":"","crontab":"","once":false,"onceDelay":0.1,"topic":"","payload":"","payloadType":"date","x":700,"y":480,"wires":[["34290aa5cae9367a"]]},{"id":"34290aa5cae9367a","type":"debug","z":"e31af9f309041c23","name":"debug 1","active":false,"tosidebar":true,"console":false,"tostatus":false,"complete":"payload","targetType":"msg","statusVal":"","statusType":"auto","x":900,"y":480,"wires":[]},{"id":"ba122f37601cf84d","type":"debug","z":"e31af9f309041c23","name":"debug 1","active":false,"tosidebar":true,"console":false,"tostatus":true,"complete":"payload","targetType":"msg","statusVal":"","statusType":"counter","x":1420,"y":400,"wires":[]},{"id":"e1f5c70950d06b3d","type":"inject","z":"e31af9f309041c23","name":"","props":[{"p":"payload"},{"p":"topic","vt":"str"}],"repeat":"","crontab":"","once":false,"onceDelay":0.1,"topic":"","payload":"","payloadType":"date","x":700,"y":400,"wires":[["702cb1dbbf37646d"]]},{"id":"702cb1dbbf37646d","type":"function","z":"e31af9f309041c23","name":"send 100 messages with an interval of 101 milliseconds each","func":"function sleep(time) {\n return new Promise(resolve => {\n setTimeout(() => {\n resolve();\n }, time);\n });\n}\n\nasync function executeAsync(){\n\tfor (let i = 0; i < 100; i++) {\n\t\tawait sleep(101)\n\t\tnode.send(msg)\n\t}\n}\nexecuteAsync()\n","outputs":1,"noerr":0,"initialize":"","finalize":"","libs":[],"x":1060,"y":400,"wires":[["ba122f37601cf84d"]]},{"id":"04180e32ce72c344","type":"debug","z":"e31af9f309041c23","name":"debug 1","active":false,"tosidebar":true,"console":false,"tostatus":true,"complete":"payload","targetType":"msg","statusVal":"","statusType":"counter","x":1400,"y":320,"wires":[]},{"id":"6afb34eecccdde77","type":"inject","z":"e31af9f309041c23","name":"","props":[{"p":"payload"},{"p":"topic","vt":"str"}],"repeat":"","crontab":"","once":false,"onceDelay":0.1,"topic":"","payload":"","payloadType":"date","x":700,"y":320,"wires":[["198f872fab6dc739"]]},{"id":"198f872fab6dc739","type":"function","z":"e31af9f309041c23","name":"send 100 messages with an interval of 80 milliseconds each","func":"function sleep(time) {\n return new Promise(resolve => {\n setTimeout(() => {\n resolve();\n }, time);\n });\n}\n\nasync function executeAsync(){\n\tfor (let i = 0; i < 100; i++) {\n\t\tawait sleep(80)\n\t\tnode.send(msg)\n\t}\n}\nexecuteAsync()\n","outputs":1,"noerr":0,"initialize":"","finalize":"","libs":[],"x":1050,"y":320,"wires":[["04180e32ce72c344"]]}] |
|
The "complicated" way of handling the edge case that I mentioned is actually this code: if ( node.statusType === "counter" ){
const differenceOfTime = ((new Date()).getTime() - node.lastTime);
node.lastTime = new Date().getTime();
node.counter++;
if ( differenceOfTime > 100 ){
node.intervalActivated = false;
node.status({fill:"blue", shape:"ring", text: node.counter});
} else {
if (node.intervalActivated === false){
node.intervalID = setInterval(() => {
node.status({fill:"blue", shape:"ring", text: node.counter})
}, 500)
}
node.intervalActivated = true;
if (node.timeout) { clearTimeout(node.timeout) }
node.timeout = setTimeout(() => {
if (node.intervalID) { clearTimeout(node.intervalID) }
node.status({fill:"blue", shape:"ring", text: node.counter})
}, 200)
}
}I had to add two more global variables for it:
It'll continue displaying the messages every 500 milliseconds. The PR that I sent doesn't work like this... For me, I'm not sure if this is a desired functionality... |

I just took a glance at your implementation regarding this detail:
For me, this needs some rework: The given check is a guard to ensure that An additional note: I would / should have placed this comment into your PR. As there yet seems to be issue with the baselining (I'm convinced @Steve-Mcl can support on this), I was unsure if it survives the probably necessary modifications... |

Current Behavior
I have node-red v2.2.2 currently installed in different machines with Ubuntu. And I realized that when I use the functions
node.warn('any word')ornode.error('any word')once, they will print the message on the debug window twice:I have an old version of Node-red 1.2.1 installed on one machine and it doesn't happen there. I'm sure it's an issue with version 2.2.2.
Expected Behavior
The expected behavior is printing the message only once when I use the function
node.warnonce.Steps To Reproduce
No response
Example flow
[{"id":"884df64fc0706d1a","type":"function","z":"ff922ddb.76cc18","name":"node.error('printing twice')","func":"node.error('printing twice')\nreturn msg;","outputs":1,"noerr":0,"initialize":"","finalize":"","libs":[],"x":1470,"y":1900,"wires":[["d16a5938e610505c"]]},{"id":"c84f153b25b2ec5b","type":"inject","z":"ff922ddb.76cc18","name":"","props":[{"p":"payload"},{"p":"topic","vt":"str"}],"repeat":"","crontab":"","once":false,"onceDelay":0.1,"topic":"","payload":"","payloadType":"date","x":1260,"y":1900,"wires":[["884df64fc0706d1a"]]},{"id":"d16a5938e610505c","type":"debug","z":"ff922ddb.76cc18","name":"","active":true,"tosidebar":true,"console":false,"tostatus":false,"complete":"payload","targetType":"msg","statusVal":"","statusType":"auto","x":1690,"y":1900,"wires":[]},{"id":"53023a7dd1eb74ea","type":"function","z":"ff922ddb.76cc18","name":"node.warn('printing twice')","func":"node.warn('printing twice')\nreturn msg;","outputs":1,"noerr":0,"initialize":"","finalize":"","libs":[],"x":1470,"y":1960,"wires":[["30bbcdcf40181b6d"]]},{"id":"d59918f0a0e600ef","type":"inject","z":"ff922ddb.76cc18","name":"","props":[{"p":"payload"},{"p":"topic","vt":"str"}],"repeat":"","crontab":"","once":false,"onceDelay":0.1,"topic":"","payload":"","payloadType":"date","x":1260,"y":1960,"wires":[["53023a7dd1eb74ea"]]},{"id":"30bbcdcf40181b6d","type":"debug","z":"ff922ddb.76cc18","name":"","active":true,"tosidebar":true,"console":false,"tostatus":false,"complete":"payload","targetType":"msg","statusVal":"","statusType":"auto","x":1690,"y":1960,"wires":[]}]Environment
The text was updated successfully, but these errors were encountered: