tree-visualizer is a simple JavaScript library that allows you to visualize binary trees form arrays. Optionally, you can also visualize linked list structure.
This is a visual aid for learning binary trees, to help learners understand the tree structure. When learning binary trees, it is common to write them on paper. However, in order to visually grasp the rotation of the tree structure, for example, writing on paper requires a lot of effort. By using this library, you can input an arrays and follow how the tree structure changes as an animation. We hope this will be an aid to your learning.
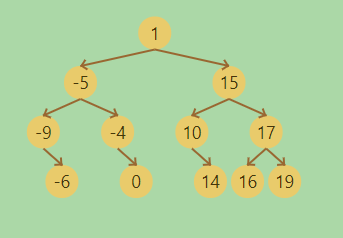
[1,-5,15,-9,-4,10,17,null,-6,null,0,null,14,16,19]=>
See demo
[1,-5,15,-9,-4,10,17,-6,0,14,16,19]=>

[1,-5,15,-9,-4,10,17,-6,0,14,16,19]=>

tree-visualizer uses anime.js
Via npm
npm i tree-visualizer
import treeVisualizer from "./node_modules/tree-visualizer/src/tree-visualizer.es.js";Or link directly
<script src="https://unpkg.com/tree-visualizer/src/tree-visualizer.js"></script>
<script src="https://unpkg.com/animejs@3.2.1/lib/anime.min.js"></script><div id="targetDiv"></div>let targetFn = treeVisualizer(
{target:"targetDiv"}
)
targetFn.drawData(
[{
data:"[1,-5,15,-9,-4,10,17,null,-6,null,0,null,14,16,19]"
}]
)####DataType The default is a tree structure, but LinkedList can also be visualized.
let targetFn = treeVisualizer(
    {
        target:"targetDiv",
        dataType:"SinglyLinkedList"// or "DoublyLinkedList"
    }
)
targetFn.drawData(
    [{
        data:"[1,-5,15,-9,-4,10,17,null,-6,null,0,null,14,16,19]"
    }]
)If you want the text to be displayed along with the animation, you can write the following
let targetFn = treeVisualizer(
    {target:"targetDiv"}
)
targetFn.drawData(
    [{
        data:"[1,-5,15,-9,-4,10,17,null,-6,null,0,null,14,16,19]"
    }],`<strong>You can write html here</strong>`
)If you want to run animation, set animation to true and connect it with nextStep. tree-visualizer animates the difference.
let targetFn = treeVisualizer(
    {
        target:"targetDiv",
        animation:true
    }
)
targetFn.drawData(
    [{
        data:"[1,-5,15,-9,-4,10,17,null,-6,null,0,null,14,16,19]"
    }],`1st step`
)
targetFn.nextStep(
    [{
        data:"[1,-5,15,-9,-4,10,17,null,-6,8,0,null,14,16,19]"
    }],`2nd step`
)
If you have duplicate Data, please set the ID.
let targetFn = treeVisualizer(
    {
        target:"targetDiv",
        animation:true
    }
)
targetFn.drawData(
    [{
        data:"[1,1,1,null,1,1]",
        ID:"[0,1,2,3,4,5]"
    }],`1st step`
)
targetFn.nextStep(
    [{
        data:"[1,1,1,null,1,1]",
        ID:"[1,0,2,3,5,4]"
    }],`2st step`
)You can change configuration.
let targetFn = treeVisualizer(
    {   target : "targetDiv",
        animation: true,// default: false
        boxColor :'rgb(233,203,107)',//default:'rgb(233,203,107)'
        textColor : 'rgb(69,54,10)',//Only rgb() default:'rgb(69,54,10)'
        arrowColor : 'rgb(153,103,49)',//Only rgb() default: 'rgb(153,103,49)'
        interval : 2000,// ms default: 2000
        boxSize : 30,// px default:30
        boxXMargin: 30,// px default 30
        boxYMargin: 45,// px default 45
    }
)
targetFn.drawData(
    [{
        data:"[1,-5,15,-9,-4,10,17,null,-6,null,0,null,14,16,19]"
    }],`1st step`
)
targetFn.nextStep(
    [{
        data:"[1,-5,15,-9,-4,10,17,null,-6,8,0,null,14,16,19]"
    }],`2nd step`
)You can change the color for each node. By using nextStep, you can animate the color change as well.
let targetFn = treeVisualizer(
    {target:"targetDiv"}
)
targetFn.drawData(
    [{
        data:"[1,2,3,4]",
        boxColor:"[rgb(0,97,59),rgb(0,97,59),rgb(0,97,59),rgb(0,97,59)]",
        textColor:"[rgb(255,255,0),rgb(255,0,0),rgb(255,0,0),rgb(255,0,0)]"
    }]
)You can also display multiple trees.
let targetFn = treeVisualizer(
    {target:"targetDiv"}
)
targetFn.drawData(
    [{
        data:"[1,2,3,4]"
    },
    {
        data:"[5,6,7,8]"
    }
    ]
)mail to: nori.ut3g@gmail.com
"tree-visualizer" is under MIT license