add working examples with Jaeger tracer. #12
Conversation
example/client.py
Outdated
| ls_tracer = lightstep.tracer.init_tracer(group_name="example client", access_token="{your_lightstep_token}") | ||
| # this tracer does not trace all requests, so the @tracer.trace() decorator must be used | ||
| tracer = FlaskTracer(ls_tracer) | ||
| JAEGER_HOST = environ.get('JAEGER_HOST') |
example/client.py
Outdated
|
|
||
| config = Config(config={'sampler': {'type': 'const', 'param': 1}, |
There was a problem hiding this comment.
this could use a comment explaining what's happening, i.e. "configuring and creating an instance of Jaeger Tracer with 100% sampling and debug logging of spans".
example/client.py
Outdated
| for i in range(numrequests): | ||
| send_request() | ||
| return "Requests sent" | ||
| install_all_patches() |
There was a problem hiding this comment.
could use a comment explaining what this does
example/client.py
Outdated
| span.set_tag(tags.HTTP_URL, url) | ||
| span.set_tag(tags.SPAN_KIND, tags.SPAN_KIND_RPC_CLIENT) | ||
| headers = {} | ||
| tracer.inject(span, Format.HTTP_HEADERS, headers) |
There was a problem hiding this comment.
sorry, why is this needed? Since you're calling install_all_patches() above, the requests module is automatically instrumented and will do the exact same thing.
example/client.py
Outdated
|
|
||
| time.sleep(2) |
There was a problem hiding this comment.
this may confuse people, I recommend adding a comment
# allow tracer to flush the spans - https://github.com/jaegertracing/jaeger-client-python/issues/50
example/server.py
Outdated
| 'local_agent': | ||
| {'reporting_host': JAEGER_HOST}}, | ||
| service_name="jaeger_opentracing_example") | ||
| ls_tracer = config.initialize_tracer() |
example/server.py
Outdated
| @tracer.trace() | ||
| def log(): | ||
|
|
||
| span_ctx = ls_tracer.extract(Format.HTTP_HEADERS, request.headers) |
There was a problem hiding this comment.
similar to client, the point of using @tracer.trace() is that the handlers are automatically instrumented, but you're doing it again manually
|
@bhs , @yurishkuro - this is ready for re-review. I've added new images, removed code duplication as per Yuri's comments and re-written parts README. This is a server-client example and I'll be adding server-server one as a separate PR. |
example/README.md
Outdated
| app, and the trace will include a span on both the client and server sides. This | ||
| occurs automatically since both the client and server functions are decorated | ||
| with @tracer.trace(). | ||
| To see the traced requests, go to Jaeger web interface. |
example/README.md
Outdated
| 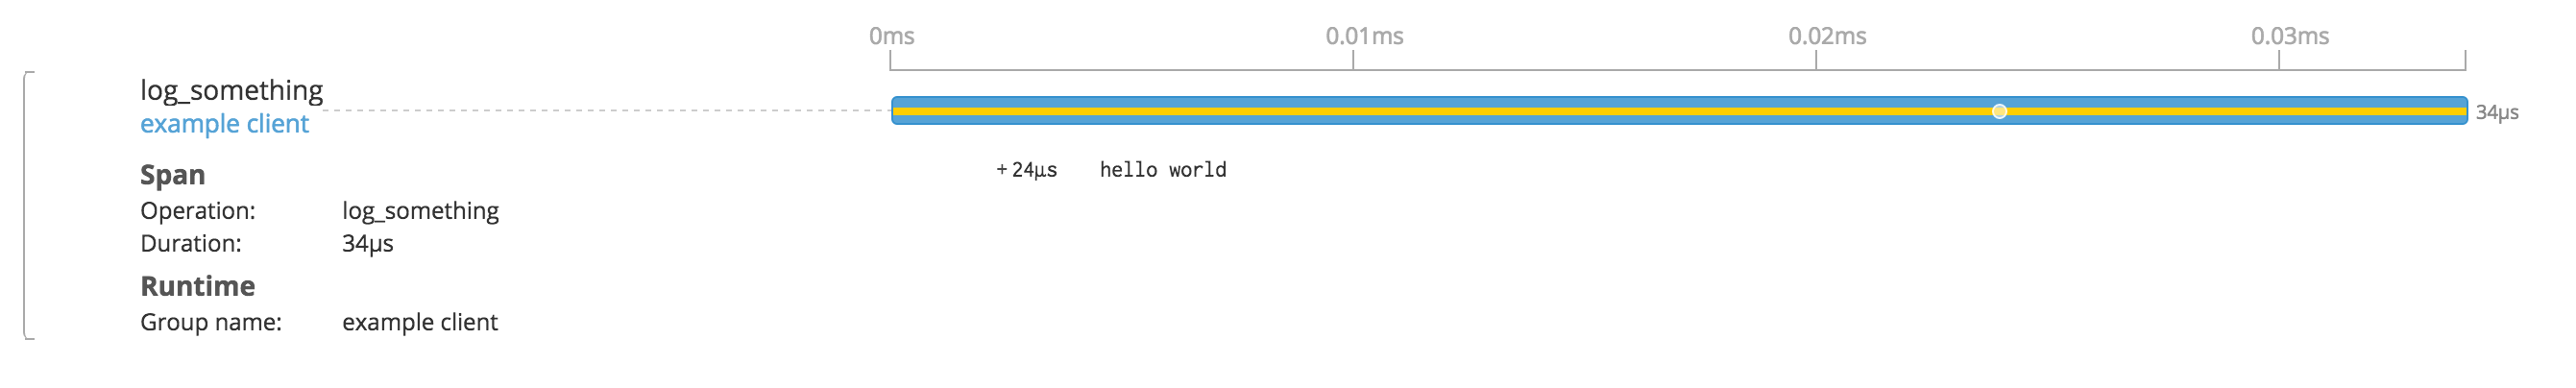 | ||
| Browse to http://localhost:5000/log and compare the trace in Jaeger. | ||
| The last one has 2 spans instead of 3. The span of webserver's GET method is missing. | ||
| That is because in client.py we pass already existing span over the wire, whereas the request from your browser has to tracing data in it. |
There was a problem hiding this comment.
That is because client.py starts a trace and passes trace context over the wire, whereas the request from your browser has to tracing context in it.
example/README.md
Outdated
| span. This example demonstrates how you can trace non-RPC function calls in your | ||
| app, through accessing the current span as follows: | ||
| In log function of the server app, we are creating current_span. This is done to | ||
| trace the work that is being done to render the response to /log. Suppose there's |
example/README.md
Outdated
| trace the work that is being done to render the response to /log. Suppose there's | ||
| a database connection happening. By creating a separate span for it, you'll be able | ||
| to trace the DB request separately from rendering or the response. This gives a | ||
| lot of flexibility to the user. |
There was a problem hiding this comment.
maybe it's worth mentioning that install_patches will do that automatically for some frameworks like SqlAlchemy, Redis client, etc.
example/server.py
Outdated
| tracer = FlaskTracer(jaeger_tracer) | ||
|
|
||
| @app.route('/log') | ||
| # Indicate that /log endpoint should be traced |
There was a problem hiding this comment.
nit: this would read better on the same line as the decorator
example/server.py
Outdated
| # Extract the span information for request object. | ||
| request_span = tracer.get_span(request) | ||
| # Start internal span to trace some kind of business logic for /log. | ||
| current_span = jaeger_tracer.start_span("python webserver internal span of log method", |
There was a problem hiding this comment.
the preferred syntax here would be
with jaeger_tracer.start_span("inner-span", child_of=request_span) as span:
    # Perform some computations to be traced.
span.log_kv({'event': 'my computer knows math!', 'result': c})|
@yurishkuro Fixed per your comments. |
| -p 16686:16686 \ | ||
| -p 14268:14268 \ | ||
| -p 9411:9411 \ | ||
| jaegertracing/all-in-one:latest |
There was a problem hiding this comment.
would it make sense to just use host networking? Most of these ports are not actually necessary for this example anyway.
There was a problem hiding this comment.
It's the way Jaeger manual presents it. I don't want to confuse people who may not be into details of Docker. In any case, ports do not hurt anyone.
Agree?
example/README.md
Outdated
| ### Add spans to the trace manually: | ||
| Speaking about databases, using install_all_patches() method from | ||
| opentracing_instrumentation package gives you a way to trace | ||
| your MySQLdb, SQLAlchemy, Redis queries with without writing boilerplate code. |
example/server.py
Outdated
| def log(): | ||
| request_span = tracer.get_span(request) | ||
| # Extract the span information for request object. | ||
| with jaeger_tracer.start_span("python webserver internal span of log method", |
There was a problem hiding this comment.
personally I would not use such span name even in the example, because it might make people think this is a good practice.
I've added examples that use Jaeger instead of Lightstep, introduce serialization to the wire, and are bare minimal for ease of understanding.
Before running both files you need to set
JAEGER_HOSTandWEBSERVER_HOSTenvironment variables.@bhs @yurishkuro - please let me know if the approach seems good for you. I'll be writing README after your thumbs up on general direction.