- Install the extension, either via Chrome Web Store, or build it manually from source.
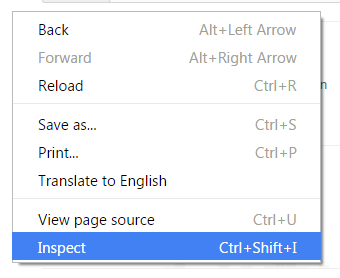
- Open Chrome and go to a web site, right-click -> Inspect. This will open Chrome developer tools.
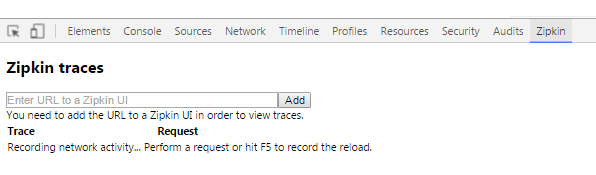
- A panel appears, called Zipkin. Choose it.
- Here, you'll need to configure the URL to your Zipkin UI/query server.
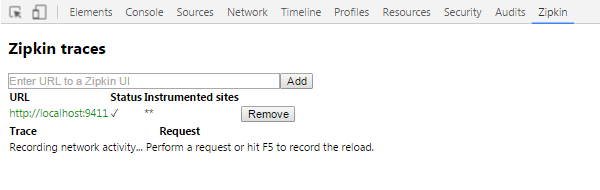
Once you've provided a URL, Chrome will attempt to contact that server, and "auto-discover" its configuration. You can configure multiple Zipkin endpoints if you want to; e.g. one for your development environment, and one for production. In this example case, we specified there's a Zipkin UI running on http://localhost:9411, which probably isn't what you will have in an actual environment; only if you're running the Zipkin server locally. Usually, it would be set to something like http://zipkin.mysite.com/.
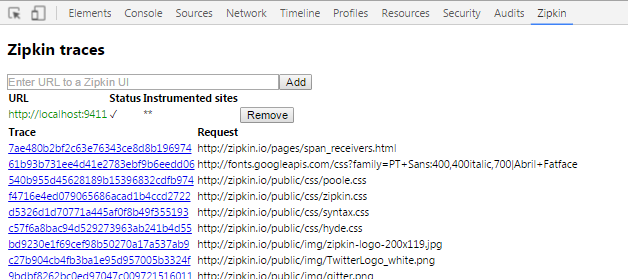
- Use your application and generate traces While you navigate around, Chrome will add Zipkin trace headers to all HTTP requests. In the Zipkin extension, you can click on a generated trace ID to take you directly to the Zipkin UI, displaying that trace.