Chart::Dygraphs - Generate html/javascript charts from perl data using javascript library Dygraphs
version 0.007
use Chart::Dygraphs qw(show_plot);

my $data = [map {[$_, rand($_)]} 1..10 ];
show_plot($data);

use Chart::Dygraphs qw(show_plot);
use DateTime;

my $start_date = DateTime->now(time_zone => 'UTC')->truncate(to => 'hour');
my $time_series_data = [map {[$start_date->add(hours => 1)->clone(), rand($_)]} 1..1000];

show_plot($time_series_data);Generate html/javascript charts from perl data using javascript library Dygraphs. The result is html that you could see in your favourite browser.
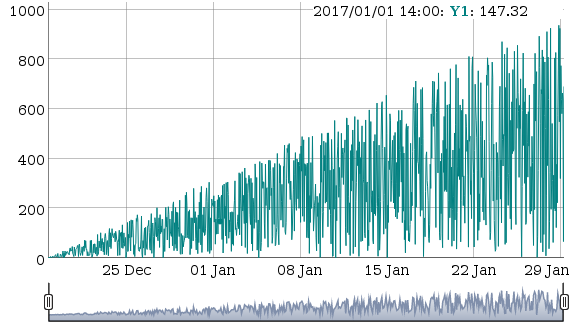
Example screenshot of plot generated with examples/time_series.pl:
The API is subject to changes.
-
data:
Data to be represented. The format is the perl version of the data expected by Dygraphs: http://dygraphs.com/data.html
-
options:
Hashref with options for graph. The format is the perl version of the options expected by Dygraphs: http://dygraphs.com/options.html Optional
-
render_html_options
Hashref with options controlling html output. With this you can inject html, javascript or styles.
Supported options:
- pre_graph_html
- post_graph_html
- dygraphs_div_id
- dygraphs_javascript_object_name
- dygraphs_div_inline_style
Opens the plot in a browser locally
Data to be represented. The format is the same as the parameter data in render_full_html
Please report any bugs or feature requests via github: https://github.com/pablrod/p5-Chart-Dygraphs/issues
Pablo Rodríguez González pablo.rodriguez.gonzalez@gmail.com
This software is copyright (c) 2016 by Pablo Rodríguez González.
This is free software; you can redistribute it and/or modify it under the same terms as the Perl 5 programming language system itself.