Last tick label not showing #31548
Labels
Comments
|
I can reproduce the problem with the most recent pandas- and matplotlib-version, with a very simple DataFrame: import pandas as pd
import matplotlib.pyplot as plt
df = pd.DataFrame({"y1": {"x1": 1, "x2": 2}, "y2": {"x1": 2, "x2": 3}})
print(df)
# y1 y2
# x1 1 2
# x2 2 3
df.plot()
plt.savefig("out.png")
Interestingly, this error does not occur with one or three data rows. Output of `pd.show_versions()` |

Sign up for free
to join this conversation on GitHub.
Already have an account?
Sign in to comment
Noticed while working on #31207
Code Sample, a copy-pastable example if possible
Problem description
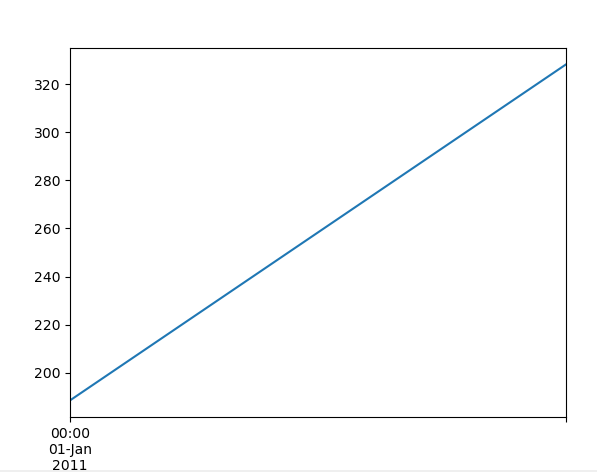
Here's the output I see:
Note: We receive a lot of issues on our GitHub tracker, so it is very possible that your issue has been posted before. Please check first before submitting so that we do not have to handle and close duplicates!
Note: Many problems can be resolved by simply upgrading
pandasto the latest version. Before submitting, please check if that solution works for you. If possible, you may want to check ifmasteraddresses this issue, but that is not necessary.For documentation-related issues, you can check the latest versions of the docs on
masterhere:https://pandas-docs.github.io/pandas-docs-travis/
If the issue has not been resolved there, go ahead and file it in the issue tracker.
Expected Output
Would have expected both xticks to be labelled
Output of
pd.show_versions()[paste the output of
pd.show_versions()here below this line]INSTALLED VERSIONS
commit : d448f7df88534da7c791efa3ef7eff3c72985cb3
python : 3.7.6.final.0
python-bits : 64
OS : Linux
OS-release : 4.15.0-74-generic
machine : x86_64
processor : x86_64
byteorder : little
LC_ALL : None
LANG : en_GB.UTF-8
LOCALE : en_GB.UTF-8
pandas : 0.26.0.dev0+2017.gfc813e76e
numpy : 1.17.3
pytz : 2019.3
dateutil : 2.8.1
pip : 19.3.1
setuptools : 45.0.0.post20200113
Cython : 0.29.14
pytest : 5.3.3
hypothesis : 5.1.5
sphinx : 2.3.1
blosc : None
feather : None
xlsxwriter : 1.2.7
lxml.etree : 4.4.2
html5lib : 1.0.1
pymysql : None
psycopg2 : None
jinja2 : 2.10.3
IPython : 7.11.1
pandas_datareader: None
bs4 : 4.8.2
bottleneck : 1.3.1
fastparquet : 0.3.2
gcsfs : None
lxml.etree : 4.4.2
matplotlib : 3.1.2
numexpr : 2.7.1
odfpy : None
openpyxl : 3.0.1
pandas_gbq : None
pyarrow : 0.15.1
pytables : None
pytest : 5.3.3
pyxlsb : None
s3fs : 0.4.0
scipy : 1.4.1
sqlalchemy : 1.3.12
tables : 3.6.1
tabulate : 0.8.6
xarray : 0.14.1
xlrd : 1.2.0
xlwt : 1.3.0
xlsxwriter : 1.2.7
numba : 0.47.0
The text was updated successfully, but these errors were encountered: