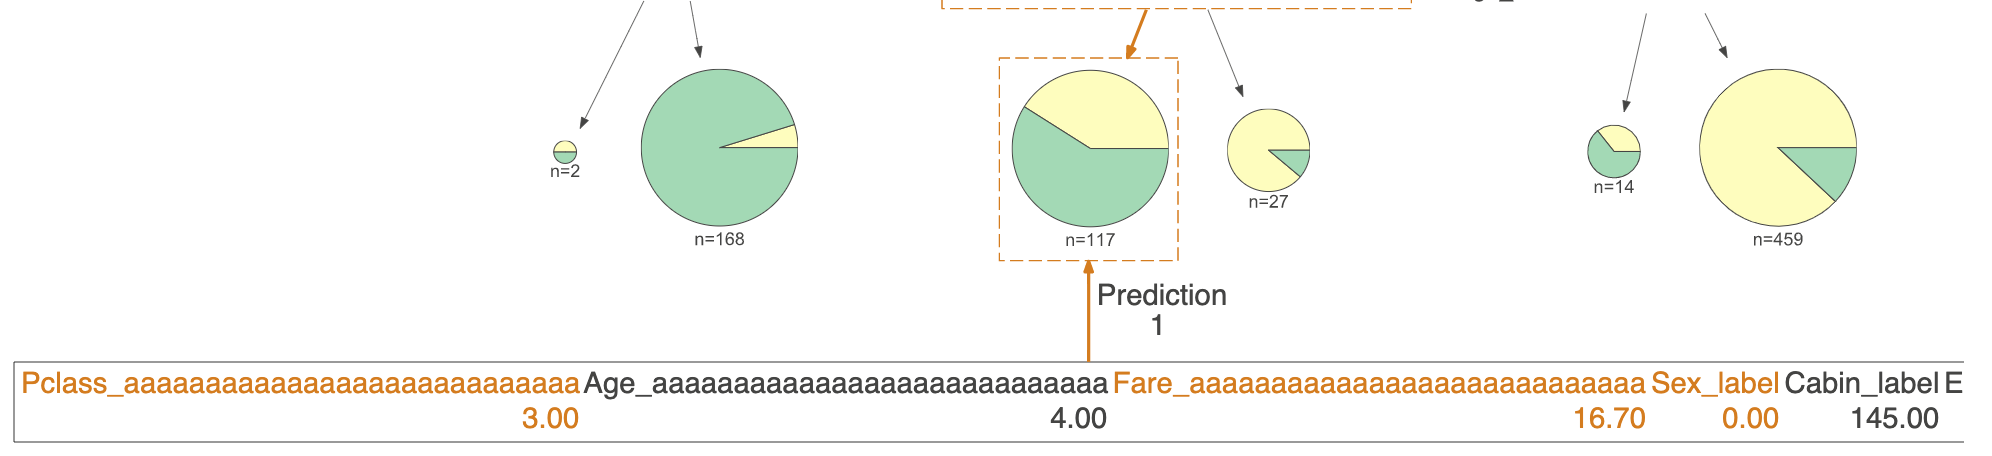
Highlighting features used by prediction path #75
Comments
|
Hi @Rkubinski, thanks for your feedback. |
|
Great ! Thanks :) |
|
Weird. Is that on windows? mac? Does it do same if vertical? |
|
Same problem with vertical, this is on Ubuntu 18.10, |
|
Ok, this was a font metrics problem when it was happening on mac/windows. Maybe we need to make that configurable. or if already is, please try diff font. |
|
Where do I pass a font type option ? Dont see such a parameter for dtreeviz object |
|
@Rkubinski can you provide the list of feature names ? I tried to reproduce the issue with long feature names and it works.
|
dtreeviz() method has the 'fontname' parameter |
|
Ok, I was not sure what you meant by font metrics. OTUs: |
|
@Rkubinski, indeed you have a long list of features :). Meanwhile I will try to reproduce the issue with a list of features similar in length with yours ;) |
|
I created a vertical version for instance table. It is configurable through instance_orientation parameter. @parrt do you have a better name for instance_orientation parameter ?
|

|
Hi, |
|
I plan to make a PR tomorrow :) |
|
|
|
@Rkubinski I have just created the PR #78 . I hope it will solve your issue. Waiting for your feedback ;) |
|
Hi guys. Thank you so much for the help. I am still new to this, I tried to update dtreeviz via pip but I guess that has not been updated yet. So to use this new version, I am assuming I would have to pull from github and run the scripts directly ? |
|
Hi @Rkubinski, yes, you can use the master version from repo until @parrt will make a new release. |
|
@tlapusan Great! Ill get back to you when Ive tested it out |
|
hi @Rkubinski, any feedback ? I would like to close this issue. |
|
Hi guys, sorry for the delay in feedback, it did work out in the end :) |
Is there any way to remove highlighted features used by prediction path or print them differently like in a table along with their importances ? Please see picture below - the features are quite smushed together and I would like to present them in a different manner or not present them at all.

The text was updated successfully, but these errors were encountered: