-
- Navigate to System -> Settings -> Logging/Targets
- Add a new Logging/Target (Click the plus icon)
- Transport = UDP(4)
- Applications = Nothing Selected
- Levels = Nothing Selected
- Facilities = Nothing Selected
- Hostname = Input the ELK IP address ointo (eg 192.168.100.50)
- Port = 5140
- Description = pfELK
- Click Save
- 📌 References
-
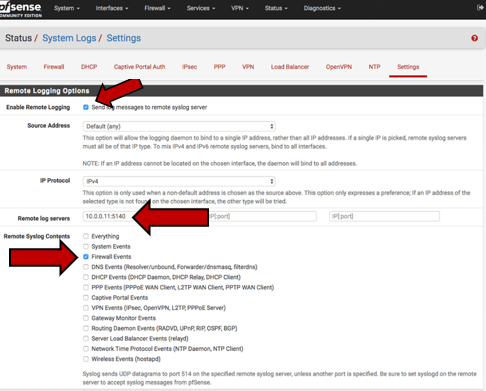
- Navigate to Status -> System Logs, then click on Settings
- At the bottom check Enable Remote Logging
- (Optional) Select a specific interface to use for forwarding
- Input the ELK IP address into the field Remote log servers followed by port 5140 (e.g. 192.168.100.50:5140)
- Under Remote Syslog Contents check Everything
- Click Save
- 📌 References
-
In OPNsense navigate to Services -> Intrusion Detection -> Administration
- Enable = [X]
- IPS mode = [ ] or [X]
- Promiscuous mode = [ ] or [X]
- Enable syslog alerts = [ ] or [X]
- Enable eve syslog output [X]
- Pattern matcher = Default / Aho-Corasick /Hyperscan
- Interfaces = Select As Necessary (must have at least one or nothing will be detected)
- Rotate log = Default / Weekly / Daily
- Save logs = Any Value You Desire
- Click Apply
-
📌 References
- On your pfSense web UI go to Services -> Suricata -> Interfaces, and enable Suricata on desired interfaces
- You can have separate configuration for each of your interfaces, you can edit them via clicking on the pencil icon
- Enable the EVE JSON output format for log forwarding, enabled the following options within the EVE Output Settings section:
- EVE JSON log: Suricata will output selected info in JSON format to a single file or to syslog.
- EVE Output type: FILE
- EVE Syslog Output Facility: AUTH
- EVE Syslog Output Priority: NOTICE
- EVE Log Alerts: Suricata will output Alerts via EVE
- Saving this will auto-enable settings at the Logging Settings menu, the Log Facility should be "LOCAL1", and the Log Priority should be "NOTICE".
- 📌 References
- ❌ In-Depth Guide Located Here
-
- Navigate to Services -> Snort -> Snort Interfaces
- For each configured interface, click on the pencil, to the right, to edit (repeat these steps for each)
- In each "Interface" Settings -> under Alert Settings check Send Alerts to System Log
- Scroll down and choose Save
- 📌 References
-
- Navigate to Services -> HAProxy -> Settings -> Settings -> Logging Configuration
- Log Host = Enter the IP address of where pfELK is installed and the Port 5140 (e.g. 192.168.100.50:5140)
- Syslog facility = local0[default]
- Filter syslog level = info[default]
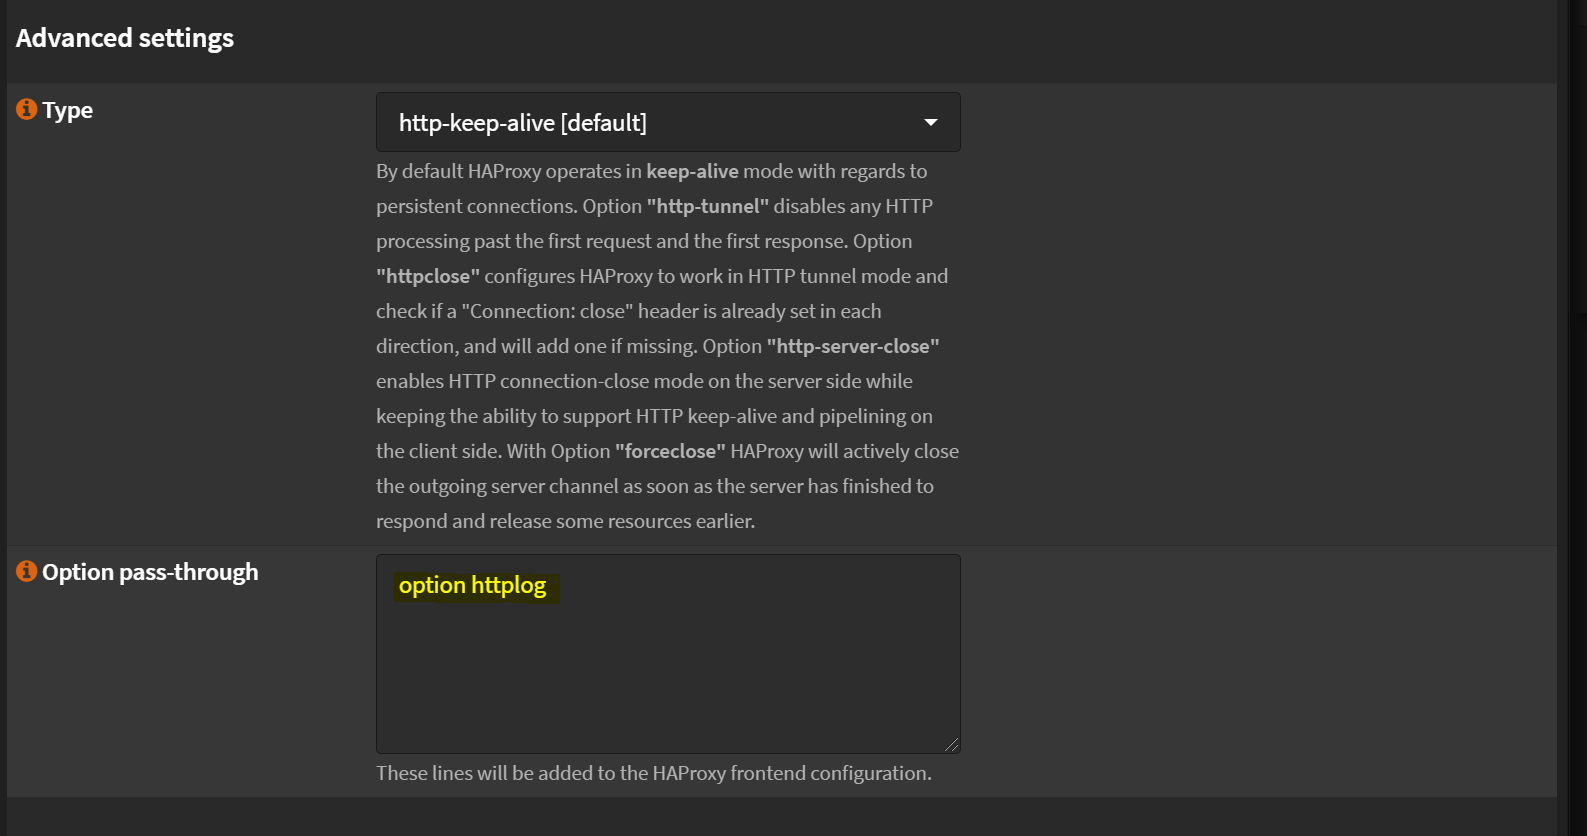
- Add the httplog under HAProxy -> Settings -> Virtual Services -> Public Servers -> edit your public service
- Enable advanced mode and scroll down
- Under Option pass-through add option httplog
- 📌 References
-
- Navigate to Services -> Nginx -> Other -> SYSLOG Targets
- Host = Enter the IP address of where pfELK is installed and the Port 5140 (e.g. 192.168.100.50:5140)
- Facility = local0
- Filter syslog level = info
- Add the created syslog target to your HTTP Server(s) under HTTP(S) -> HTTP Server -> Select Server -> advanced mode -> SYSLOG Targets
- Enable Extended Log on same page under Access Log Format -> Extended
-
- In OPNsense navigate to Services -> Web Proxy -> Administration -> General Proxy Settings
- Enable advanced mode
- Access log target = Syslog(JSON)
- 📌 References
-
- In OPNsense navigate to Services -> Unbound DNS -> Advanced
- Log level verbosity =
Level 0 - Log Queries = [X]
- 📌 References
-
- Navigate to Services>>DNS Resolver
- Add the following line to the custom options:
server: log-queries: yes ........ * any other custom config options *- Navigate to Services>>DNS Resolver>>Advance Settings
- Set Log Level to
Level 0: No Logging**
Preparation • Install • Security • Templates • Configuration