Unable to get call stack in spring-webflux boots on netty server #6352
Comments
|
@david100gom |
|
@jaehong-kim - Thanks for the timely clarification, does current code base has RC2 version where i can use it ? and when RC2 version planned for a release ? |
|
@jaehong-kim - whether the Netty spring webflux plugin available in master branch ? |
|
@dinesh4747 |
|
@jaehong-kim - Thanks for the update and I tried using the binaries from master/latest, But unable to find the tracing data for application methods, rather it shows the call stack only for native netty and webflux. In none of the request, Pinpoint couldnt get the profiling data for the rest api request Referemce logs: 019-12-25 00:25:44 [DEBUG](c.n.p.p.g.i.ToJsonInterceptor :140) AFTER com.google.gson.Gson args:() result:{"traceId":"5e025f256fedb4682b992ff62015a4f4","spanId":"2b992ff62015a4f4","spanExportable":"false","timestampSeconds":1577213744,"timestampNanos":363000000,"severity":"INFO","thread":"reactor-http-nio-5","logger":"com.lowes.cart.infrastructure.integration.client.impl.CartDataConnectorImpl","message":"Reponse Time - cart-data-svc - updateCart API : 2897ms","context":"default","logging.googleapis.com/trace":"projects/gcp-ushi-telemetry-npe/traces/5e025f256fedb4682b992ff62015a4f4","logging.googleapis.com/spanId":"2b992ff62015a4f4"} |
|
@jaehong-kim - Not sure what does Async context was missing refers to.. But none of the spring-webflux apps could trace Can someone please give us some direction ? |
|
Can you make a reproduction sample project? |
|
@dinesh4747 |
|
@jaehong-kim - Yes we org.springframework.web.reactive.function.client.WebClient making any external calls From the call tree I could see only the trace of Netty native method calls and none of the application related method calls were been intercepted
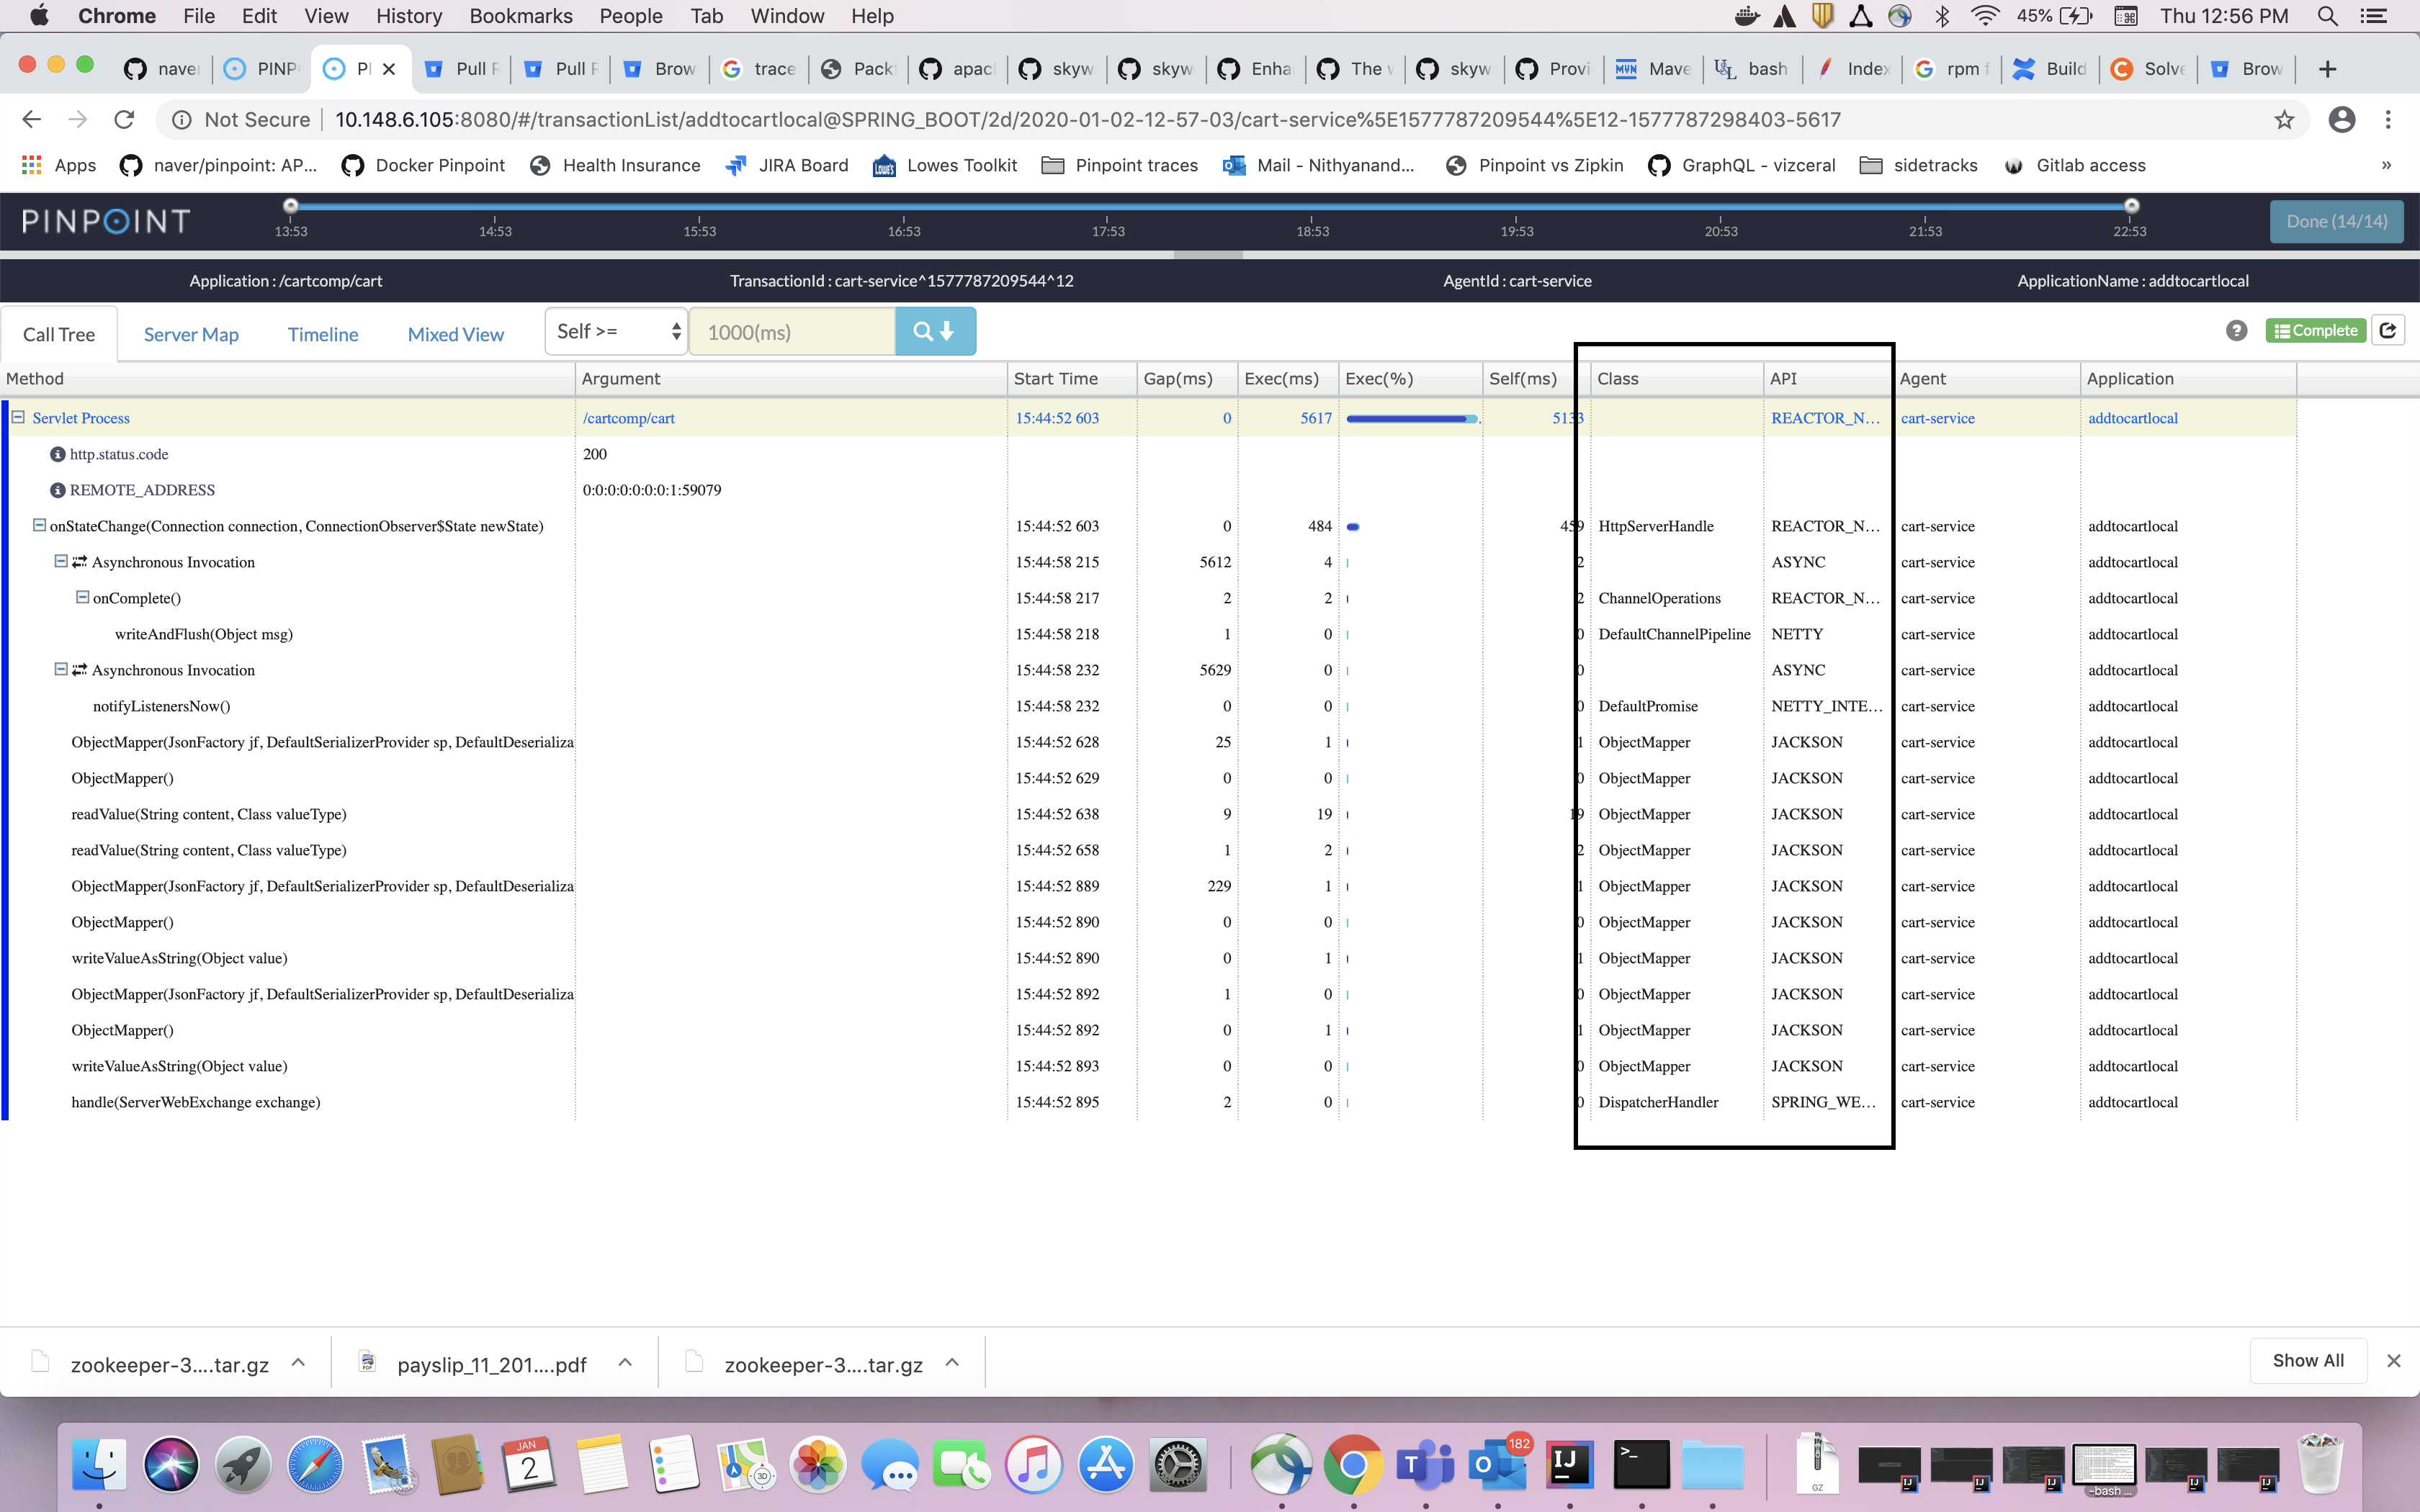
While you look at the API column, it was very evident that it traces "Netty, jackson and webflux" where none of the application specific methods where getting traces |

|
@dinesh4747 Sample Code |
|
Above was code base actually used in one of the api call |
|
Looks like pinpoint agent doesn't pick up the application methods and just profiles only the native Netty method internal calls, is there any specific config changes need to be done or I am missing something here i have forked the code from master version snapshot-2.0 It would be really great if someone can show some direction here |
|
In order to trace Netty based spring webflux whether we need any specific configuration or tweaks in pinpoint.config... since i have followed the steps as mentioned in the plugin but still unable to trace application specific methods @jaehong-kim @emeroad |
|
could someone please help me here in some direction which will bring this issue to closure... |
|
Few Observations:
While you look at the call stack as attached below, it was tracing only the native/internal method calls of netty/spring webflux and none of the application bound calls being traced
|
|
@jaehong-kim - Could you please share your guidance here, your word of though would be Highly appreciated |
or
If you have additional methods you want to track, pass the actual code. please |
|
@jaehong-kim - Thanks a ton Kim... while you look at the screenshot above in correlation with options tried, do you see any discrepancy and why its tracing application specific method calls by default?... Any clue or suspicion on this pls... |
|
@jaehong-kim - As per the documentation here - https://github.com/naver/pinpoint/blob/master/plugins/spring-webflux/README.md - By default we should get the tracing of application specific methods running under netty server right.. But I don't see its coming out.. Could you please confirm if I am missing something here or any specific config changes to be done to enable appl specific method tracing ? |
|
@jaehong-kim @emeroad - I have enabled the debug flag as well and tried using Thrift protocol as well as part of work around, but none of them appears to be working.. Is this a bug like netty profiler plugin was not tracing as expected Version of spring boot and webflux used: 1) spring boot starter is :- 2.1.3.RELEASE Logs for reference: 2020-01-06 12:46:44 DEBUG Initialized requestEvent. request=POST{uri=/cartcomp/cart, connection=SimpleConnection{channel=[id: 0x12f85769, L:/127.0.0.1:6060 - R:/127.0.0.1:54449]}}, serviceType=REACTOR_NETTY, methodDescriptor={className=reactor.netty.http.server.HttpServerHandle, methodName=onStateChange, parameterTypes=[reactor.netty.Connection, reactor.netty.ConnectionObserver$State], parameterVariableName=[connection, newState], parameterDescriptor=(reactor.netty.Connection connection, reactor.netty.ConnectionObserver$State newState), apiDescriptor=reactor.netty.http.server.HttpServerHandle.onStateChange(reactor.netty.Connection connection, reactor.netty.ConnectionObserver$State newState), lineNumber=57, apiId=-1154, fullName=reactor.netty.http.server.HttpServerHandle.onStateChange(reactor.netty.Connection connection, reactor.netty.ConnectionObserver$State newState):57, type=0} Requesting you to take a final look and confirm so that I can proceed with other options, since I have spent almost close to a month on this... Any help or suggestion would really take me in closing this ticket |
|
@jaehong-kim - Awaiting for your response on this ticket... Your view on this ticket would really help in getting into some closure... |
|
@dinesh4747 |
|
@jaehong-kim - As requested here with I have enclosed the code base for your reference, Requesting you to help with your valuable guidance. And while try tracing it only displays as "Spring boot" App image in the server map and I dont what was the issue, Thanks for your time and response in anticipation |
|
For TestController |
|
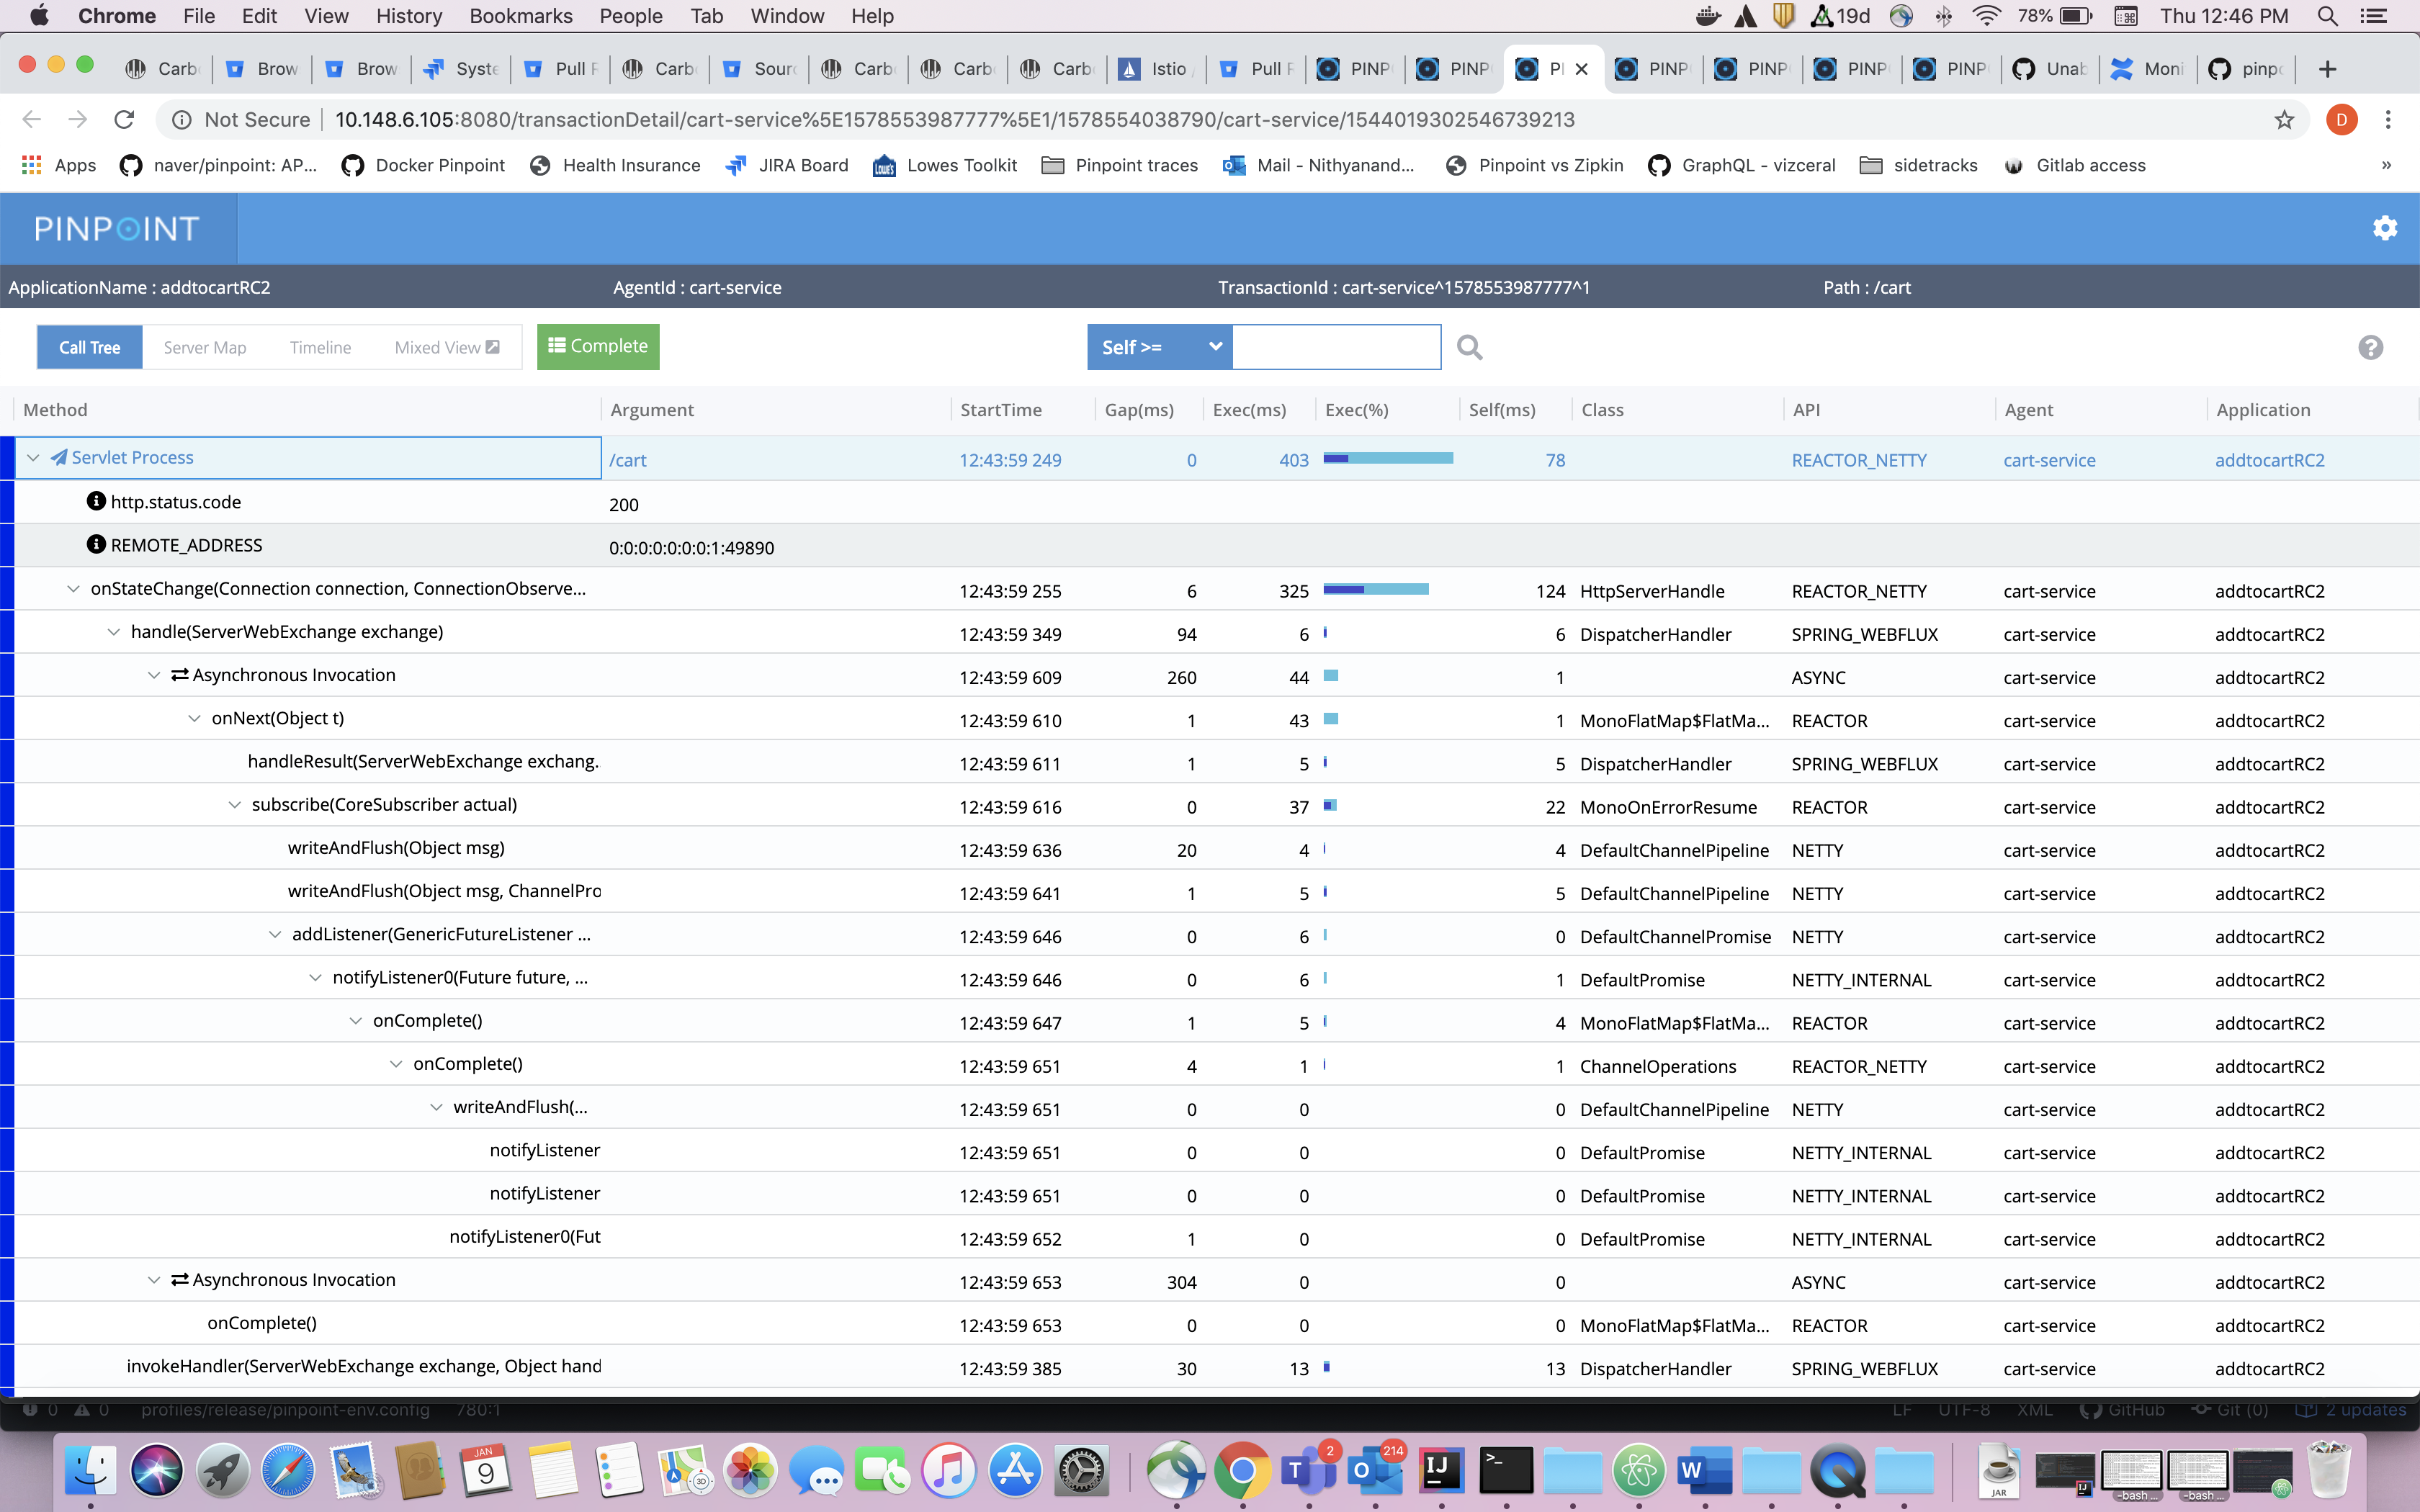
@jaehong-kim - Thanks for your quick response, Unfortunately Hard luck from the call stack we don't see application specific methods where getting profiled/traced and showing up in the call stack and we are still stuck at the same issue we were looking for TestController and service calls needs to be profiled but none of them appears to showing up here from the below snapshot
While you look at the call stack it was only netty/spring webflux internal/native method calls were getting traced, But we wanted the actual application specific methods calls to profiled.. Let me know if I am missing something here. |
|
@jaehong-kim - Could you please share your view from the above comment, here with I have enclosed the config as well for your reference ########################################################### Spring WebFlux########################################################### ClientRecord Parameter.profiler.spring.webflux.client.param=true Record cookies.profiler.spring.webflux.client.cookie=true When cookies should be dumped. It could be ALWAYS or EXCEPTION.profiler.spring.webflux.client.cookie.dumptype=ALWAYS 1 out of n cookies will be sampled where n is the rate. (1: 100%)profiler.spring.webflux.client.cookie.sampling.rate=1 Cookie dump size.profiler.spring.webflux.client.cookie.dumpsize=1024 #profiler.springboot.bootstrap.main=com.sample.cart.CartServiceApplication ########################################################### Reactor########################################################### Set whether to trace the Subscriber.onError(Throwable t) methodprofiler.reactor.trace.subscribe.error=true ########################################################### Netty########################################################### recommend netty plugin disable, when using VERTX.profiler.netty=true ########################################################### spring-beans########################################################### Profile spring-beansprofiler.spring.beans=true filtersfilterfilter OR filtersfiltervaluevalue AND filtervaluetokentoken OR tokentokenprofiler.spring.beans.n.scope= [component-scan | post-processor] default is component-scan.profiler.spring.beans.n.base-packages= [package name, ...]profiler.spring.beans.n.name.pattern= [regex pattern, regex:regex pattern, antstyle:antstyle pattern, ...]profiler.spring.beans.n.class.pattern= [regex pattern, regex:regex pattern, antstyle:antstyle pattern, ...]profiler.spring.beans.n.annotation= [annotation name, ...]Scope:component-scan: <context:component-scan ... /> or @componentscanpost-processor: BeanPostProcessor - Slow!!!ANT Style pattern rules:? - matches on character* - matches zero or more characters** - matches zero or more 'directories' in a pathExamplesprofiler.spring.beans.1.scope=component-scanprofiler.spring.beans.1.base-packages=com.foo, com.barprofiler.spring.beans.1.name.pattern=.*Foo, regex:.*Bar, antstyle:*Controllerprofiler.spring.beans.1.class.pattern=profiler.spring.beans.1.annotation=org.springframework.stereotype.Controller,org.springframework.stereotype.Service,org.springframework.stereotype.Repositoryprofiler.spring.beans.2.scope=post-processorprofiler.spring.beans.2.base-packages=com.fooprofiler.spring.beans.2.name.pattern=profiler.spring.beans.2.class.pattern=antstyle:com.foo.repository.Repository, antstyle:com.foo.Service.Mainprofiler.spring.beans.2.annotation=#profiler.spring.beans.1.scope=component-scan profiler.spring.beans.1.scope=component-scan profiler.spring.beans.2.scope=post-processor profiler.spring.beans.mark.error=true |
|
@jaehong-kim - Looking for your inputs here please. |
|
@jaehong-kim @emeroad @naver - please do help on your final look and so that move forward with other options, also tried all the options as suggested but none of them really helped in tracing the application specific method calls of spring webflux your help and suggestions would be highly appreciated |
|
can someone pls respond to this issue pls |
|
@emeroad @koo-taejin @Xylus @RoySRose @jaehong-kim - In context to this thread and associated below list of issues Just wanted to understand and clarity on whether the current/latest version of Pinpoint (2RC2) supports flux and mono calls or not ? |
|
@dinesh4747 |
|
@emeroad - Thanks for your response, If you can look at the entire list of comments attached in this ticket, you will some background To summarise - From the release notes it says that pinpoint-2RC2 supports spring webflux tracing but it didn't work as expected where unable to trace mono and flux calls I have also attached my sample code for reproduction and @jaehong-kim had a look and suggested few options on the config, But that didn't help as well. Hence I wanted to understand whether its a bug or currently mono and flux trace is not supported in pinpoint. Kindly let me know Incase of additional information and I can also share my code base again for reproducing the same. |
|
@jaehong-kim @emeroad - can someone pls help this get into closure I have been trying really hard in all ways to get conclusion pls do share some lights on this... I have even went on to share my code base as well, but none of them worked... pls help.me here |
|
This issue/proposal has been automatically marked as stale because it hasn't had any recent activity. It will automatically be closed if no further activity occurs for 20days. If you think this should still be open, or the problem still persists, just pop a reply in the comments and one of the maintainers will (try!) to follow up. Thank you for your interest and contribution to the Pinpoint Community. |
Environment:
Pinpoint Agent version - 2.0.0-RC1
Spring boot version - Spring Boot 2.1.3.RELEASE
App code runs on - reactor-netty server which will be started inherently since it uses spring webflux
Issue - Unable to get the scattered point which helps in discovering the
Below exception indicated that spring boot with reactor netty server which comes with spring webflux
2019-12-22 18:46:49 INFO checkapp:addorder:1577040406302 => local. ready() transportId:14
2019-12-22 18:46:49 INFO connect:PingSession{id=14, header=Header{agentId='addorder', applicationName='checkapp', agentStartTime=1577040406302, socketId=1}, eventIdAllocator=0}
2019-12-22 18:46:49 INFO checkapp:addorder:1577040406302 => local. execute handshake:[740, 710, 730, 750]
2019-12-22 18:46:49 INFO AgentInfo{checkapp:addorder:1577040406302:} handleHandshake() started. data:[740, 710, 730, 750]
2019-12-22 18:56:54 INFO Failed to span stream, cause=CANCELLED: cancelled before receiving half close
2019-12-22 18:56:54 INFO Failed to ping stream, id=2, cause=CANCELLED: cancelled before receiving half close
2019-12-22 18:56:54 INFO Failed to stat stream, cause=CANCELLED: cancelled before receiving half close
2019-12-22 18:56:54 INFO Failed to command stream, checkapp:addorder:1577040406302 => local, cause=CANCELLED: cancelled before receiving half close
2019-12-22 18:56:54 INFO close:PingSession{id=14, header=Header{agentId='addorder', applicationName='checkapp', agentStartTime=1577040406302, socketId=1}, eventIdAllocator=3}/ShutdownEventListener{shutdown=false}
2019-12-22 18:56:54 INFO checkapp:addorder:1577040406302 <=> local all streamChannels will be close.
22-Dec-2019 18:56:54.721 SEVERE [Pinpoint-GrpcAgent-Server-3] io.grpc.internal.SerializingExecutor.run Exception while executing runnable io.grpc.internal.ServerImpl$JumpToApplicationThreadServerStreamListener$1Closed@7f6f43d3
io.grpc.StatusRuntimeException: CANCELLED: call already cancelled
at io.grpc.Status.asRuntimeException(Status.java:517)
at io.grpc.stub.ServerCalls$ServerCallStreamObserverImpl.onCompleted(ServerCalls.java:356)
at com.navercorp.pinpoint.collector.receiver.grpc.PinpointGrpcServer.close(PinpointGrpcServer.java:289)
at com.navercorp.pinpoint.collector.receiver.grpc.PinpointGrpcServer.disconnected(PinpointGrpcServer.java:273)
at com.navercorp.pinpoint.collector.receiver.grpc.service.command.GrpcCommandService$2.onError(GrpcCommandService.java:131)
at io.grpc.stub.ServerCalls$StreamingServerCallHandler$StreamingServerCallListener.onCancel(ServerCalls.java:269)
at io.grpc.PartialForwardingServerCallListener.onCancel(PartialForwardingServerCallListener.java:40)
at io.grpc.ForwardingServerCallListener.onCancel(ForwardingServerCallListener.java:23)
at io.grpc.ForwardingServerCallListener$SimpleForwardingServerCallListener.onCancel(ForwardingServerCallListener.java:40)
at io.grpc.Contexts$ContextualizedServerCallListener.onCancel(Contexts.java:96)
at io.grpc.internal.ServerCallImpl$ServerStreamListenerImpl.closed(ServerCallImpl.java:293)
at io.grpc.internal.ServerImpl$JumpToApplicationThreadServerStreamListener$1Closed.runInContext(ServerImpl.java:738)
at io.grpc.internal.ContextRunnable.run(ContextRunnable.java:37)
at io.grpc.internal.SerializingExecutor.run(SerializingExecutor.java:123)
at com.navercorp.pinpoint.collector.monitor.MonitoredRunnableDecorator$InstrumentedRunnable.run(MonitoredRunnableDecorator.java:113)
at java.util.concurrent.ThreadPoolExecutor.runWorker(ThreadPoolExecutor.java:1149)
at java.util.concurrent.ThreadPoolExecutor$Worker.run(ThreadPoolExecutor.java:624)
at java.lang.Thread.run(Thread.java:748)
2019-12-22 19:00:02 INFO Initialize schedule listener. spanStreamExecutorInterceptor v1.Span/SendSpan, headers=Metadata(content-type=application/grpc,user-agent=grpc-java-netty/1.14.0,agentid=addorder,applicationname=checkapp,starttime=1577041198645,grpc-accept-encoding=gzip), initNumMessages=32, scheduler=StreamExecutorRejectedExecutionRequestScheduler{scheduledExecutorService=java.util.concurrent.ScheduledThreadPoolExecutor@31e4fad7[Running, pool size = 1, active threads = 0, queued tasks = 1, completed tasks = 2614], periodMillis=1000}, listener=Listener{rejectedExecutionListener=RejectedExecutionListener{rejectedExecutionCounter=0, serverCall=DefaultServerCallWrapper{serverCall=io.grpc.internal.ServerCallImpl@22401702}}, requestScheduledFuture=java.util.concurrent.ScheduledThreadPoolExecutor$ScheduledFutureTask@67428d2e}
Please do help us in givingja
The text was updated successfully, but these errors were encountered: