When I access R shiny with IE, plotly is not displayed. #1605
Comments
|
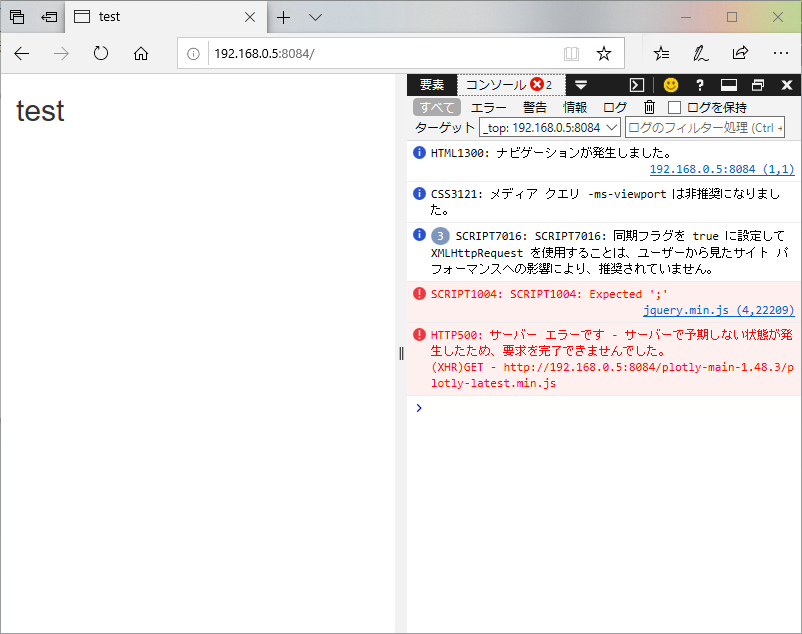
Interesting, thanks, I was able reproduce. When you right-click -> "Inspect" -> Console, do you see an error similar to this one?
@wch @jcheng5 I'm pretty sure this server error will occur for any htmlwidget that uses the library(shiny)
library(leaflet)
ui <- fluidPage(
titlePanel("test"),
leafletOutput("plt")
)
server <- function(input, output) {
output$plt <- renderLeaflet({
l <- leaflet()
l$dependencies <- crosstalk::crosstalkLibs()
l
})
}
shinyApp(ui, server)Note that you may want to disable caching in order to reliably reproduce |

This comment has been minimized.
This comment has been minimized.
The error of the same content was confirmed in the console of Edge.
Nothing was displayed on the IE11 console.
In addition, the graph is displayed if the port number is the same as the previous time, so I changed it to another port number. |

|
It appears this issue was introduced by shiny v1.3.0, specifically this pull request rstudio/shiny#2280, which changed the way static files are served (using a background thread instead of the main R thread) |
|
Fixed in rstudio/httpuv#239 |
When I start shiny by specifying host and port with runApp on Windows10 Home 32bit and access with IE11, there is a problem that the plotly graph is not displayed for the first time.
The version used was R 3.6.0, shiny 1.3.2, plotly 4.9.0.
However, it was displayed when IE was reloaded.
Also, if you start shiny after changing host or port with runApp, the plotly graph will not be displayed for the first time.
Below is the code used to start ui.R and server.R.
ui.R
server.R
It started with the following code.
In addition, the image file of the screenshot when accessing the first time and the third time with IE11 is attached.
The same problem occurred when launching shiny on Windows 10 Pro 64bit.
The same problem occurred when accessing with Edge.
However, this problem did not occur when accessed via Chrome.
Is it possible to display plotly graphs from the first time even when accessing with IE11?
The text was updated successfully, but these errors were encountered: