Matplotlib subplots not working with seaborn distplot #26
Comments
|
Thanks for the examples (and your interest)! Never thought of using seaborn with ProPlot. This is probably related to my |
|
Oooooh interesting! I love the package idea because I myself have never got round to understanding the many ways of controlling matplotlib settings. Should probably look into that too! But yes if it turns out to be a pain ill use a different histogram function I just quite like the seaborn one and it’s easy to use!
Also because it’s a big part of python visualisation I’m guessing others might want it too! Thanks so much
…Sent from my iPhone
On 18 Jul 2019, at 23:22, Luke Davis ***@***.***> wrote:
Thanks for the examples (and your interest)! Never thought of using seaborn with ProPlot. This is probably related to my fill_between_wrapper overrides. All of ProPlot's plotting wrappers are supposed to be strict supersets/not interfer with usage of the existing matplotlib API, but I appear to have overlooked something. Will get to it within the next few days.
—
You are receiving this because you authored the thread.
Reply to this email directly, view it on GitHub, or mute the thread.
|
|
Sorry for the delay -- the latest commit (c45c88a) fixes this. The source of the bug is complicated, but basically I was wrapping the Also note that you cannot specify both the figure dimensions and the axes dimensions. If you input the former the latter will be ignored. ProPlot now issues a warning when this happens. |
|
And thanks again for posting the example, you made it a very quick fix. |
|
@tommylees112 maybe you can help me with this. When I try and run your code above I get I just installed proplot so I have version 0.5.0. Here's the code I used: import pandas as pd
import xarray as xr
import numpy as np
import seaborn as sns
import proplot as plot
import calendar
def drop_nans_and_flatten(dataArray: xr.DataArray) -> np.ndarray:
"""flatten the array and drop nans from that array. Useful for plotting histograms.
Arguments:
---------
: dataArray (xr.DataArray)
the DataArray of your value you want to flatten
"""
# drop NaNs and flatten
return dataArray.values[~np.isnan(dataArray.values)]
# create dimensions of xarray object
times = pd.date_range(start='1981-01-31', end='2019-04-30', freq='M')
lat = np.linspace(0, 1, 224)
lon = np.linspace(0, 1, 176)
rand_arr = np.random.randn(len(times), len(lat), len(lon))
# create xr.Dataset
coords = {'time': times, 'lat':lat, 'lon':lon}
dims = ['time', 'lat', 'lon']
ds = xr.Dataset({'precip': (dims, rand_arr)}, coords=coords)
ds['month'], ds['year'] = ds['time.month'], ds['time.year']
f, axs = plot.subplots(nrows=4, ncols=3, axwidth=1.5, figsize=(8,12), share=2) # share=3, span=1,
axs.format(
xlabel='Precip', ylabel='Density', suptitle='Distribution',
)
month_abbrs = list(calendar.month_abbr)
mean_ds = ds.groupby('time.month').mean(dim='time')
flattened = []
for mth in np.arange(1, 13):
ax = axs[mth - 1]
ax.set_title(month_abbrs[mth])
print(f"Plotting {month_abbrs[mth]}")
flat = drop_nans_and_flatten(mean_ds.sel(month=mth).precip)
flattened.append(flat)
sns.distplot(flat, ax=ax, **{'kde': False})And the error: Plotting Jan
---------------------------------------------------------------------------
ValueError Traceback (most recent call last)
<ipython-input-1-bea6a445aa3a> in <module>
46 flat = drop_nans_and_flatten(mean_ds.sel(month=mth).precip)
47 flattened.append(flat)
---> 48 sns.distplot(flat, ax=ax, **{'kde': False})
49
~/miniconda3/envs/maize-Toff/lib/python3.7/site-packages/seaborn/distributions.py in distplot(a, bins, hist, kde, rug, fit, hist_kws, kde_kws, rug_kws, fit_kws, color, vertical, norm_hist, axlabel, label, ax)
226 ax.hist(a, bins, orientation=orientation,
227 color=hist_color, **hist_kws)
--> 228 if hist_color != color:
229 hist_kws["color"] = hist_color
230
ValueError: The truth value of an array with more than one element is ambiguous. Use a.any() or a.all()Bringing this up because I'm trying to make a similar plot (proplot subplots + sns.distplot()) but am running into that ValueError for my code as well. Hoping it's an easy fix. |
Code sample, a copy-pastable example if possible
A "Minimal, Complete and Verifiable Example" will make it much easier for maintainers to help you.
Making plot using
proplotActual result vs. expected result
This should explain why the current behavior is a problem and why the expected result is a better solution.
The proplot returns a plot like follows:
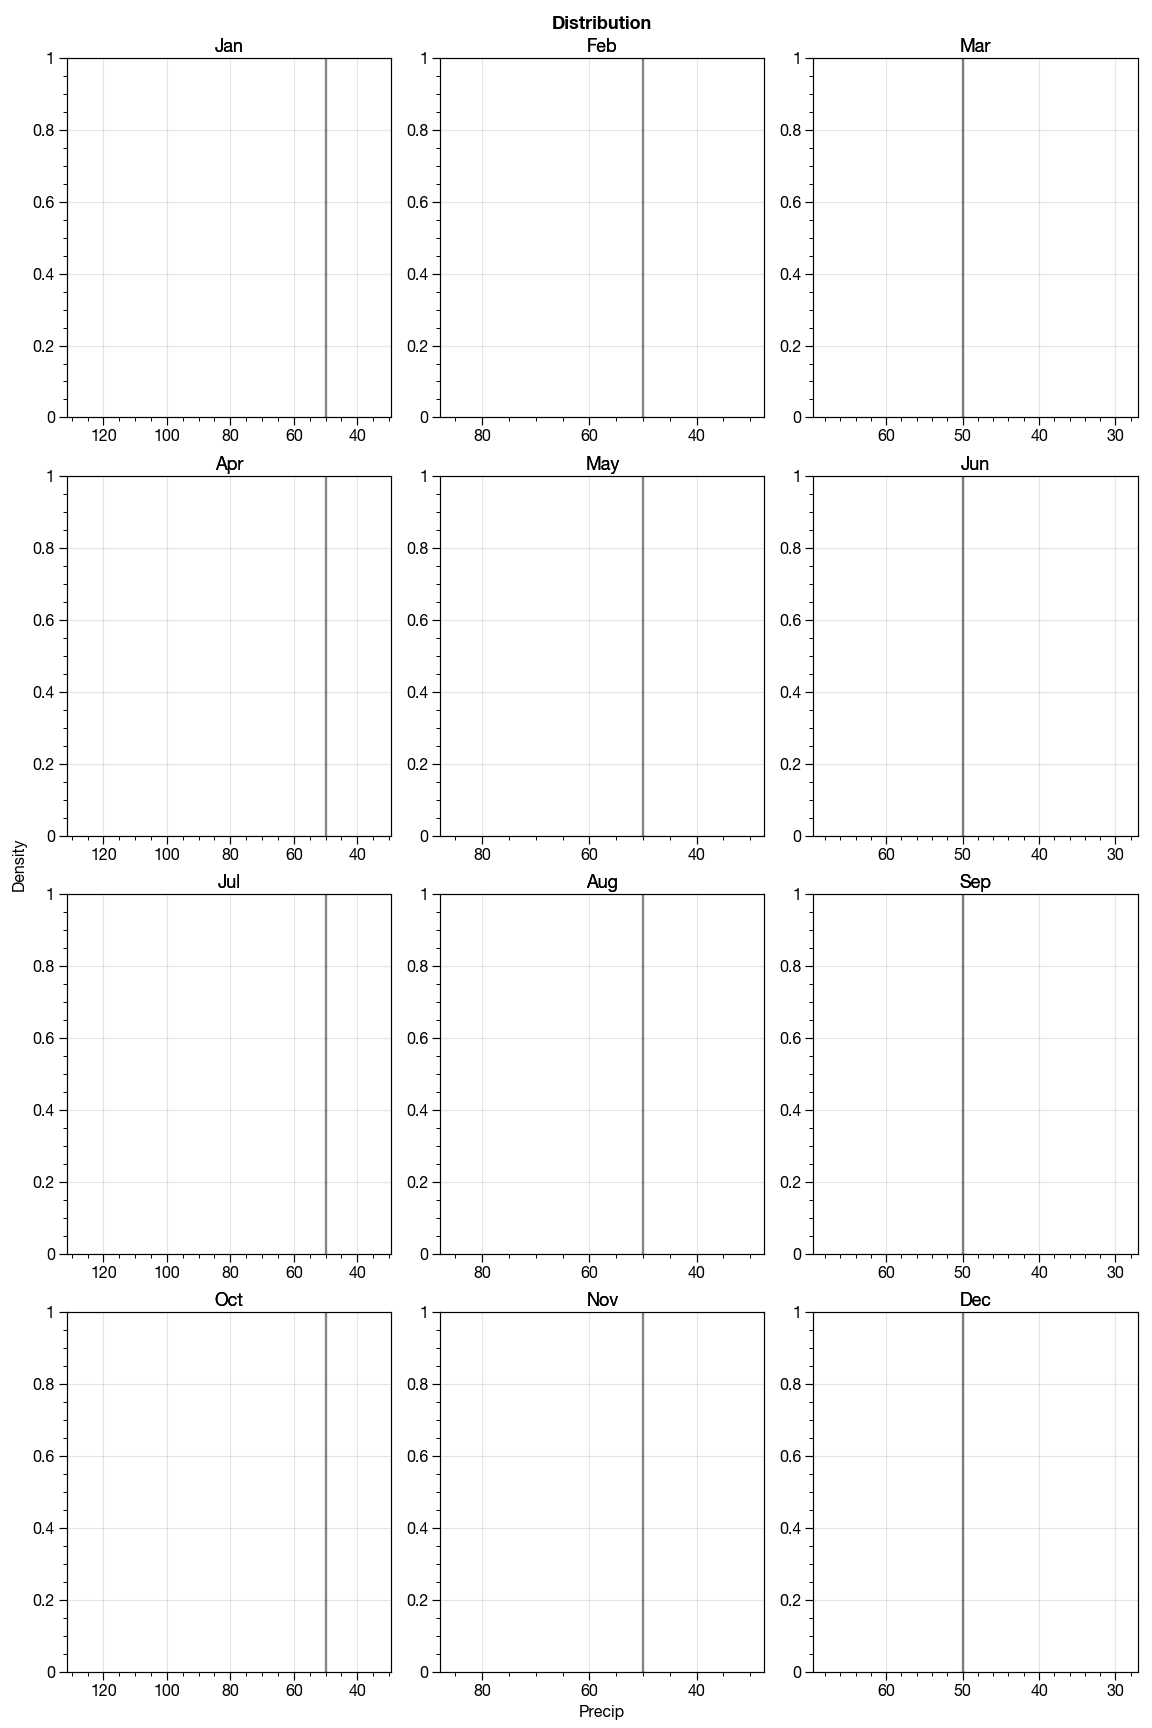
It looks empty plot. Also the axes are only sharing the x-axis for each column but I want it to be shared across all subplots.
The
matplotlibversion does what I expect.The text was updated successfully, but these errors were encountered: