CPU usage calculated incorrectly for servers #1356
Comments
|
You can go over those percentages, its just poor performance when that is happening. You'll need to provide metrics from Docker while this is happening, just showing a percentage in the panel does not help narrow down if this is occurring due to bad math on my end, or if it is actually correct. |
|
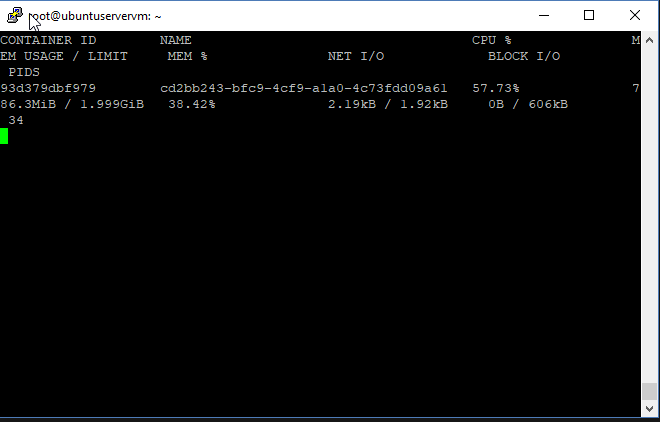
@DaneEveritt Ubuntu 16.04: I also pulled the same data from my Ubuntu 18.04 instance (VMWare in this case), which is showing the ~6000%+ cpu usage. Here are the docker stats for that instance: Ubuntu 18.04: This VMWare instance was running off of 4 cores of my Ryzen 7 1700, while the Hyper-V instance which is also affected runs off 3 cores of a Intel Xeon E3-1271v3 processor. This leads me to believe that it is less likely a performance issue, and more of a issue somewhere in the code. If you do have anymore questions feel free to ask me. |

|
Dumb question, but could you do a side by side of the panel usage display and the docker stats? Theoretically they should be lined up almost exactly (a gif would be perfect if possible). Could you do this on the server view itself, and not the server list (since that updates much slower). That should help me figure out whats going funky. Thanks again. |
|
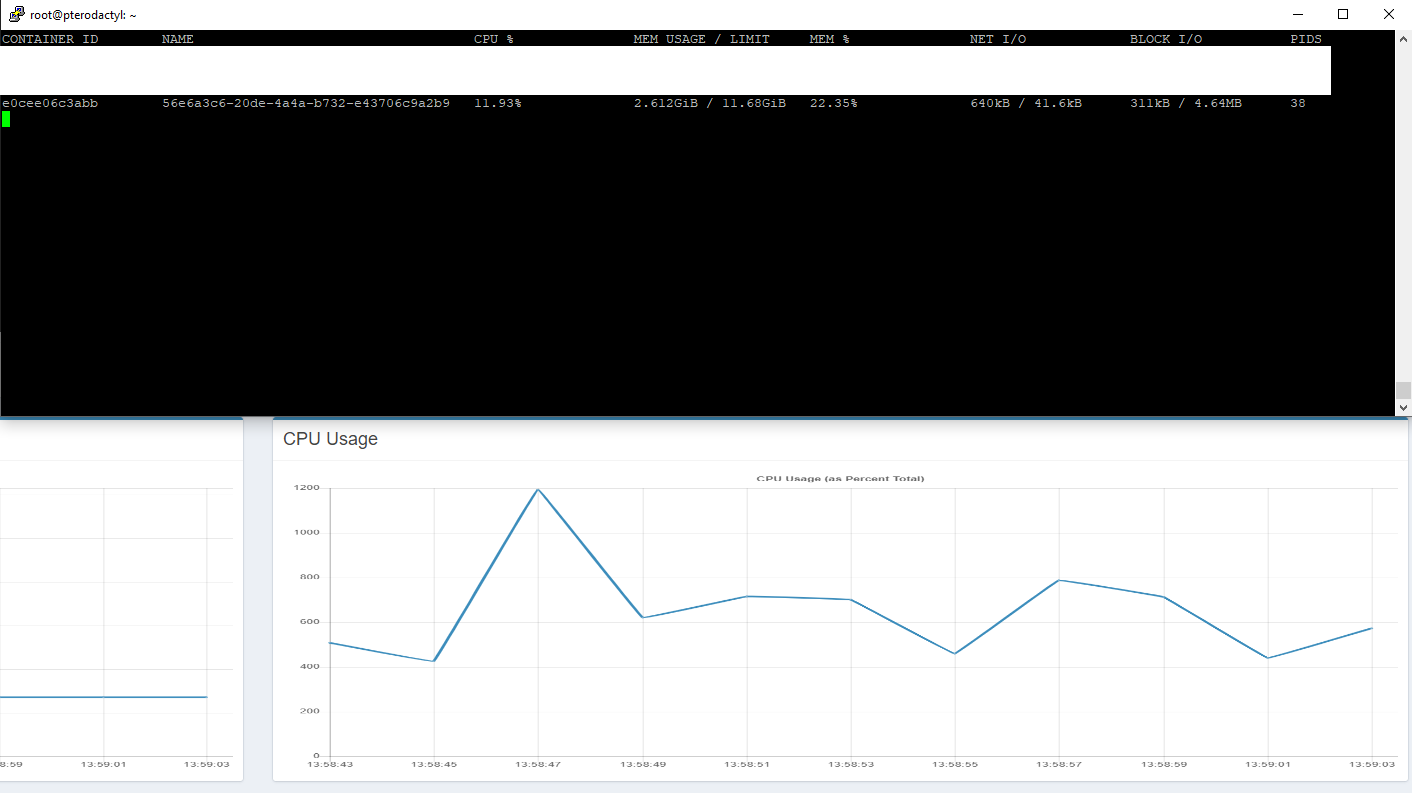
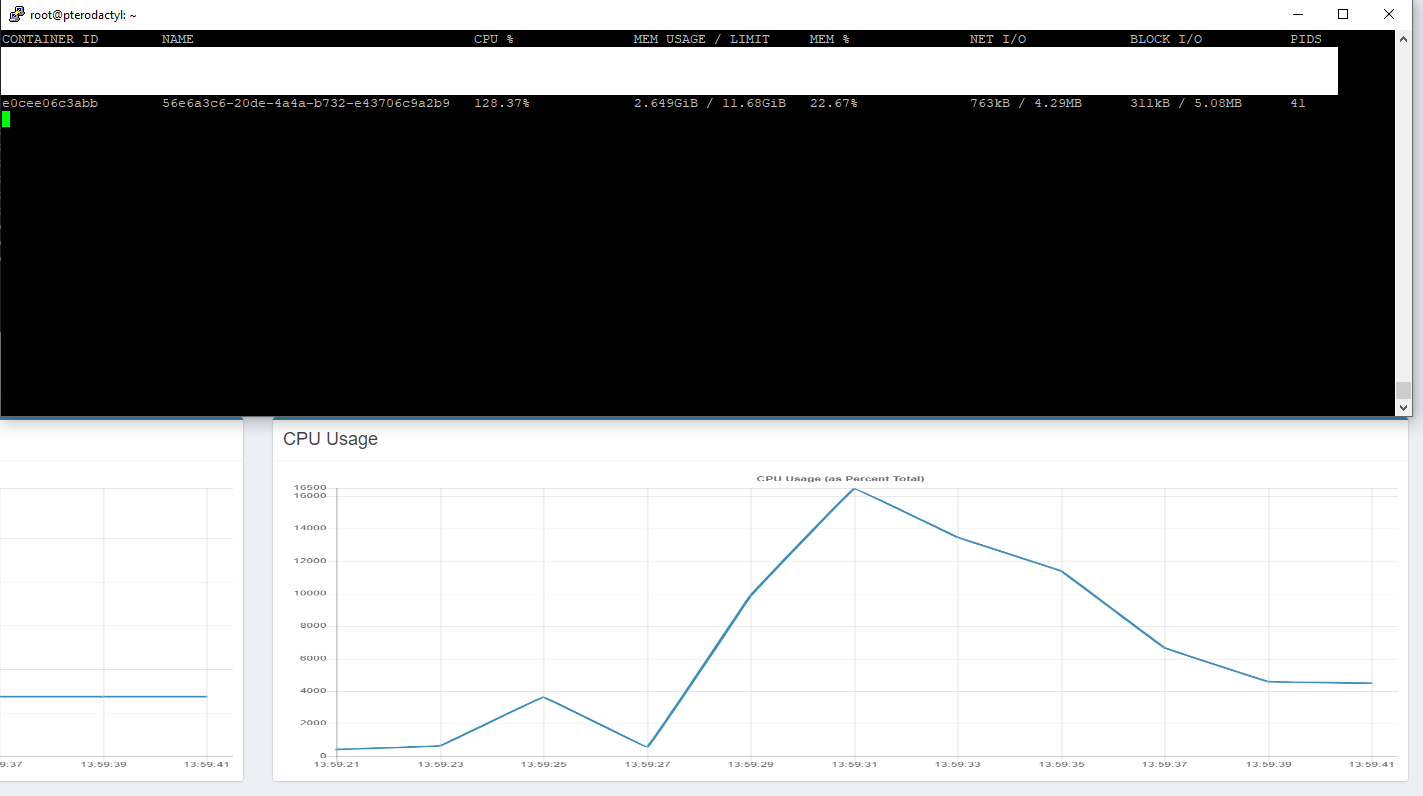
@DaneEveritt Here's the gif you requested. This was taken off of my VMWare instance.
|
|
Do you have a CPU limit set? |
|
I tested with both no CPU limit and the limit set at 200% (to allow for Paper's Async World Generation). Both still resulted in the abnormal CPU Usage percentage on the graphic, but server startup performance was negatively impacted with the CPU limit in place. If you would like I can grab a Docker shot with the CPU limit in place (will take me a little bit though). |
|
Nah thats fine, I just can't reproduce it at all. |
|
Just updating to mention that this issue doesn't seem to occur on latest panel + daemon version on my KVM test instance. Still happens on Hyper-V instance but going to write it up as a issue somewhere in that VM. Going to close issue unless further information is requested. |
|
Updating as well. This is still happening on the latest panel and daemon. Background (please complete the following information):
Describe the bug To Reproduce
Expected behavior This is a test environment and I'm happy to provide credentials to Panel/Daemon/VMs. |
|
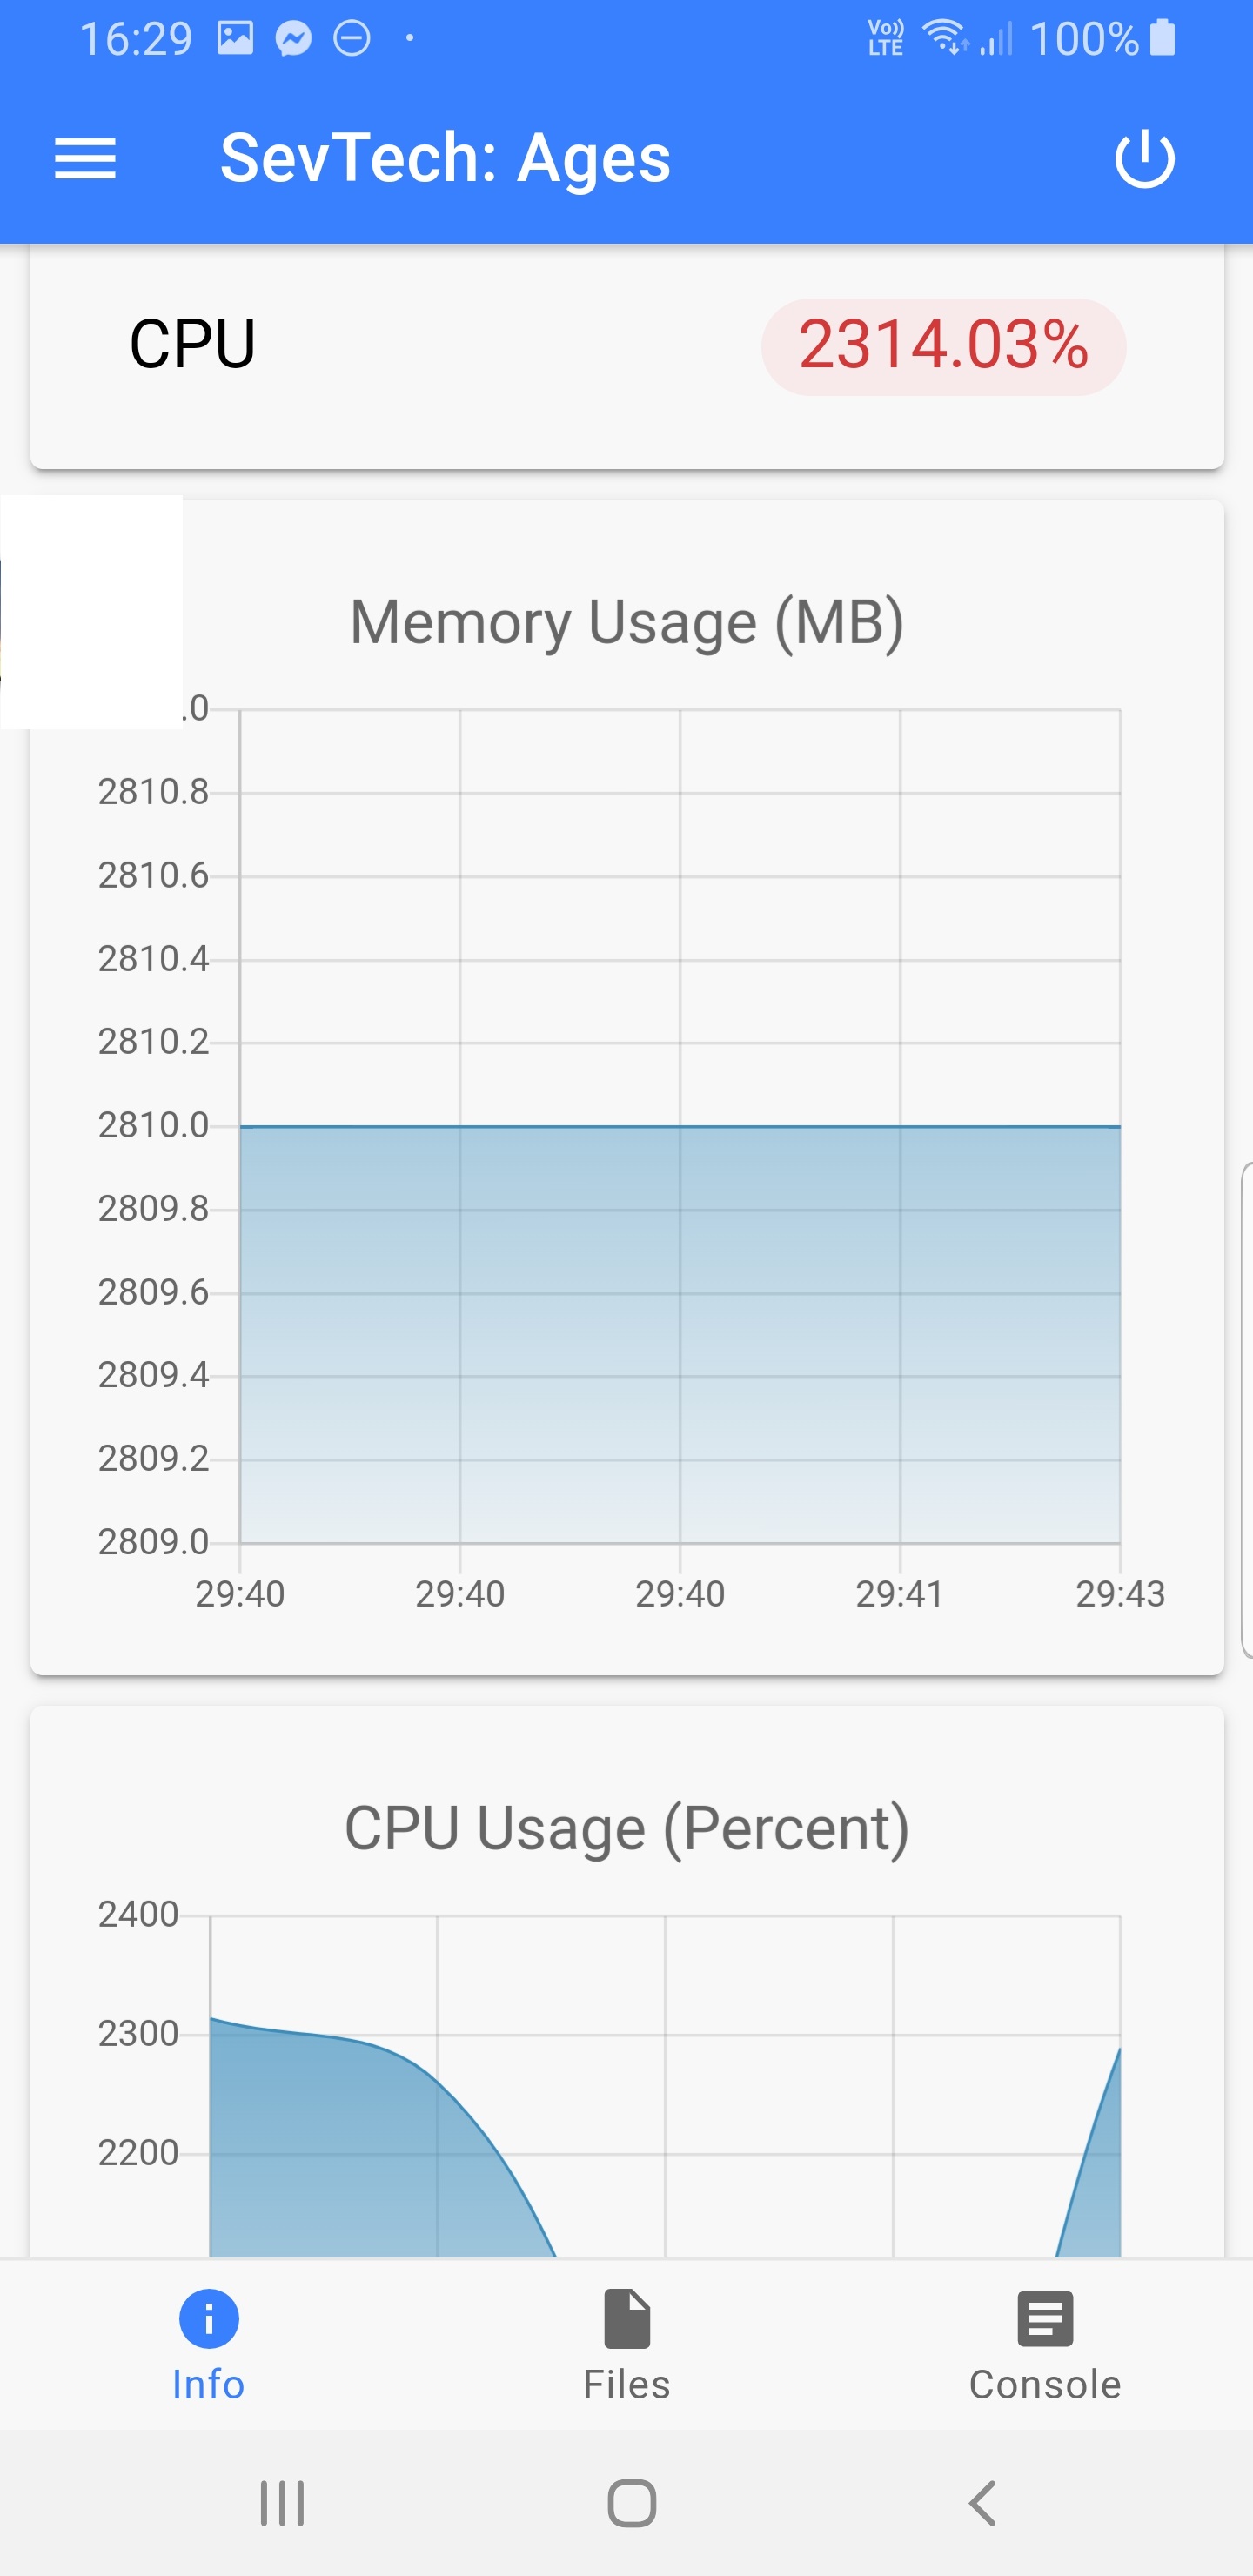
I just wanted to add that this also happens to me. Using Hyper-V, pterodactyl is running in a 5-core Ubuntu 18.04.2 VM. On the game server I have that uses CPU Limit, the graph rarely shows. Maybe because the CPU Limit limits the graphs visible area, while the line is way above this visible area. Just a thought. Here are some pictures. Startup: Back to idle: Player logon: |

|
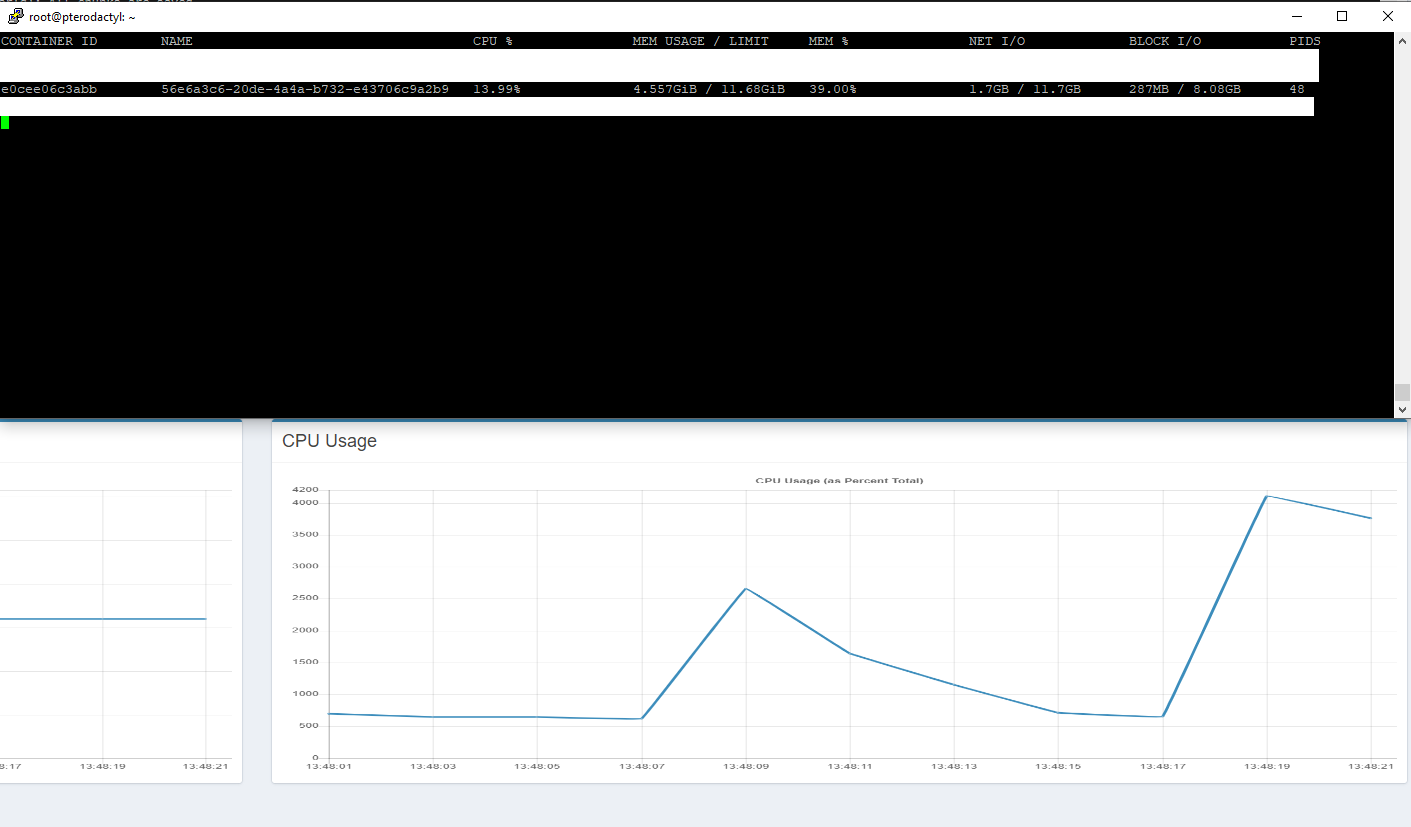
I found something that might be of help. I'll just post the pictures: Server overview: Back to dashboard: As you can see, the dashboard view is at least a little bit more realistic, although I would expect the CPU usage to be more than that. Additionally, I checked docker stats to see if it corresponded. It did not. |


|
Are there any changes about this issue? I have the same result... On |


|
This is fixed in the development builds. |
Background (please complete the following information):
Describe the bug
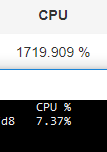
CPU usage percentage indicator appears to be abnormally high when starting a Spigot server (also includes Paper), occasionally reading as high as 6000%+ CPU usage. This issue is even more apparent when starting up the server, although it happens even when players are online.
To Reproduce
Steps to reproduce the behavior:
Expected behavior
100% usage typically equals 1 core, so theoretically the maximum % my CPU usage should be is 800% (8 threads total). My Hyper-V instance however is only 3 threads, so the maximum theoretical usage should be 300%. The test instance I ran on my VMWare Hypervisor had 4 threads, so the maximum theoretical usage should be 400%. I am aware that recent versions of Paper have things such as ASync World Generation, but to see CPU usage over 300% seems completely abnormal to me. Attached is a screenshot of the bug in action while the server was starting.
The text was updated successfully, but these errors were encountered: