关于性能提升问题 #2125
Comments
|
|
@sunhailin-Leo 你好,尝试了使用SVG渲染,相比CANVAS,图表的变化得到了更慢的响应。这无法解决我的需求 |
|
|
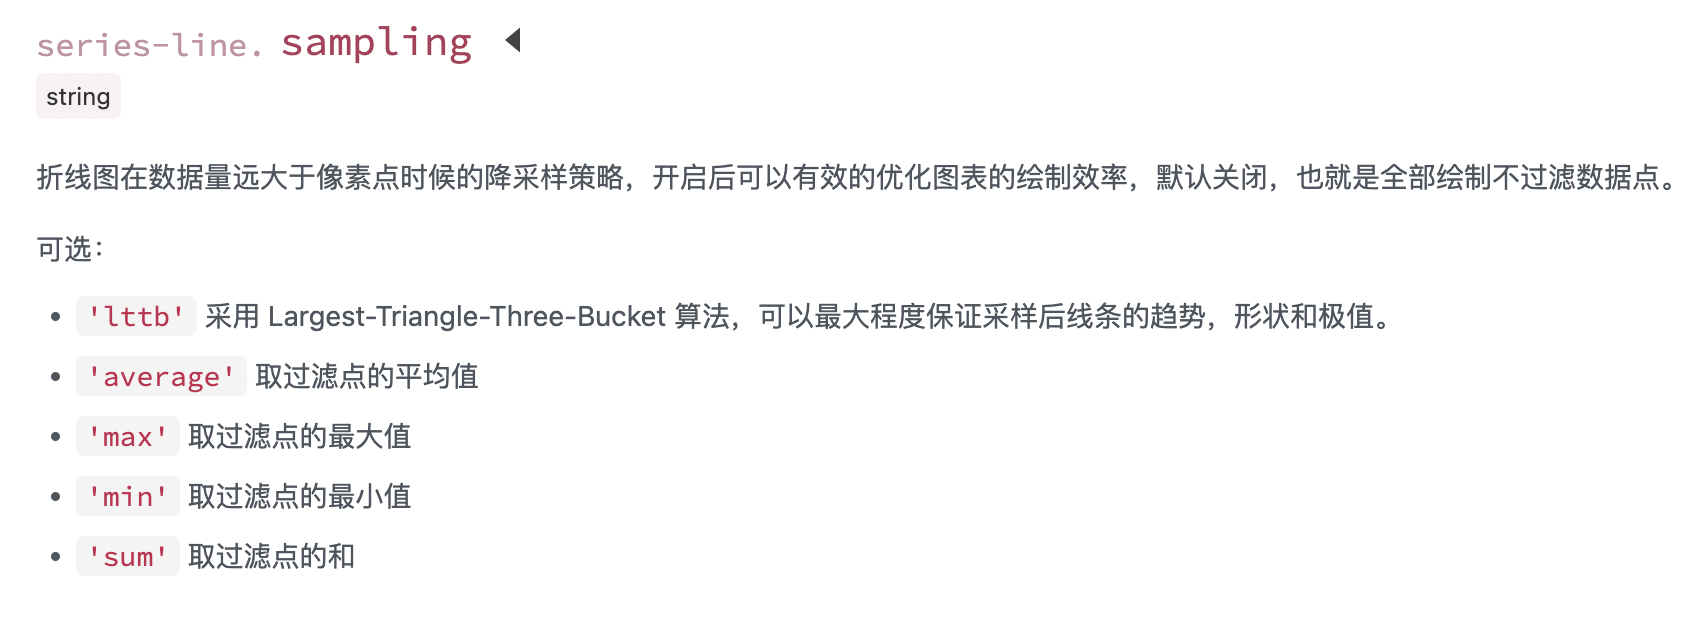
@sunhailin-Leo 查询echarts的相关问题,有提到可以使用降采样等专门为大数据量渲染优化的策略,请问pyecharts是否有相关接口呢? |
|
|
@sunhailin-Leo 是的,我注意到了这个,但我不清楚是否有效或者有其他更合适的优化策略 |
|
|
@sunhailin-Leo 十分感谢你对项目的支持 |
Sign up for free
to join this conversation on GitHub.
Already have an account?
Sign in to comment
问题
求助!!!我是使用Python和Pyehcharts的新手!!在我准备生成的页面中使用较大数据量绘制折线图时,比如数十万个数据,渲染完毕后无论通过pyqt5的QWebEngine还是浏览器打开,在页面中操作dataZoom和进行其他拖动都会非常卡。因为我不希望丢失绝大多数有效数据,在查找pyecharts的官方文档并没有找到能改善性能的方法。 因为附件上传只有25mb,所以我上传了一个较小的文件,实际中的文件可能达到百兆左右。希望各位能帮助我这个菜鸟~~
运行环境(系统环境及 pyecharts 版本)
Python 3.7.4 32bits
pyecharts 2.0.1
代码及截图
23_02_10___10_47_01_render.txt
The text was updated successfully, but these errors were encountered: