Enable Intel® VTune™ Profiler's Instrumentation and Tracing Technology APIs (ITT) to PyTorch #41001
Labels
feature
A request for a proper, new feature.
module: performance
Issues related to performance, either of kernel code or framework glue
triaged
This issue has been looked at a team member, and triaged and prioritized into an appropriate module
Comments
|
cc @ilia-cher |
|
Hi @ilia-cher, does this PR make sense? Please let me know if you need more information from me. Thank you. |
pytorchmergebot
pushed a commit
that referenced
this issue
Jun 30, 2022
…y APIs (ITT) to PyTorch (#63289)

More detailed description of benefits can be found at #41001. This is Intel's counterpart of NVidia’s NVTX (https://pytorch.org/docs/stable/autograd.html#torch.autograd.profiler.emit_nvtx).

ITT is a functionality for labeling trace data during application execution across different Intel tools.
For integrating Intel(R) VTune Profiler into Kineto, ITT needs to be integrated into PyTorch first. It works with both standalone VTune Profiler [(https://www.intel.com/content/www/us/en/developer/tools/oneapi/vtune-profiler.html](https://www.intel.com/content/www/us/en/developer/tools/oneapi/vtune-profiler.html)) and Kineto-integrated VTune functionality in the future.
It works for both Intel CPU and Intel XPU devices.

Pitch
Add VTune Profiler's ITT API function calls to annotate PyTorch ops, as well as developer customized code scopes on CPU, like NVTX for NVidia GPU.

This PR rebases the code changes at #61335 to the latest master branch.

Usage example:
```
with torch.autograd.profiler.emit_itt():
    for i in range(10):
        torch.itt.range_push('step_{}'.format(i))
        model(input)
        torch.itt.range_pop()
```

cc @ilia-cher @robieta @chaekit @gdankel @bitfort @ngimel @orionr @nbcsm @guotuofeng @guyang3532 @gaoteng-git
Pull Request resolved: #63289
Approved by: https://github.com/malfet
pytorchmergebot
pushed a commit
that referenced
this issue
Jul 13, 2022
…y APIs (ITT) to PyTorch (#63289)

More detailed description of benefits can be found at #41001. This is Intel's counterpart of NVidia’s NVTX (https://pytorch.org/docs/stable/autograd.html#torch.autograd.profiler.emit_nvtx).

ITT is a functionality for labeling trace data during application execution across different Intel tools.
For integrating Intel(R) VTune Profiler into Kineto, ITT needs to be integrated into PyTorch first. It works with both standalone VTune Profiler [(https://www.intel.com/content/www/us/en/developer/tools/oneapi/vtune-profiler.html](https://www.intel.com/content/www/us/en/developer/tools/oneapi/vtune-profiler.html)) and Kineto-integrated VTune functionality in the future.
It works for both Intel CPU and Intel XPU devices.

Pitch
Add VTune Profiler's ITT API function calls to annotate PyTorch ops, as well as developer customized code scopes on CPU, like NVTX for NVidia GPU.

This PR rebases the code changes at #61335 to the latest master branch.

Usage example:
```
with torch.autograd.profiler.emit_itt():
    for i in range(10):
        torch.itt.range_push('step_{}'.format(i))
        model(input)
        torch.itt.range_pop()
```

cc @ilia-cher @robieta @chaekit @gdankel @bitfort @ngimel @orionr @nbcsm @guotuofeng @guyang3532 @gaoteng-git
Pull Request resolved: #63289
Approved by: https://github.com/malfet
facebook-github-bot
pushed a commit
that referenced
this issue
Jul 14, 2022
…?r's=20Instrumentation=20and=20Tracing=20Technology=20APIs=20(IT?= =?UTF-8?q?T)=20to=20PyTorch=20(#63289)?= (#63289)

Summary:
More detailed description of benefits can be found at #41001. This is Intel's counterpart of NVidia’s NVTX (https://pytorch.org/docs/stable/autograd.html#torch.autograd.profiler.emit_nvtx).

ITT is a functionality for labeling trace data during application execution across different Intel tools.
For integrating Intel(R) VTune Profiler into Kineto, ITT needs to be integrated into PyTorch first. It works with both standalone VTune Profiler [(https://www.intel.com/content/www/us/en/developer/tools/oneapi/vtune-profiler.html](https://www.intel.com/content/www/us/en/developer/tools/oneapi/vtune-profiler.html)) and Kineto-integrated VTune functionality in the future.
It works for both Intel CPU and Intel XPU devices.

Pitch
Add VTune Profiler's ITT API function calls to annotate PyTorch ops, as well as developer customized code scopes on CPU, like NVTX for NVidia GPU.

This PR rebases the code changes at #61335 to the latest master branch.

Usage example:
```
with torch.autograd.profiler.emit_itt():
    for i in range(10):
        torch.itt.range_push('step_{}'.format(i))
        model(input)
        torch.itt.range_pop()
```

cc ilia-cher robieta chaekit gdankel bitfort ngimel orionr nbcsm guotuofeng guyang3532 gaoteng-git

Pull Request resolved: #63289
Approved by: https://github.com/malfet

Test Plan: contbuild & OSS CI, see https://hud.pytorch.org/commit/pytorch/pytorch/3c7044728ba9bb792797ef0049f798b7fba4595b

Reviewed By: DanilBaibak

Differential Revision: D37847212

Pulled By: seemethere

fbshipit-source-id: 4336fbe324d6bb9ad5d12a5a85ebea62291dbf5f
Sign up for free
to join this conversation on GitHub.
Already have an account?
Sign in to comment
🚀 Feature
Enable Intel® VTune™ Profiler's Instrumentation and Tracing Technology APIs (ITT) to PyTorch
Motivation
This is Intel's counterpart functionality of NVidia’s NVTX (https://pytorch.org/docs/stable/autograd.html#torch.autograd.profiler.emit_nvtx).
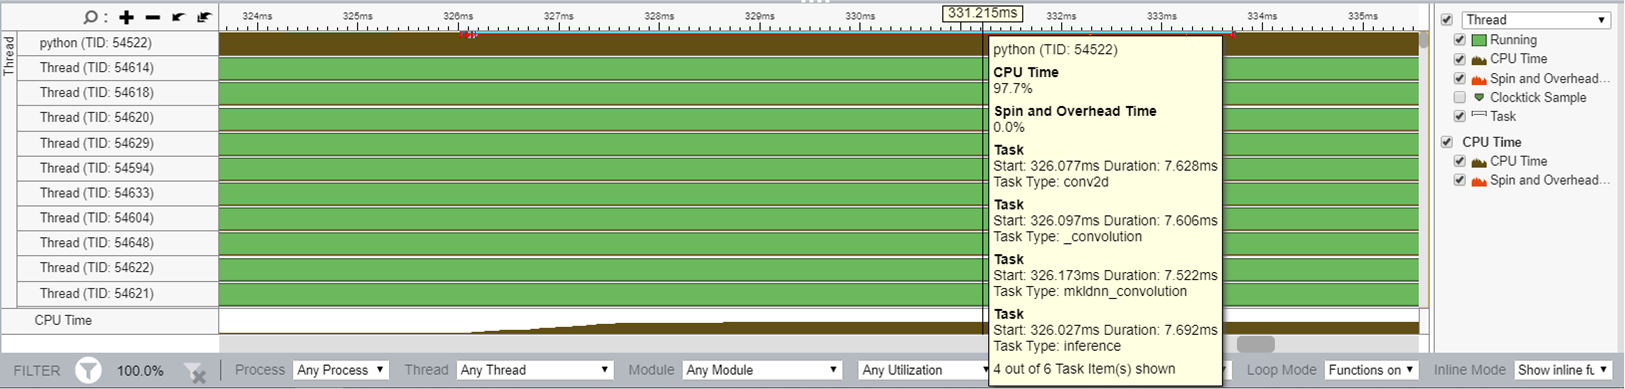
The instrumentation and tracing technology (ITT) APIs of Intel® VTune Profiler enables application to generate and control the collection of trace data during its execution. ITT provides scoped timer and visualizes your program execution in OP/function/sub-function granularity. By applying the API functions on executed ops, we can get performance visualization on individual PyTorch ops. From the following screenshot we can see CPU usage on each op, like the conv2d in this example. This will be helpful for op-level tuning.
Upon existing op level profiling, users can annotate a scope of multiple ops to have a higher level understanding of performance manually.
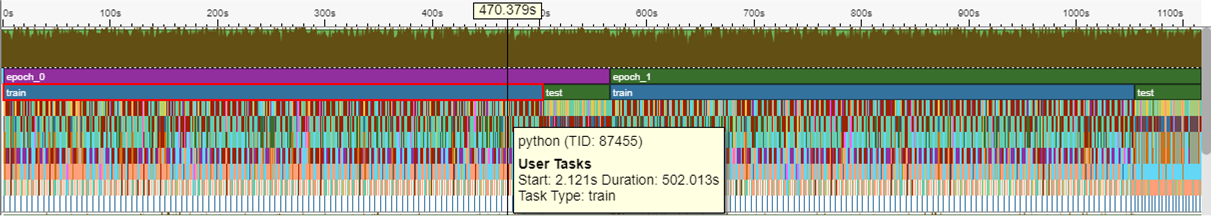
In the following screenshot of ResNet50 profiling result, each epoch, with train step and test step inside, is shown in timeline graph. Also, it is very clear to see how long was spent on train step, how long was spent on test step.
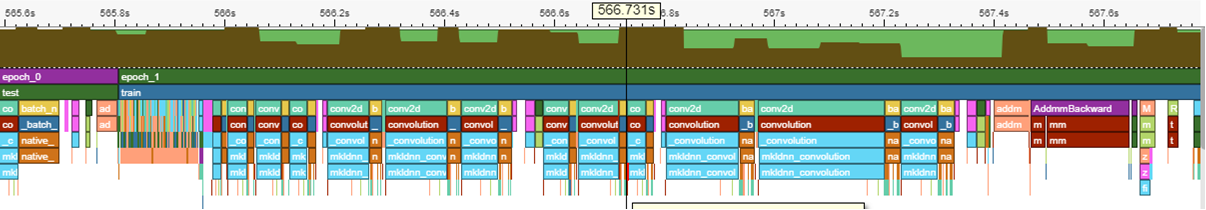
We can also expand this timeline graph to see profiling results with more details, in case users need to track how individual ops got invoked in their topologies.
Pitch
Alternatives
Additional context
cc @VitalyFedyunin @ngimel
The text was updated successfully, but these errors were encountered: