classification-type shape files #16380
Comments
|
Author Name: Giovanni Manghi (@gioman) Not really sure I have understand this issue... anyway do you have a link to sample data or can you attach some? then can you explain again the issue please? thanks.
|
|
Author Name: Giovanni Manghi (@gioman) Please also specify what QGIS version are you using. |
|
Author Name: Nathan Woodrow (@NathanW2) Isn't this just the Categorized or Graduated renderer in QGIS? If not can you post a sample dataset and a image of what you need to achieve. |
|
Author Name: John Sankey (John Sankey) "Categorized or Graduated renderer in QGIS?" Sample data is at |
|
Author Name: Nathan Woodrow (@NathanW2) |

|
Author Name: John Sankey (John Sankey) Found it, Nathan, clicked classify and it shows a range of colours matching the values in the window, but clicking apply then OK doesn't show anything. Do I have to 'add class' or do something else to make it work? There's nothing in the manual about it except to say it exists... |
|
Author Name: Giovanni Manghi (@gioman) John Sankey wrote:
did you choose a proper attribute to make the classification? |
|
Author Name: John Sankey (John Sankey) attribute?
|
|
Author Name: Giovanni Manghi (@gioman) John Sankey wrote:
in a GIS an attribute is a column of the table that is associated to any vector. To classify your vectors you need to choose an attribute. |
|
Author Name: John Sankey (John Sankey) Fair enough, Giovanni, but I should clarify: where do I choose an attribute? I can't find anything called that in layer properties; under Column there's only one option, shown. My apologies for sounding dense, but I don't know QGIS backwards and forwards the way you do... |
|
Author Name: Giovanni Manghi (@gioman) John Sankey wrote:
try have a look here http://docs.qgis.org/html/en/docs/user_manual/working_with_vector/vector_properties.html#style-tab "Categorized Renderer" |
|
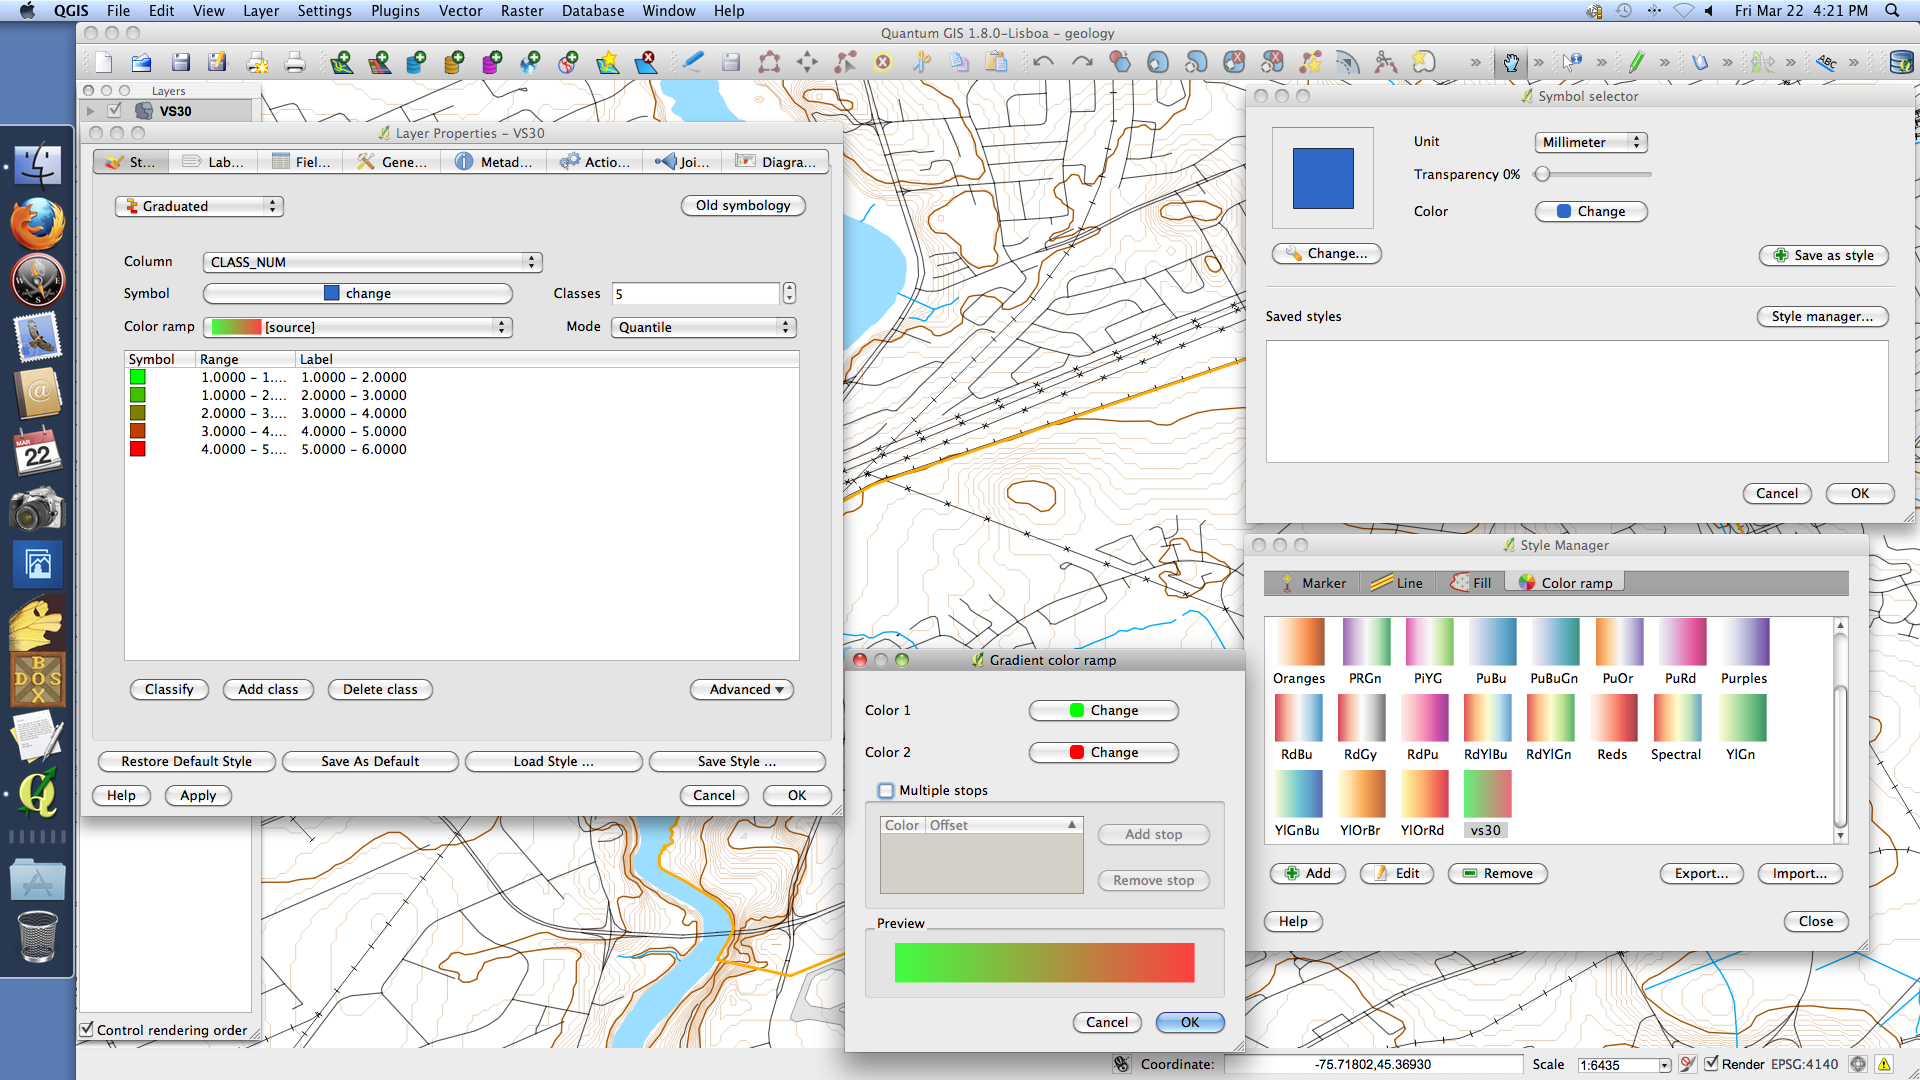
Author Name: John Sankey (John Sankey) Giovanni, I've gone through the manual, at least three times. I've saved a graduated style from the layer properties window with a name. I then click on symbol change; the style I just saved isn't listed on the symbol selector window under saved styles. There's nothing about selecting a style in the simple fill dialog either, which is where I want the renderer to use the saved style. If I open the style manager in the symbol selector window, it shows the style I've saved, but nothing I've tried has applied it to the simple fill symbol. Might this be a directory problem, that I've saved the style in the subdirectory where the .shp file is, and the .qgs file is in a different directory? There's obviously some connection I'm missing between style and symbol. Is layer style somethiing different from symbol style, perhaps? |
|
Author Name: John Sankey (John Sankey) here are the windows.
|
|
Author Name: Nathan Woodrow (@NathanW2) You don't need to split the layer. I'll download the sample data and have a look. |
|
Author Name: Nathan Woodrow (@NathanW2) Looks fine to me |

|
Author Name: John Sankey (John Sankey) Lovely! I tried a new project and everything shows fine. It seems that this data is referenced to UTM zone 18N, all the CanVec data is WGS83, and that QGIS 1.8.0 can't show two different CRS's in the same project. All my previous tries I was adding to an existing CanVec-based project so this one didn't show; when I try adding CanVec data to this new project none of it shows. I'd rather work in UTM zone 18N, but enabling CRS on-the-fly crashes QGIS 1.8.0 |
|
Author Name: Nathan Woodrow (@NathanW2)
|
|
Author Name: Nathan Woodrow (@NathanW2) You can change the projection of a layer by using the Save As.. item in the right click menu on the layer. In the dialog you can select a output projection. |
Author Name: John Sankey (John Sankey)
Original Redmine Issue: 7416
Canada is rapidly issuing all their census and geological information as .shp files with binary values - an unbelievable amount of open data. Show Discrete Values shows the values, say 1-5, and QGIS recognizes them as polygon layers, but doesn't show anything when the shapefiles are imported.
The rendering expected is 1 to >2 is one colour, 2 to >3 another... They aren't monotonic e.g. a region 5 can be completely surrounded by level 1 because they're classifications, not land elevations.
I'm told this is how ArcView handles them:
For Canadians, this is rapidly turning into a must-have. I hope providing this capability can be treated as higher priority than wibnis.
The text was updated successfully, but these errors were encountered: