Error with the classic world map example #526
Comments
|
Thanks for opening the issue @jguelat. You can fix the grid issue by using library(tmap)
data("World", "land", "rivers", package = "tmap")
m2 <- tm_shape(land) +
tm_raster("elevation", breaks = c(-Inf, 250, 500, 1000, 1500, 2000, 2500, 3000, 4000, Inf),
palette = terrain.colors(9), title = "Elevation (m)") +
tm_shape(rivers) +
tm_lines("lightblue", lwd = "strokelwd", scale = 1.5, legend.lwd.show = FALSE) +
tm_shape(World, is.master = TRUE) +
tm_borders("grey20", lwd = .5) +
tm_graticules(labels.size = 0.4, lwd = 0.25) +
tm_text("name", size = "AREA") +
tm_compass(position = c(0.08, 0.45), color.light = "grey90", size = 3) +
tm_credits("Eckert IV projection", position = c("RIGHT", "BOTTOM")) +
tm_style("classic",
bg.color = "lightblue",
space.color = "grey90",
inner.margins = c(0.04, 0.04, 0.03, 0.02),
earth.boundary = TRUE) +
tm_legend(position = c("left", "bottom"),
frame = TRUE,
bg.color = "lightblue")
m2Created on 2020-11-18 by the reprex package (v0.3.0) |

|
@jguelat temporary solution is to use library(tmap)
data("World", "land", "rivers", package = "tmap")
m2 <- tm_shape(land, raster.warp = FALSE) +
tm_raster("elevation", breaks = c(-Inf, 250, 500, 1000, 1500, 2000, 2500, 3000, 4000, Inf),
palette = terrain.colors(9), title = "Elevation (m)") +
tm_shape(rivers) +
tm_lines("lightblue", lwd = "strokelwd", scale = 1.5, legend.lwd.show = FALSE) +
tm_shape(World, is.master = TRUE) +
tm_borders("grey20", lwd = .5) +
tm_graticules(labels.size = 0.4, lwd = 0.25) +
tm_text("name", size = "AREA") +
tm_compass(position = c(0.08, 0.45), color.light = "grey90", size = 3) +
tm_credits("Eckert IV projection", position = c("RIGHT", "BOTTOM")) +
tm_style("classic",
bg.color = "lightblue",
space.color = "grey90",
inner.margins = c(0.04, 0.04, 0.03, 0.02),
earth.boundary = TRUE) +
tm_legend(position = c("left", "bottom"),
frame = TRUE,
bg.color = "lightblue")
m2Created on 2020-11-18 by the reprex package (v0.3.0) |

|
Thanks for having a look at it! Your solution seems to work but the plotting is slower when using The fix with tm_graticules (instead of tm_grid) works well as long as I plot the map by calling m2. Instead, if I try to save the map using the code from the vignette: The error is gone if I slightly adjust the outer.margins (like |
|
The raster issue: apparently,
The |
|
@edzer do you have any idea? |
|
Looks like collateral damage from r-spatial/mapview#256 |
|
Should work now! |
|
Thanks a lot !!! |
# version 0.5-3

* `read_stars()` accepts a function (or list with functions) as first argument,
   allowing for saving `stars` objects that read from package directories resolving
   platform-dependent paths at run-time

* handle categorical rasters starting at value 0 (by adding 1, and warning); #428

* add `%in%` method; #424

* `read_stars` gains an argument `tolerance` to control tolerance in
  dimension value comparisons; #414

* binary Ops (like `+`, `-`, `*` etc.) work for `stars_proxy` objects; #390

* `st_rasterize` rasterizes multiple attributes, and handles factors
  (when sf >= 0.9-9)

* `write_stars` deals better with `stars_proxy` objects; #404

* fix regression in reading some `stars_proxy` objects; #379

* add `[<-` (partially) and `is.na` methods for `stars_proxy` objects; #402

* add `replace_na` methods; #402

# version 0.5-2

* read and write factor levels as GDAL category names; write color table; #392

* handle `normalize_path` for choosing to `proxy`; #391

* ignore units when there are different units accross bands of a subdataset

* speed up `st_rgb` using faster `st_apply` approach; #315, #390

* improve handling of crs in Spatial objects (avoid loss of wkt comments)

* correctly write band subsets for smaller proxy objects; #291

* write arbitrarily cropped proxy objects; #291

* speed up `st_apply` when a function is provided that works on chunks
  at a time; #390

* warn when breaks = "quantile" results in a single class; #388

* fix `[` bug selecting bands in proxy objects; #388

* for `stars_proxy` objects, `write_stars` writes all objects into a
  multi-layer file; #385

* multi-file proxy objects can be `st_warp`ed with `use_gdal = TRUE`; #385

# version 0.5-1

* fix weird GDAL-related bug in stars2 vignette

* `read_ncdf` does not take time as mid-points of regular intervals,
  but as starting points; #378

# version 0.5-0

* fix handling of rasters with color tables; #375

* `st_apply` and other methods for `stars_proxy` objects handle ... ; #374

* add `st_bbox`, `st_crs` methods for terra's `SpatVector` objects;
  https://github.com/mtennekes/tmap/issues/536

* add `st_bbox`, `st_crs` and `st_as_stars` methods for terra's
  `SpatRaster` objects; https://github.com/mtennekes/tmap/issues/536

* allow for multi-resolution attributes in `stars_proxy` objects
  (e.g., all gray scale sentinel-2 bands); see vignettes 2 and 7 for
  examples.

* `plot` defaults to a categorical color scale when plotting a factor
  variable; https://github.com/mtennekes/tmap/issues/526

* `st_extract` extracts space-time points if `time_column` is
  specified, and handles time intervals; #352

* add `[[<-.stars` method, which is now called by `$<-.stars`, so that
  array names can be set programmatically

* add `transmute` methods

* `plot.stars` calls `droplevels` if a factor array has any `NA` levels; #339

* `read_stars` reads `NaN`s as `NA`; #333

* improve `st_extract` method for both `stars` and `stars_proxy`
  objects; interpolation options are reduced to bilinear; #322, #279,
  #290

* better handle categorical rasters that do not start at value 1; #329

* plot layout can be controlled with `mfrow = c(nr, nc)` argument

* `stars_proxy` objects have a normalized path; #331

* cropping or selecting with `bbox` treats cells always as small
  polygons; #330

* add faster `st_extract` method for `stars` objects; #322

* added vignette: "How `raster` functions map to `stars` functions",
  by Sebastien Rochette; #122, #325

* fix bug in dimension `values` field when downsampling; #324

* `write_stars` also writes out band names; #323

* add `rgdal` to Suggests:

* each `call_list` entry of a `stars_proxy` object carries its proper
  calling environment; #309

* `st_as_sf.stars` copes with zero attribute (empty) stars objects

* add `st_set_bbox` generic, to set raster extent, motivated by #315

* set up tic, with great help from @pat-s, #313

* get rid of more `proj4string`s for representing coordinate reference
  systems; #312

* as(x, "Spatial") correctly handles `from` dimension values different
  from one

* `read_stars` now sets the `BANDNAME` GDAL metadata item, or else the
  band's GetDescription() as the band's dimension values

* `st_as_stars.data.frame` reads simple tables (non-raster data) if
  `dims` has length less than 2

* band descriptions are in the band dimension values

* dimension tables are simpler, and are shown properly in Rstudio

* `st_rgb` gains a `probs` argument, to cut off and stretch based on
  quantiles

* `as(x, "Raster")` merges multiple attributes before converting to
  raster brick
I'm trying to reproduce the classic world map example and found 2 issues. I'm using the following code (from the vignette):
First I'm getting the following error when trying to save the map:
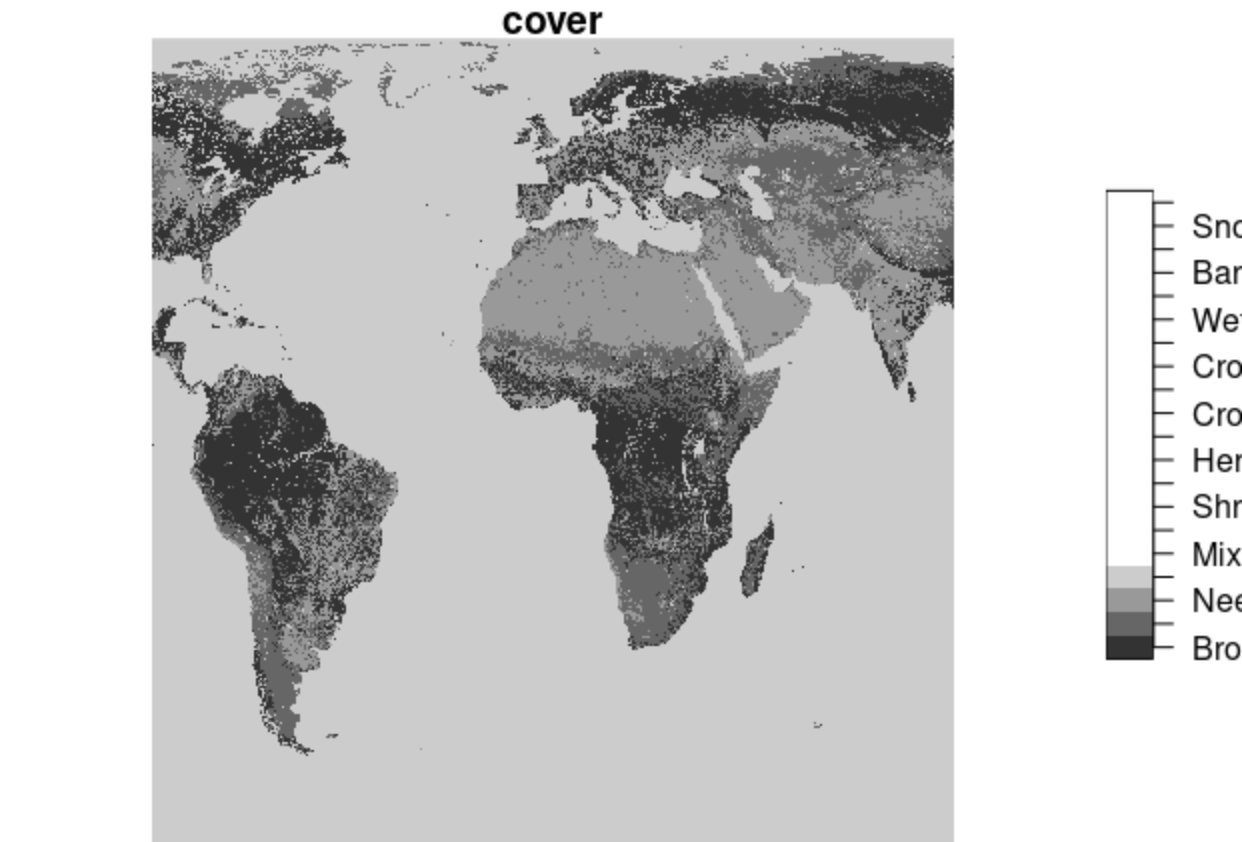
Error in st_crs.character(grid.projection) : invalid crs: longlatI managed to save the map after removing the line with "tm_grid", however the elevation layer is then cropped (see attached png).
The text was updated successfully, but these errors were encountered: