ImAxes is an immersive data visualisation tool for multidimensional data exploration and analysis in virtual reality. link to the original paper


From a CSV/TSV spreadsheet, build and explore multivariate/multidimensional data in Virtual Reality.
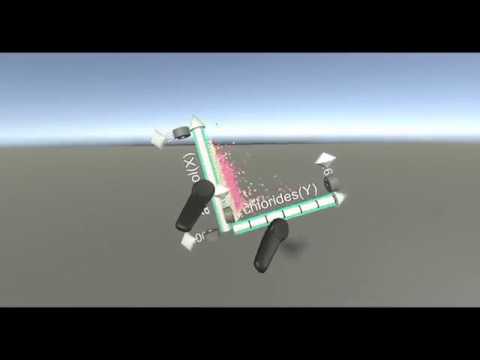
Here is a video demo of ImAxes:
ImAxes comes as a Unity project. You only need to download the latest Unity 5.6
** << Udpate >> : Now ImAxes works with Unity 2018!! check it out: https://github.com/MaximeCordeil/ImAxes/tree/ImAxes2018 big thanks to our student Benjamin Lee for this **
ImAxes works on Windows PCs. You will need a solid gaming configuration, i.e. an Intel i7 processor and an Nvidia 10xx VR-ready graphics card.
The HTC Vive and Microsoft-compatible MR devices, and the Oculus Rift CV1 with Oculus touch controllers are currently supported.
ImAxes allows you to load data with a CSV or a TSV file format. The CSV/TSV dataset file:
- must be clean! if you have an empty line, or a line with incorrect data values, ImAxes is very likely to throw parsing exceptions
- should not exceed 65,534 entries
Your dataset file should look like this:

Each column corresponds to a dimension of the data. Once you have launched ImAxes you will see the corresponding dimensions as virtual axes in space like this:

The project contains two template scenes:
- a ViveScene, to be used with the HTC Vive and Mixed-Reality compatible devices
- an OculusTouchScene, to be used with the Oculus CV1 and Oculus Touch controllers
Both scenes have a SceneManager Unity gameobject in the hierarchy. Click this object [1] and in the inspector window, you can drag and drop your CSV/TSV file into the Source Data field [2]. You can also create a metadata file for your dataset and drag and drop it into the Metadata field.

The metadata file is used to specify the data binning for the histograms corresponding to each data dimension. It is optional and if you do not create one the histograms will have default bins.
To create a metadata file:
- Right click in the editor (e.g. under Datasets/) and select ImAxes> Data Object Metadata

- Name your metadata file (e.g. datasetname-metadata)
- Click on the file
- In the inspector specify the numbers of bins in the Size field (it corresponds to the number of dimensions in your dataset)
- Populate each Element i (i: 0 -> nbDimensions-1) bin with the desired bin size for the dimension
Once you have attached a clean CSV/TSV file to the SceneManager (and optionnally a metadata file), you can run ImAxes in the editor by simply clicking the play button.
You can build and launch the HTCVive or the OculusTouch scene. Make sure you have attached the dataset file in the SceneManager gameobject.
Visualisations are created by pulling out axes from the axes shelf and by assembling them in space:
- Hold 2 axes parallel to each other, you get a parallel coordinate.
- Make 2 axes perpendicular and connect the ends, you get a 2D scatterplot
- Add a third perpendicular axis, you get a 3D scatterplot
- Extend visualisation by adding more axes and you will obtain matrices
- Place visualisations close to each other to connect them
Check the video to learn the interactions.
Press the Menu button on the HTC vive controller (or you Mixed-realiy device) and you will see this menu popup.
[image menu]
You can change the color scheme:
- bind a palette to a categorical dimension
- bind a gradient color (change min/max colors) to a continuous variable
[image menu]
You can change the visualisation style:
- If you have a time series dataset (or a trail set dataset) and your data are ordered properly by id in the CSV/TSV source file, you can change the visualisation to show connected dots like this: [image menu]
This is a beta version of ImAxes, it means that it is not bug-free and does not contain all the data visualisation features for now. We plan to:
- Add menu in the Oculus Touch scene
- Make ImAxes work with Unity 2017.x
- Make ImAxes collaborative (multi user)
- Have a generic version for a variety of Mixed Reality devices (e.g. Hololens, Meta 2...)
- Make ImAxes work with (multivariate) graph data
- Integrate map visualisations
- Add data selection interaction
- Better handling of dataset loading in built versions
- Integrate more control over color mapping: choose color palette / colors in the palette
- Save the scene and visualisation configuration
If you plan to use this software for publication, please cite the paper:
@inproceedings{Cordeil:2017:IIA:3126594.3126613, author = {Cordeil, Maxime and Cunningham, Andrew and Dwyer, Tim and Thomas, Bruce H. and Marriott, Kim}, title = {ImAxes: Immersive Axes As Embodied Affordances for Interactive Multivariate Data Visualisation}, booktitle = {Proceedings of the 30th Annual ACM Symposium on User Interface Software and Technology}, series = {UIST '17}, year = {2017}, isbn = {978-1-4503-4981-9}, location = {Québec City, QC, Canada}, pages = {71--83}, numpages = {13}, url = {http://doi.acm.org/10.1145/3126594.3126613}, doi = {10.1145/3126594.3126613}, acmid = {3126613}, publisher = {ACM}, address = {New York, NY, USA}, keywords = {immersion, immersive analytics, immersive visualization, information visualization, multidimensional data visualization, virtual reality}, }
ImAxes is mainly designed and developped by Maxime Cordeil (Monash University) and Andrew Cunningham (University of South Australia). Benjamin Lee is now a contributor.
Contributors: ImAxes an Immersive Analytics collaborative research project with
- Assoc. Prof Tim Dwyer, Prof. Kim Marriott (Monash University)
- Prof. Bruce H. Thomas (University of South Australia).