Shows all applications deployed to foundation (or your login has visibility to see).
The information provided includes app CPU and memory usage, number of requests and response
time of app.
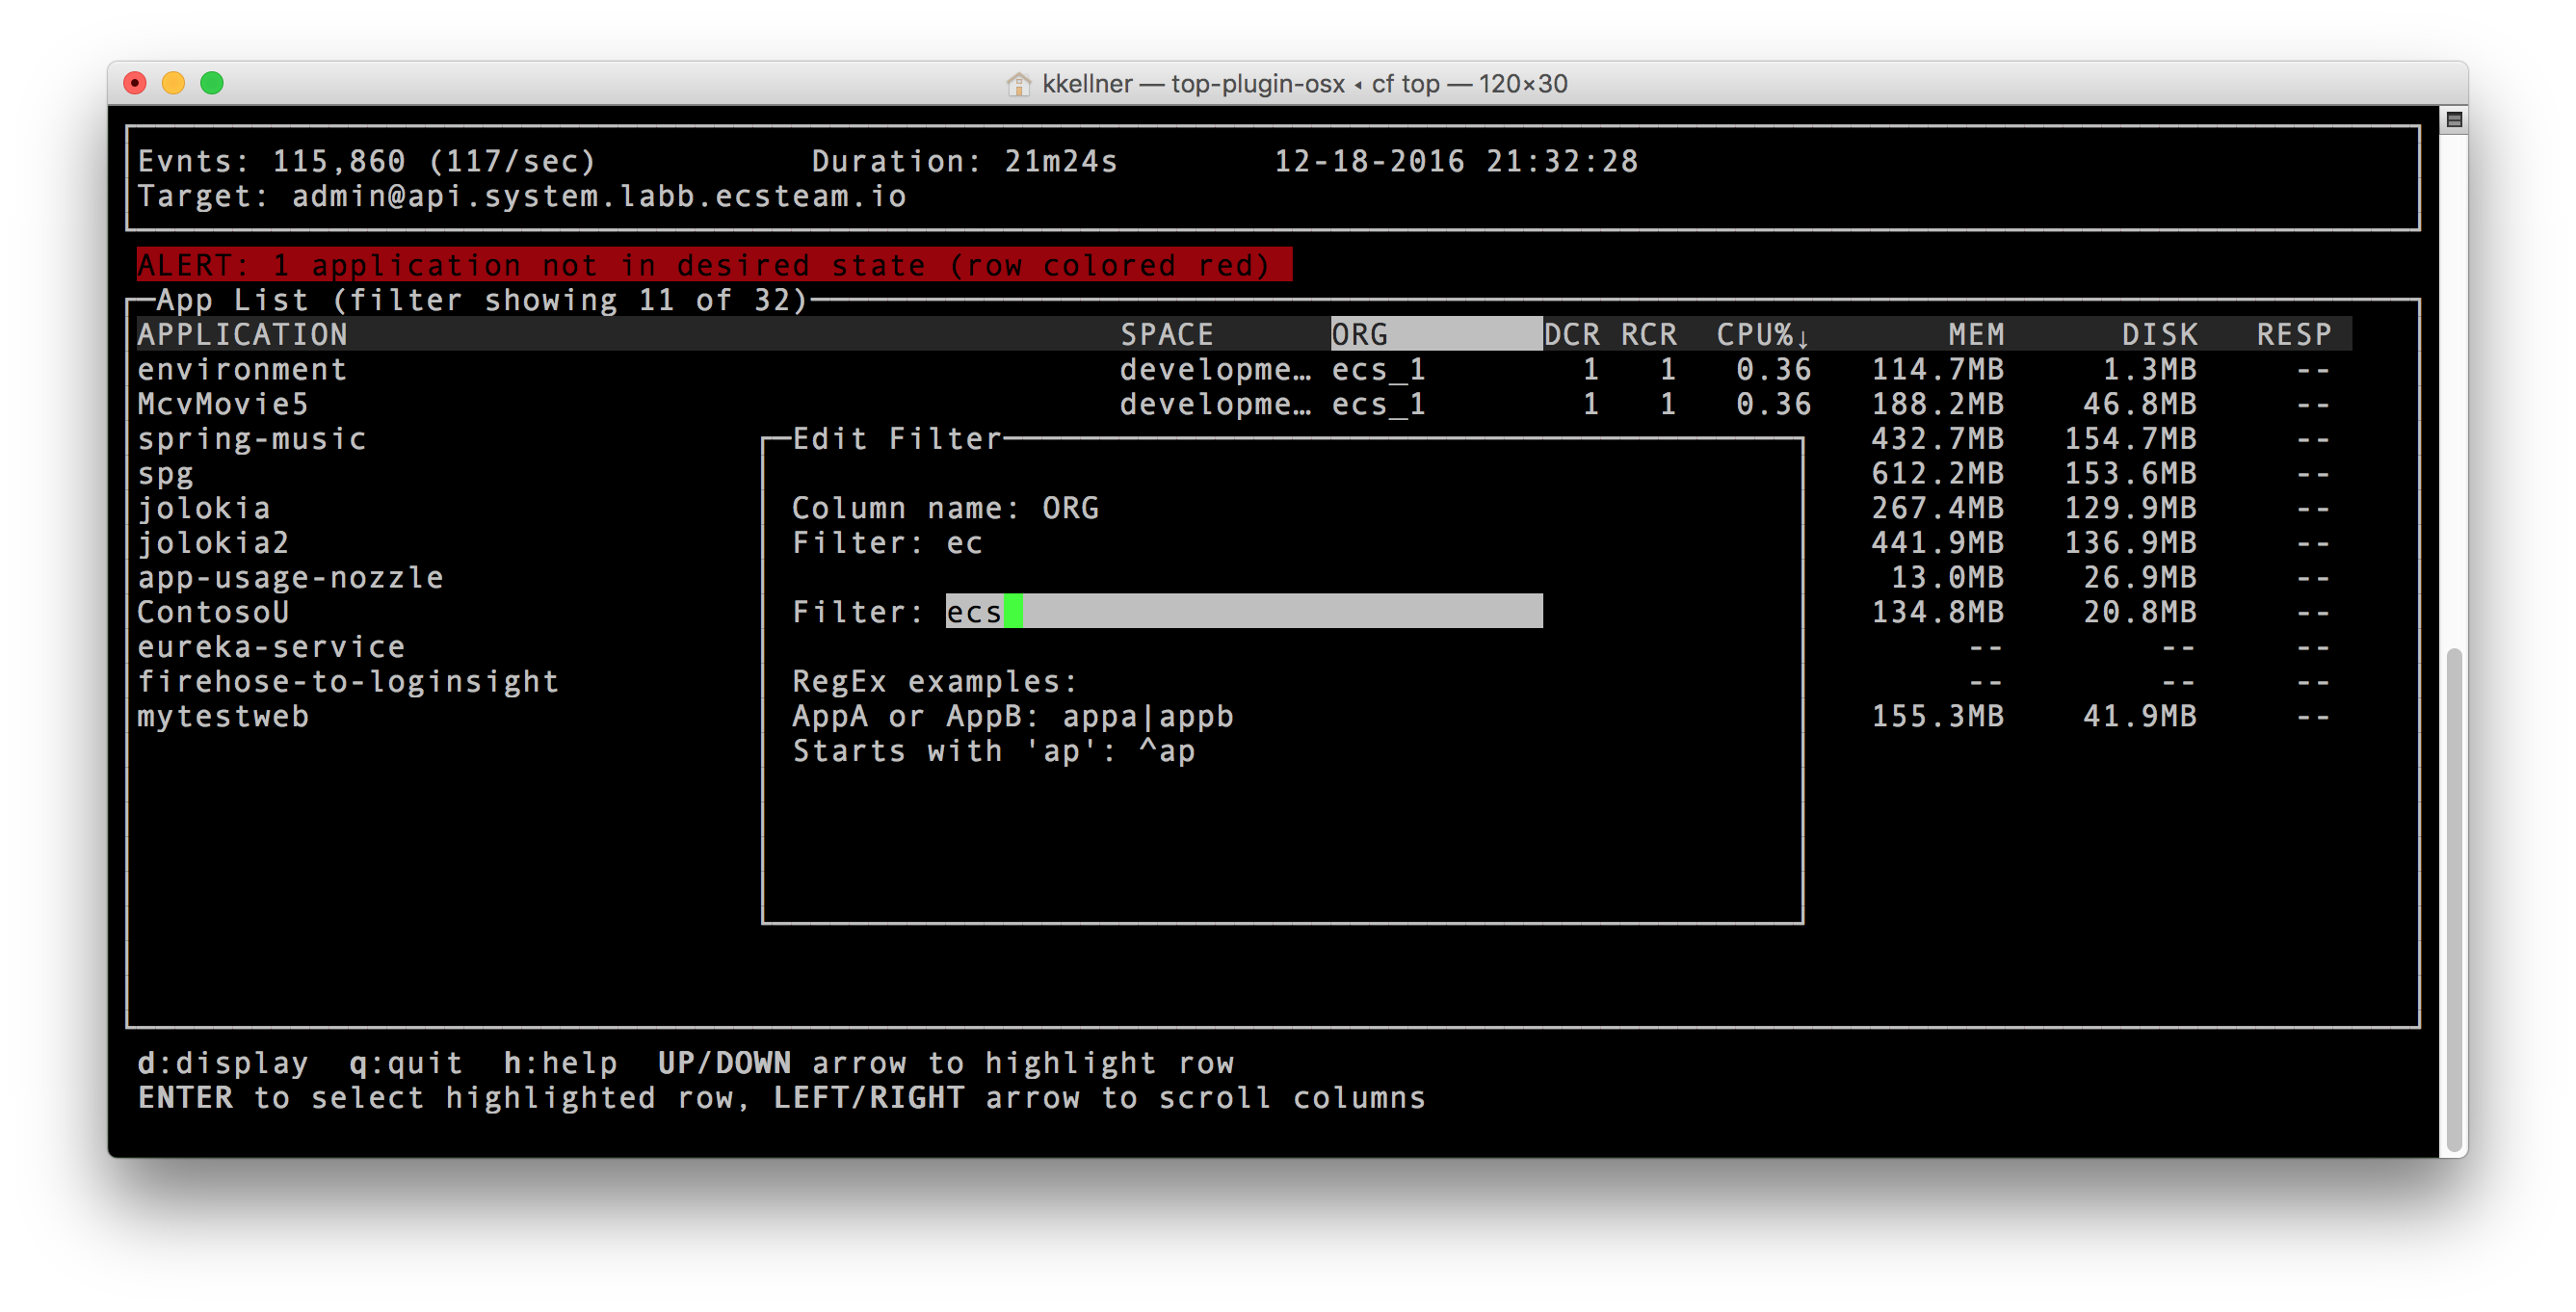
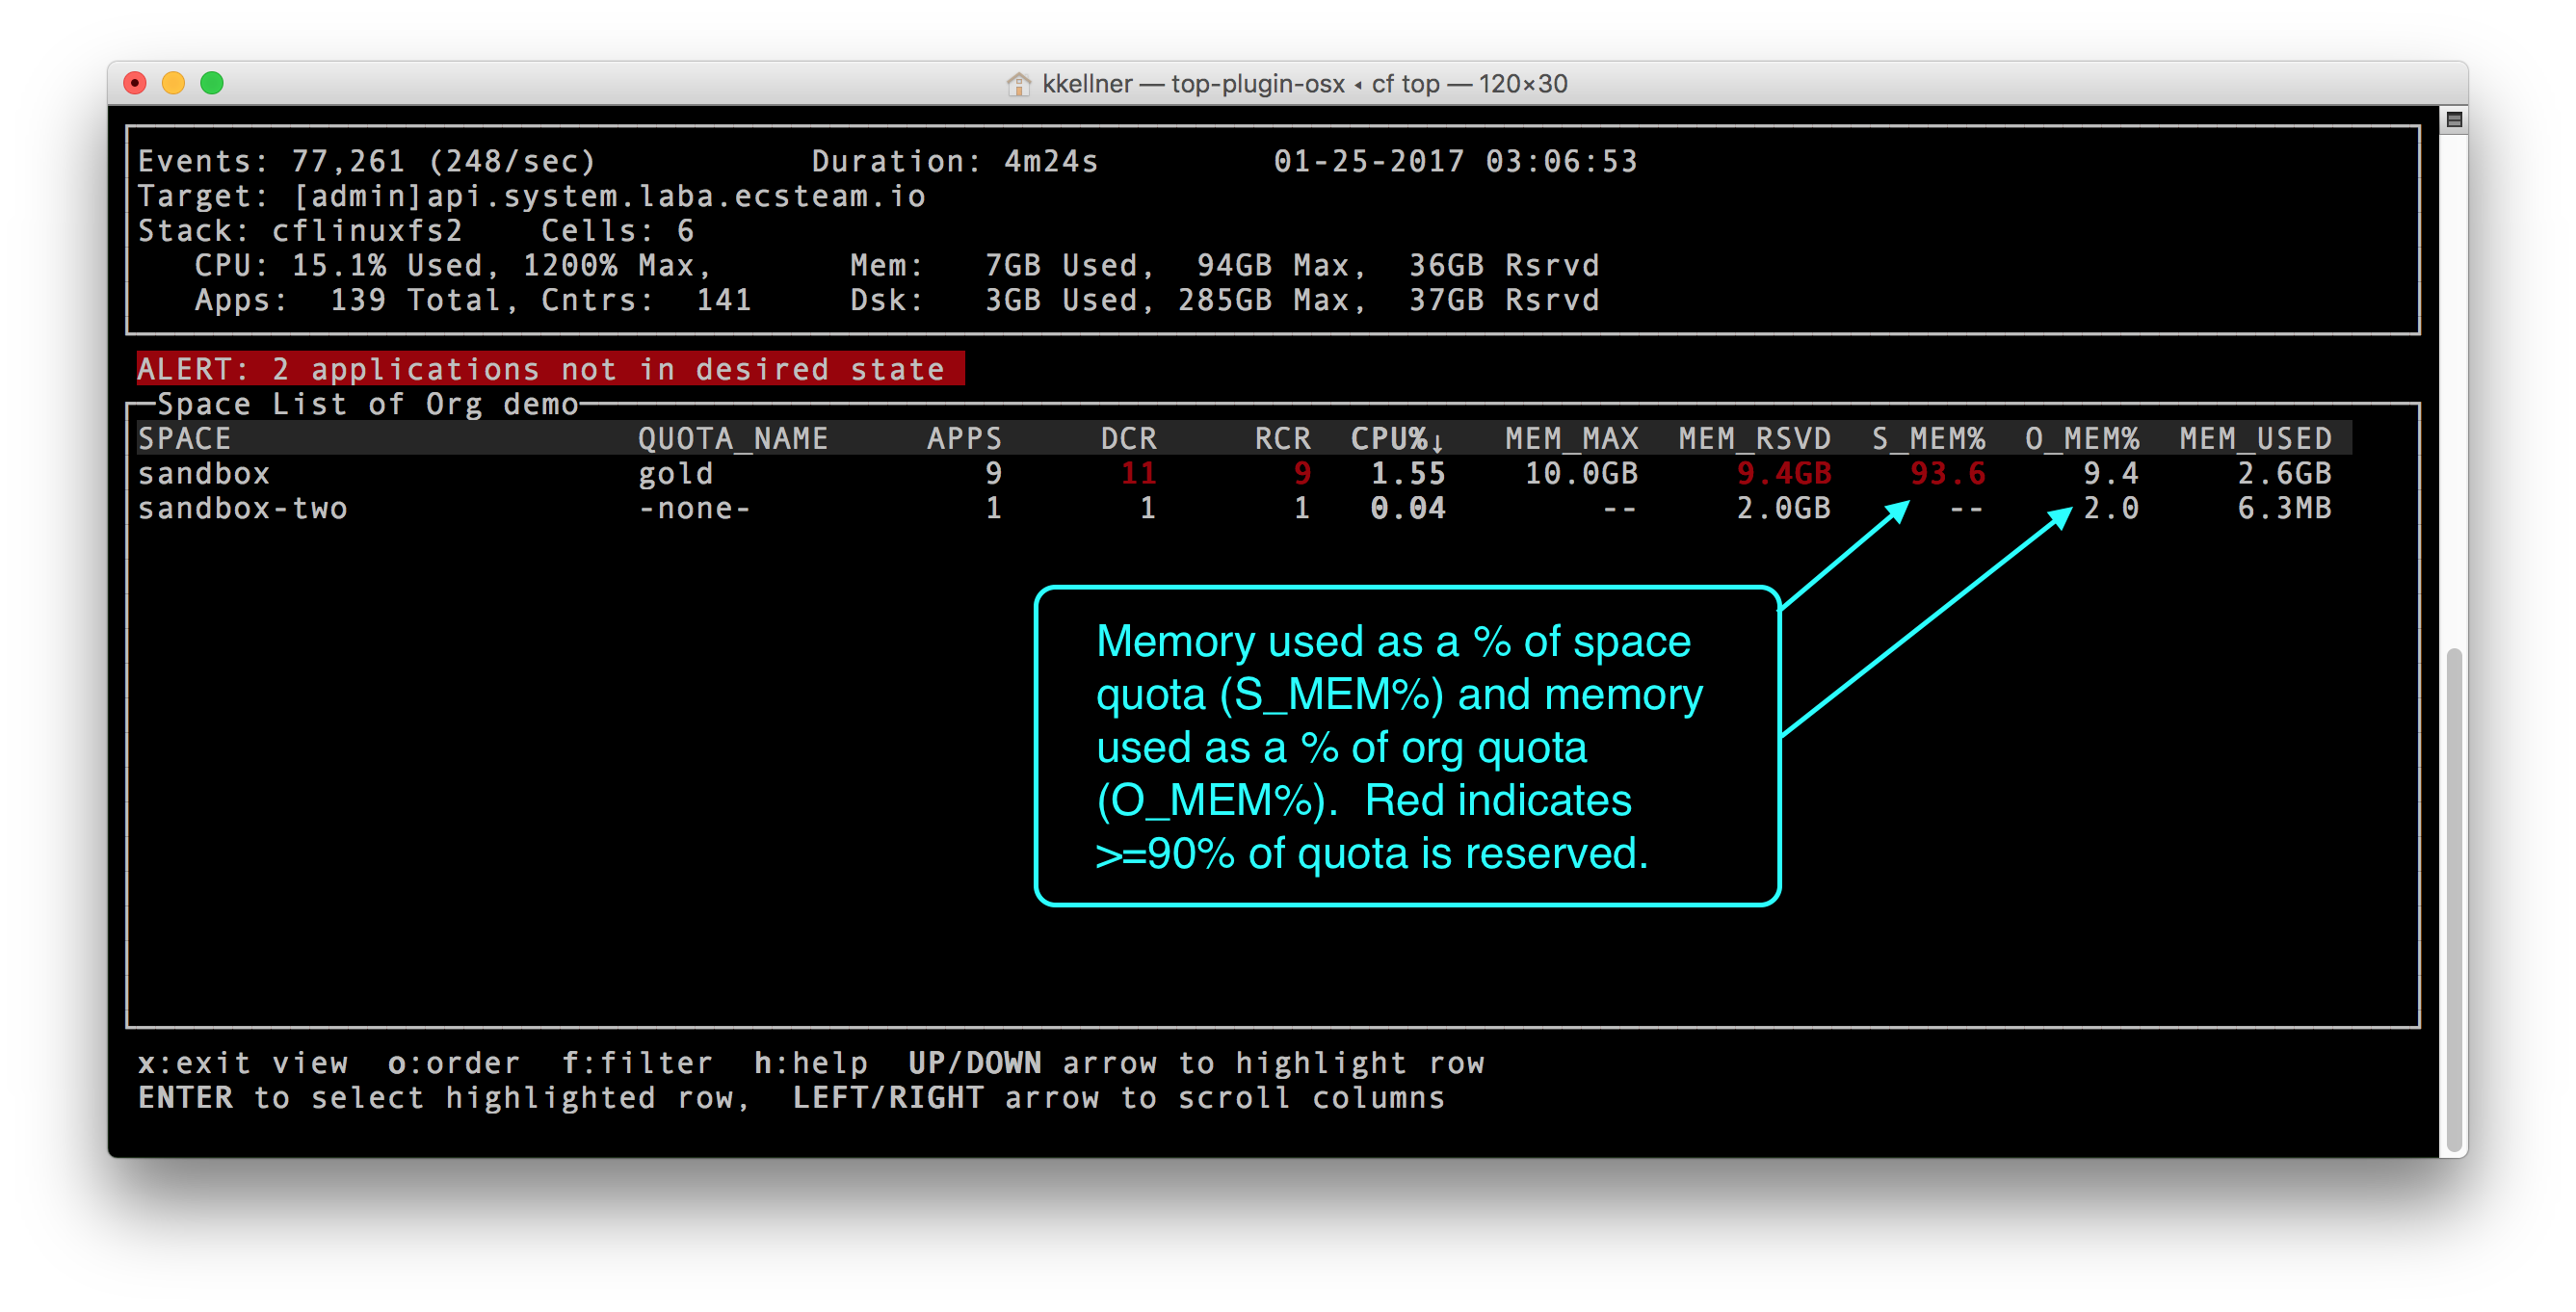
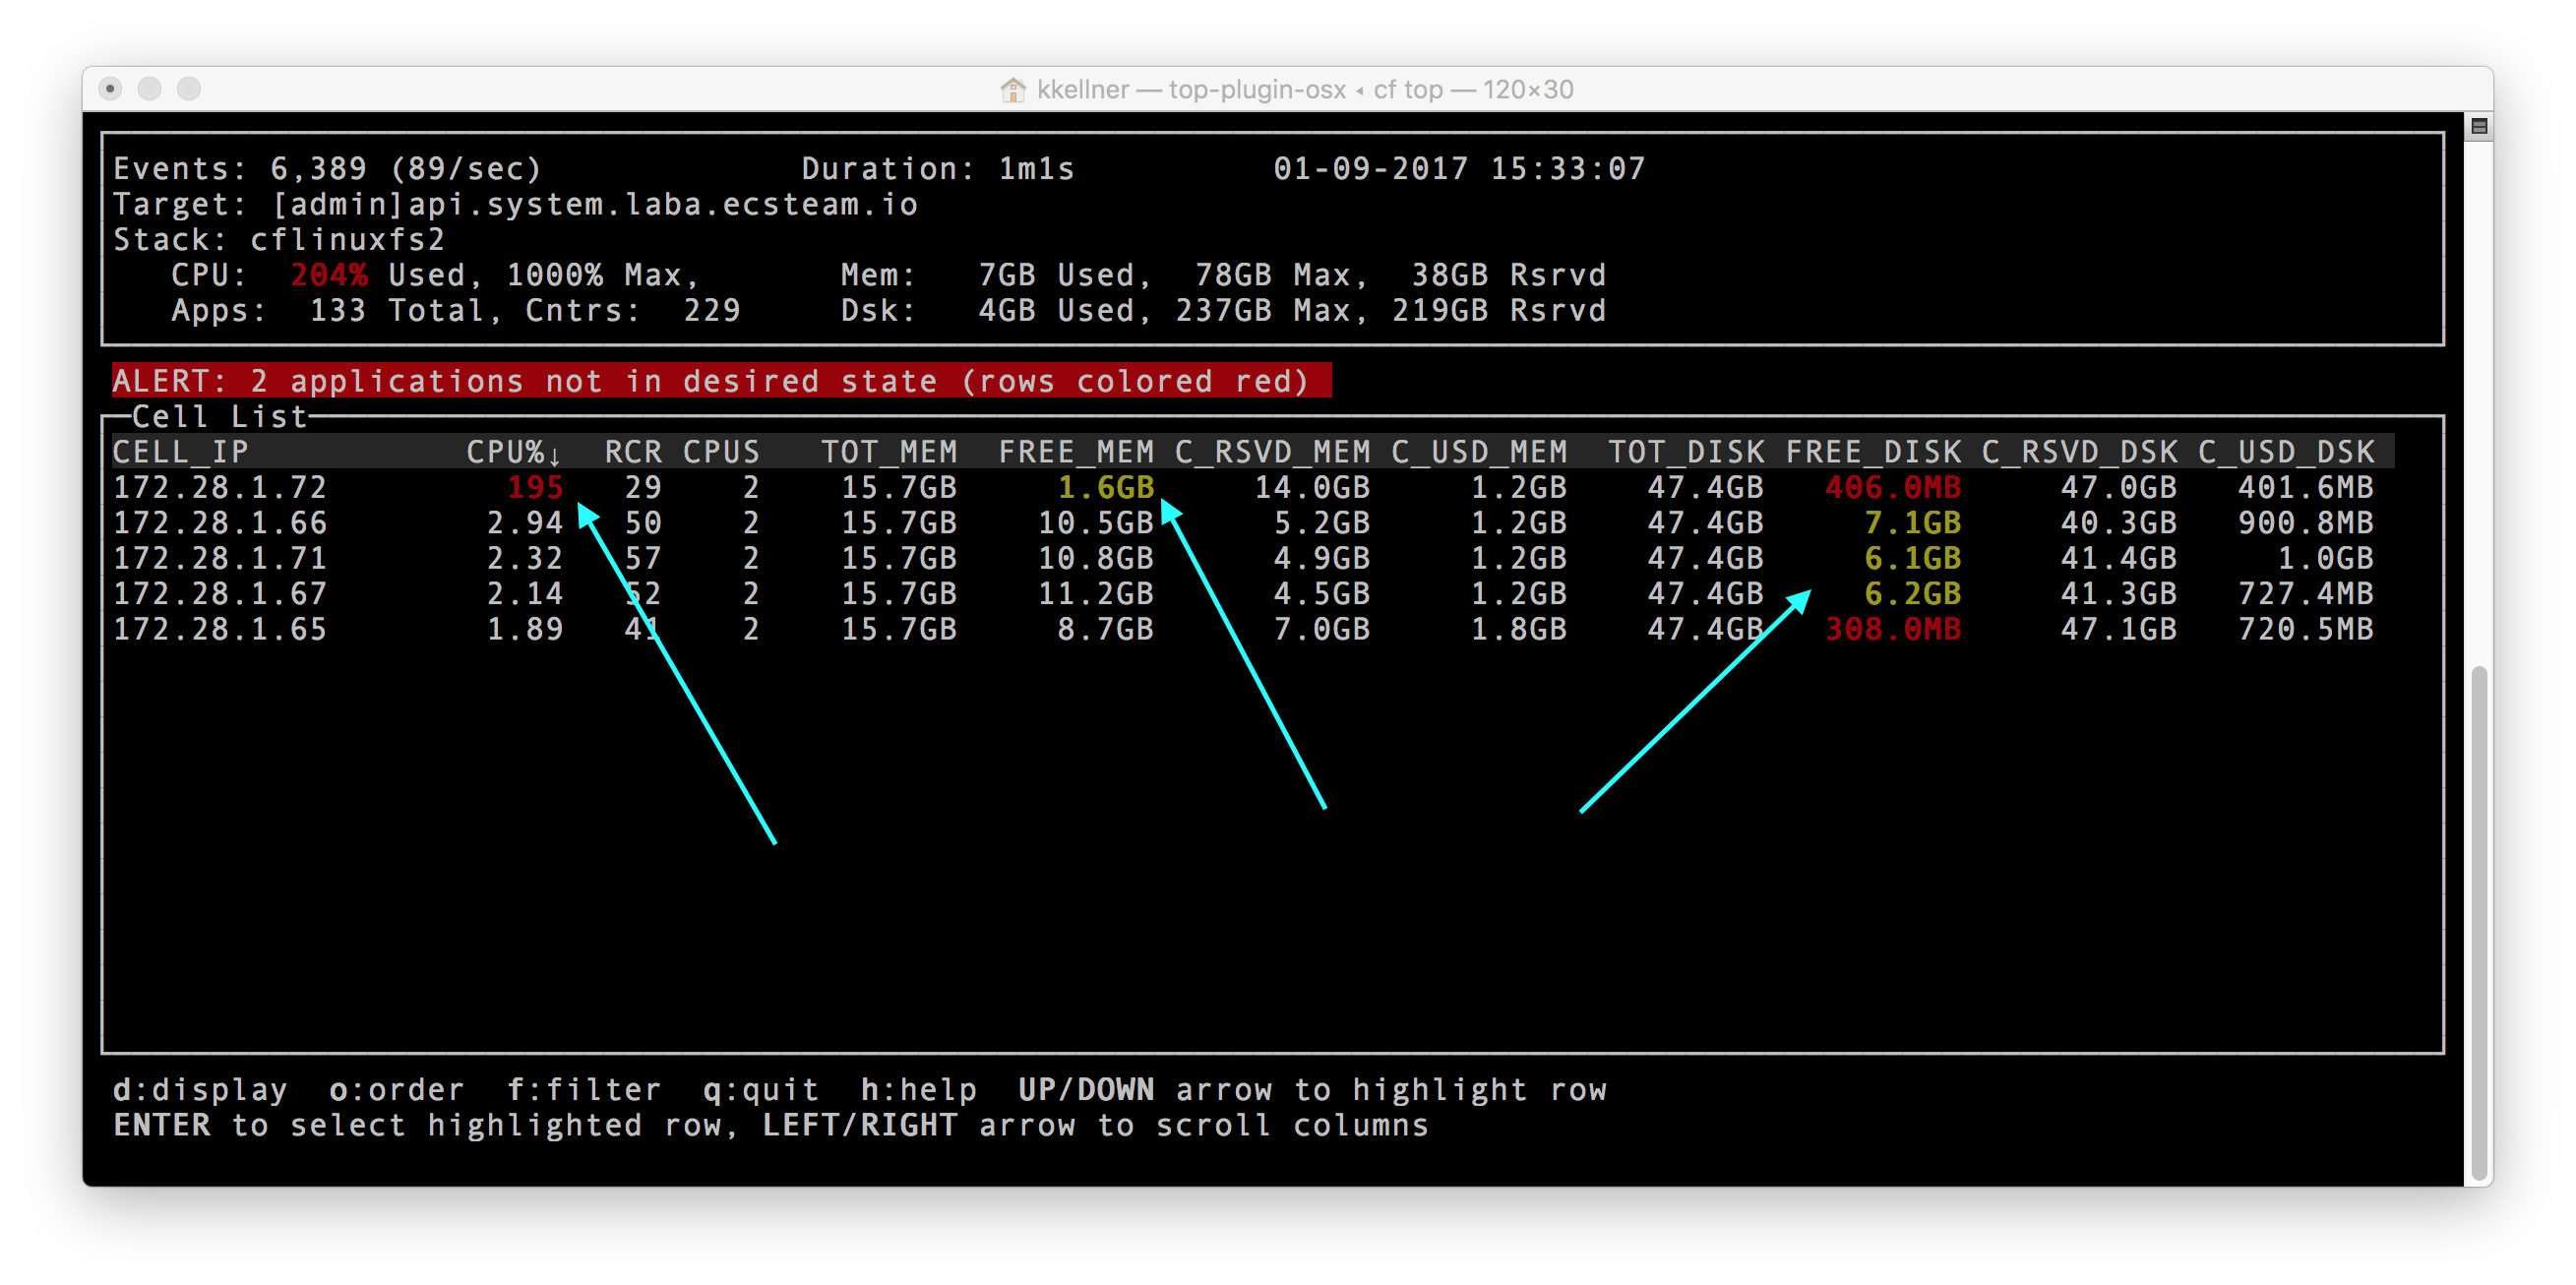
This is useful for finding the "top" CPU consumer on the foundation. This screenshot
also shows an alert:

Top supports displaying data from multiple stacks. This screenshot shows a foundation that has both cflinuxfs2 and windows2012R2 cells.
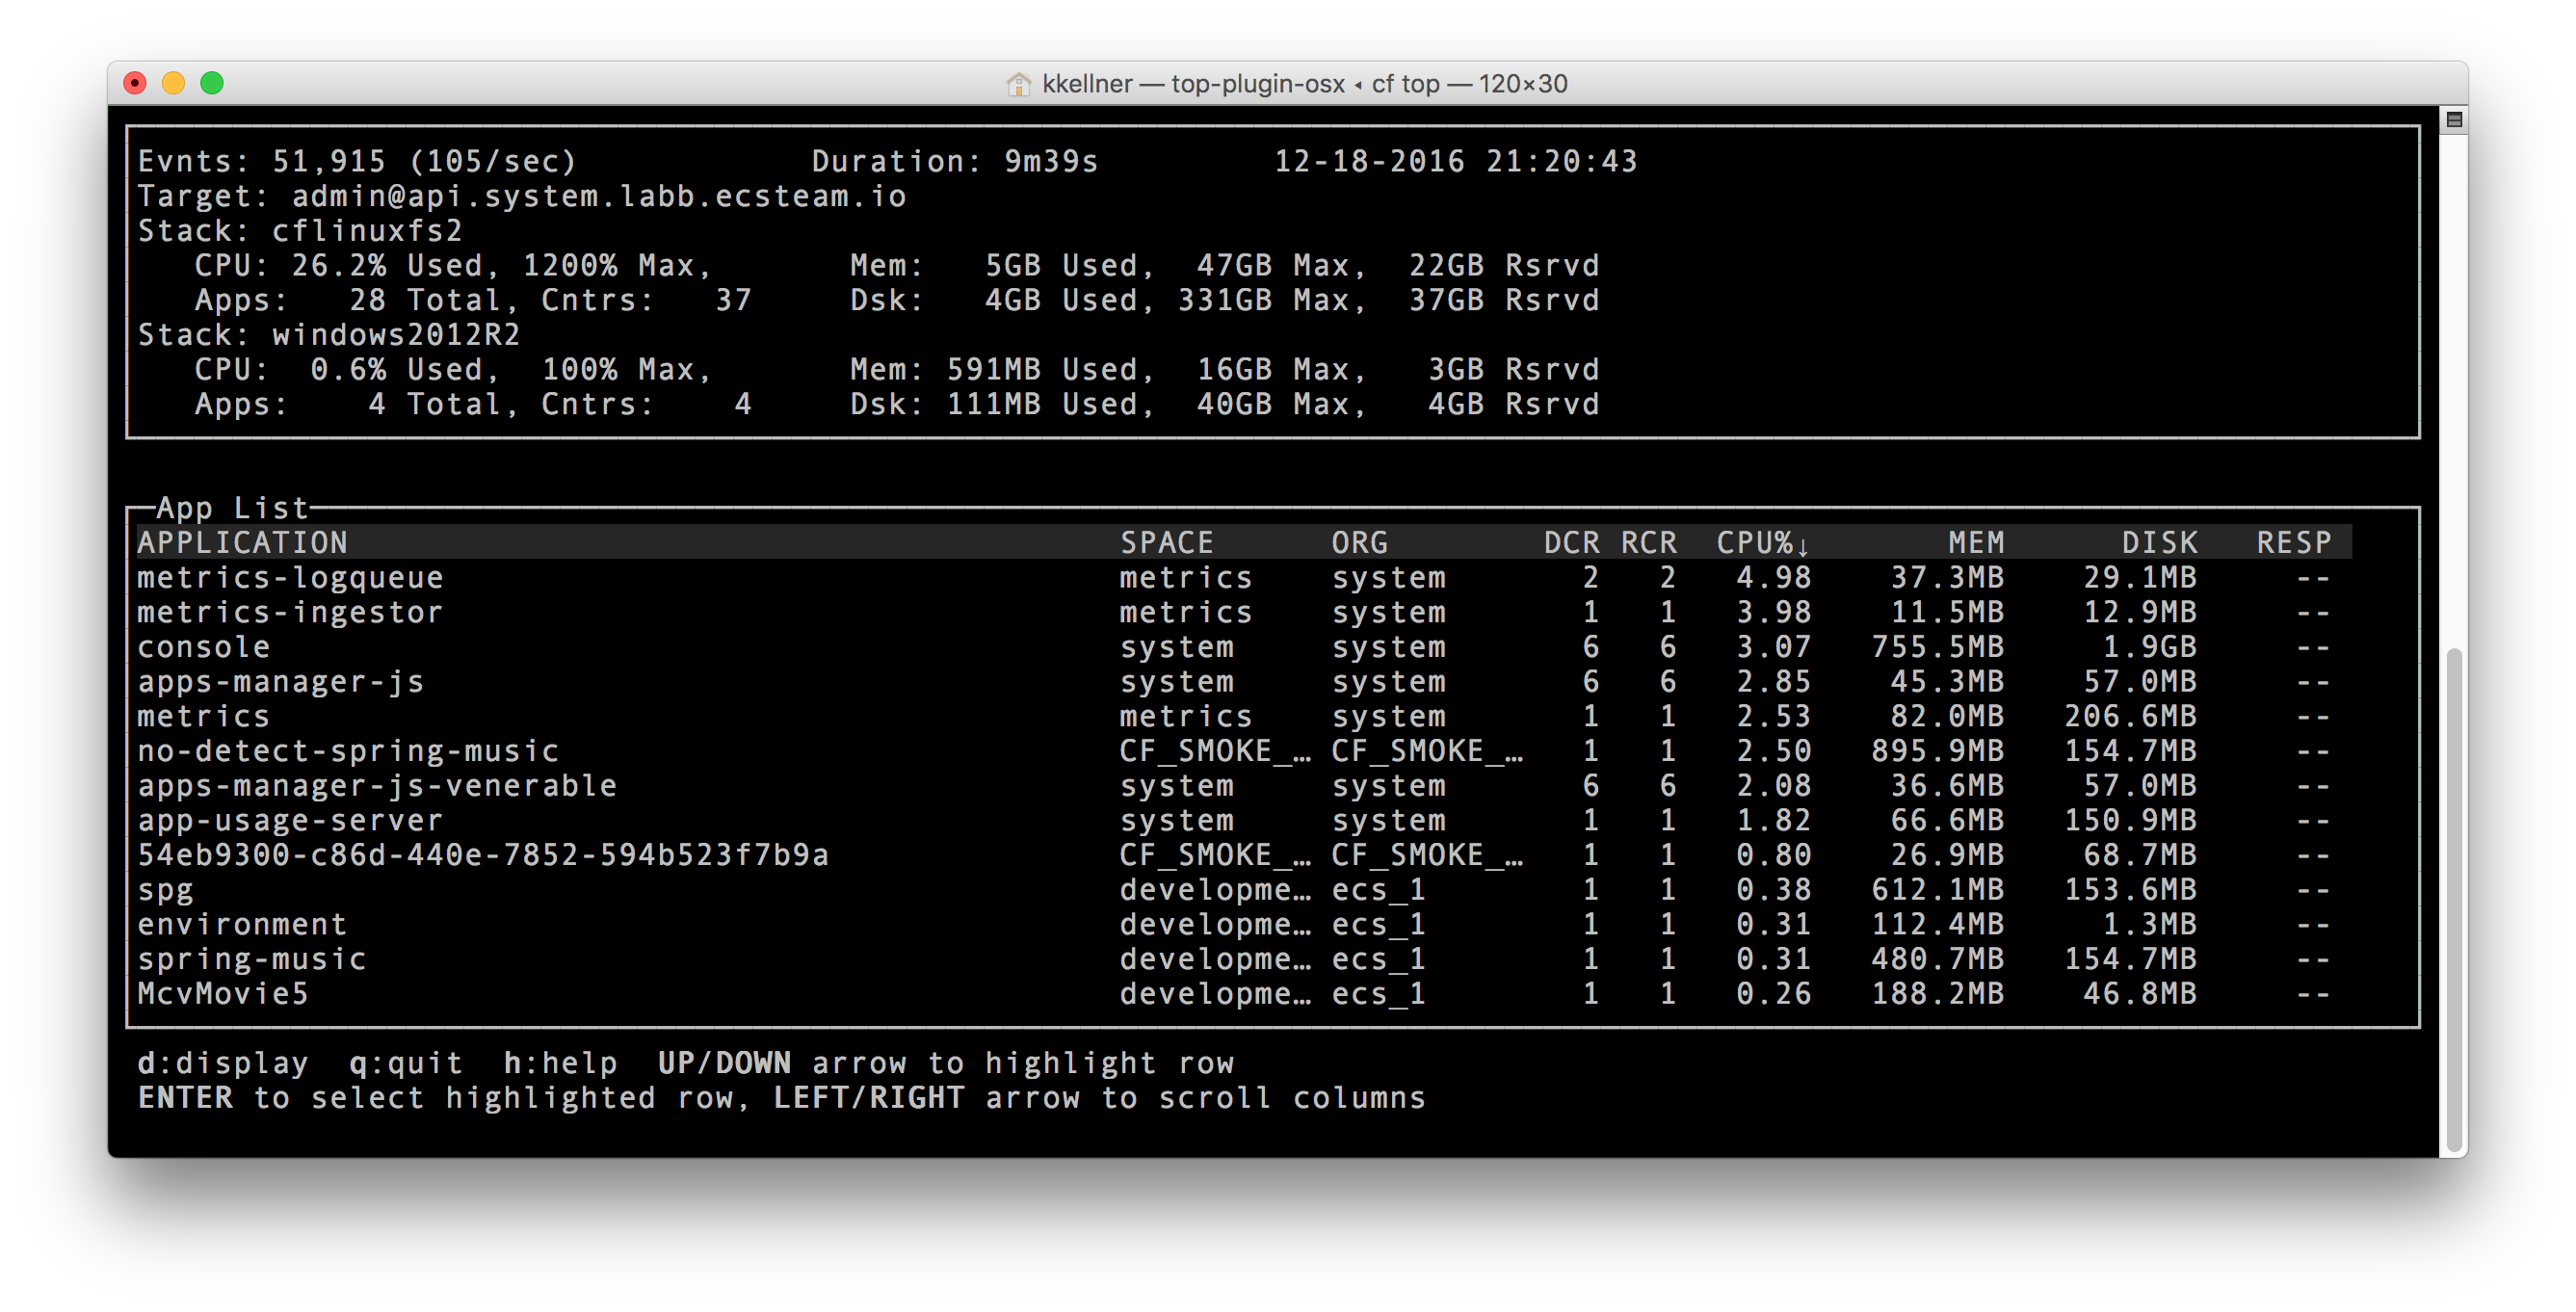
The header shows a summary overview of a foundation. The CPU% Used value will be colorized if any cell's CPU utilization is at or above 80% of the cell's capacity. Yellow (>=80%), red (>=90%). To determine root cause of why this field is colorized, use the Cell Stats screen which will indicate which of the cells are running warm/hot on CPU resource.

If isolation segments has been enabled, the header now summarizes cells by isolation segment as well as stack.

Top lets you filter output which enable you to focus in on the applications that are of interest.
All columns can be used for filtering. Alphanumeric columns support regular expressions. Numeric columns allow
simple expressions (e.g., >15 ). Filters on multiple columns are treated as an "and" condition.
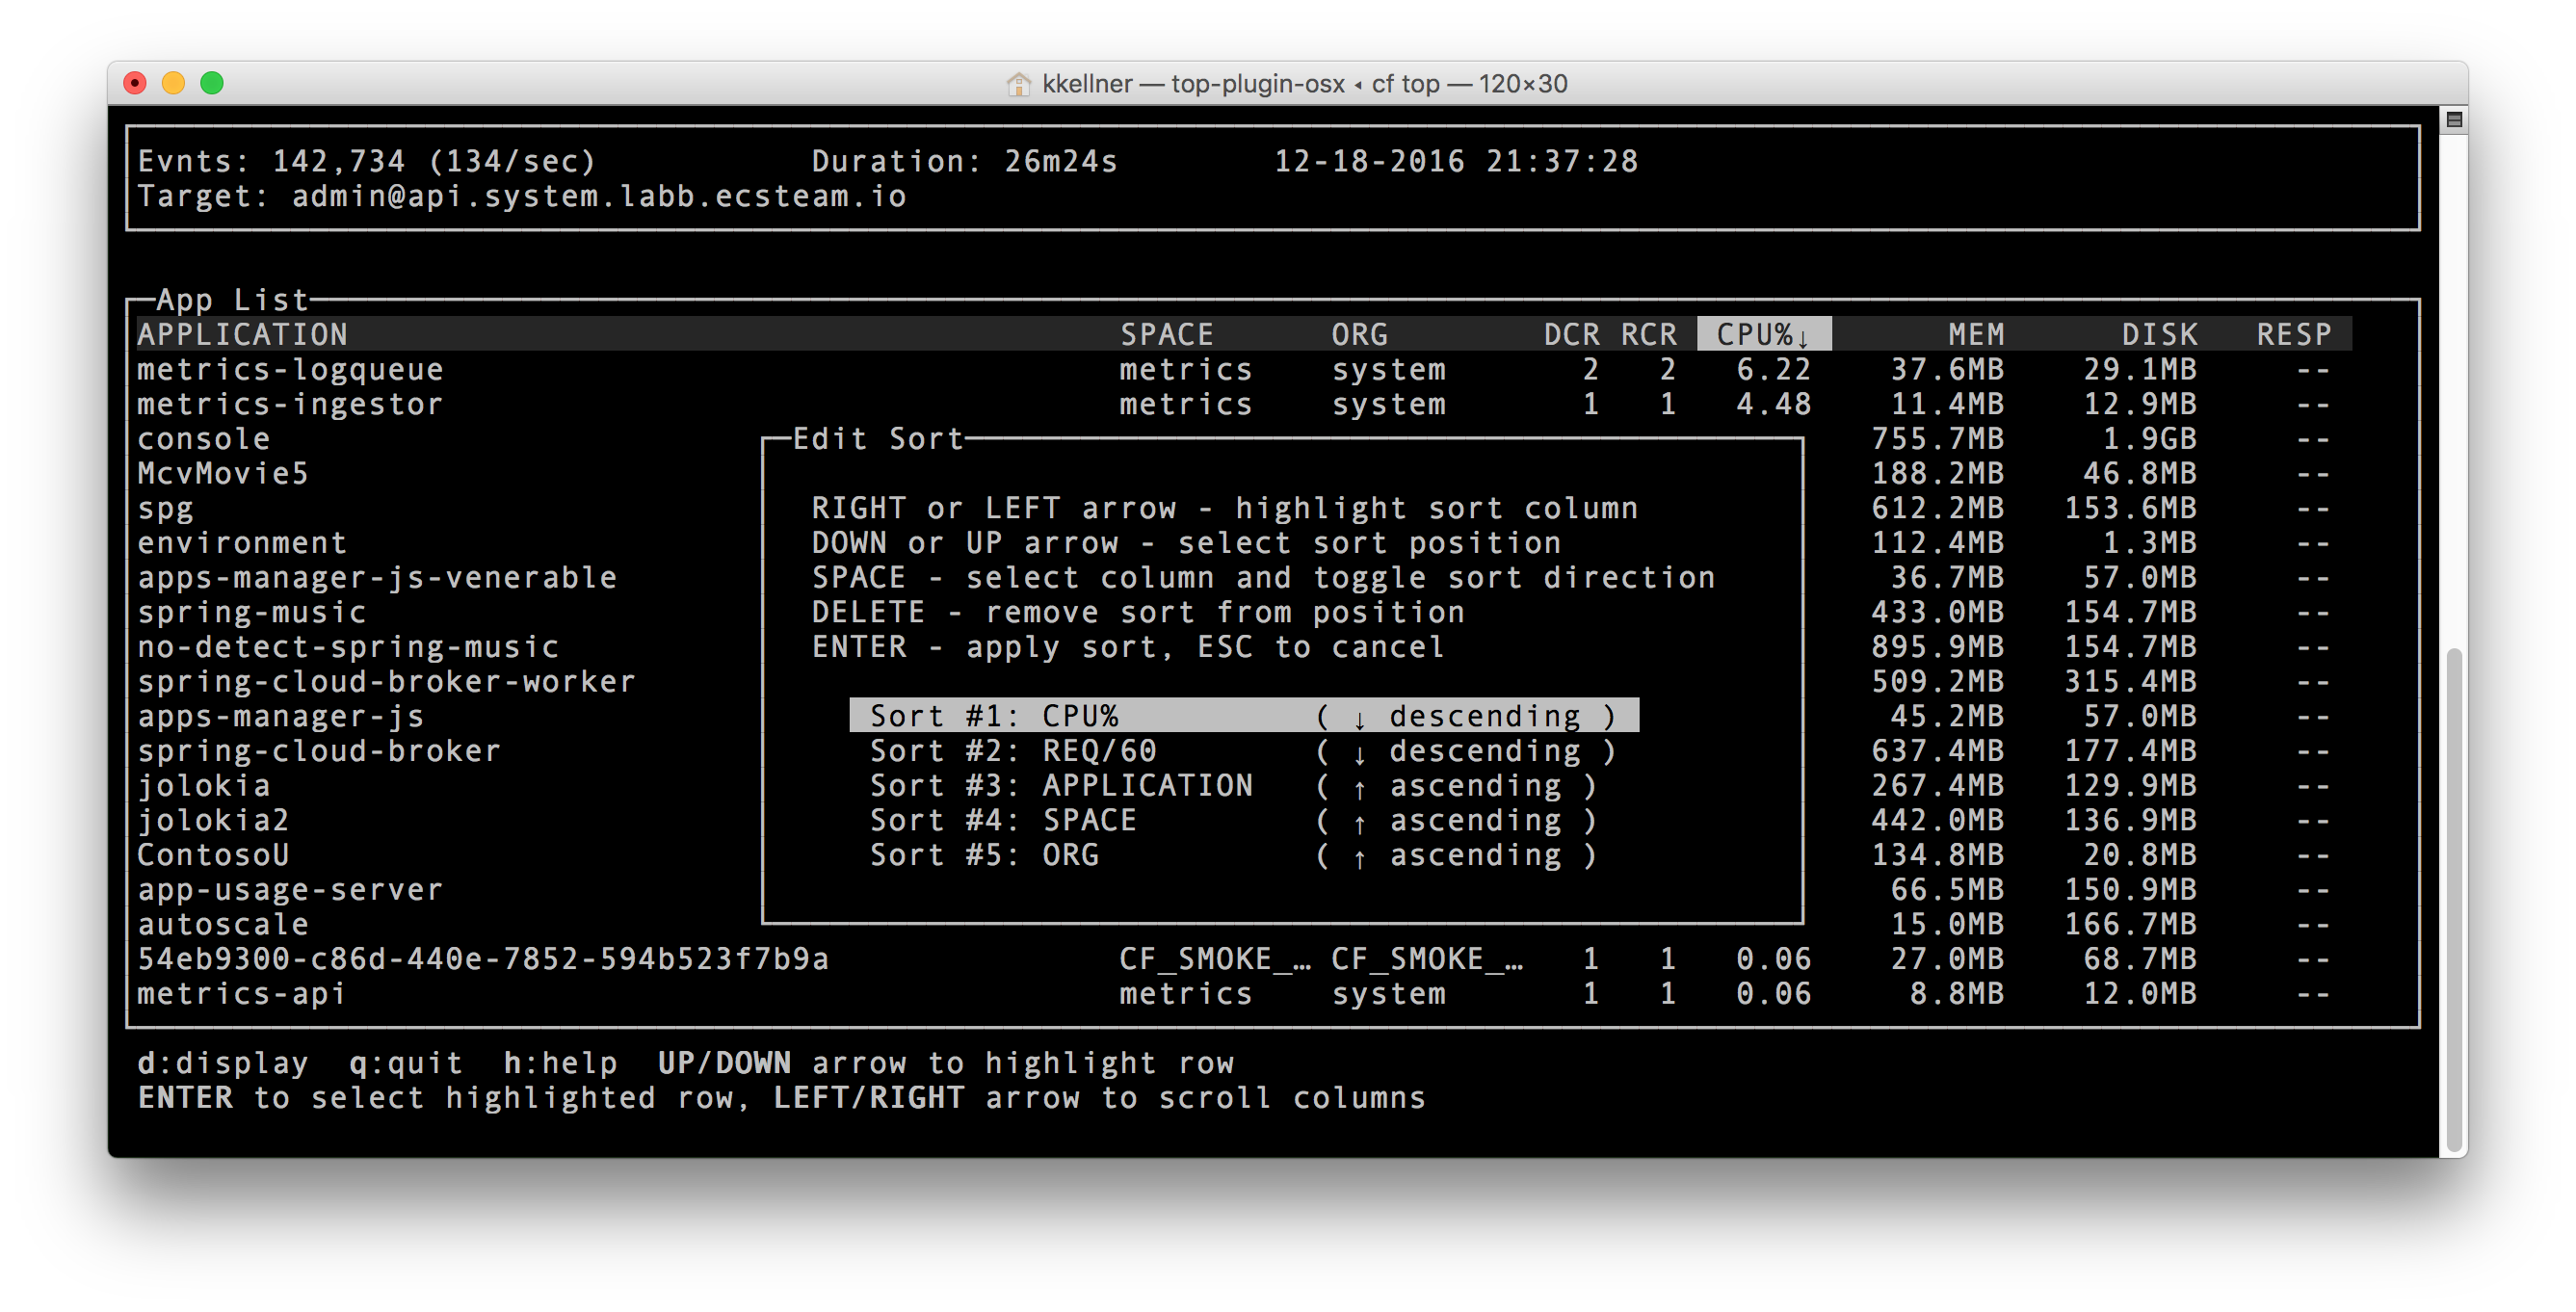
Top allows sorting output on any column. Sorting on multiple columns is supported (up to 5 levels).
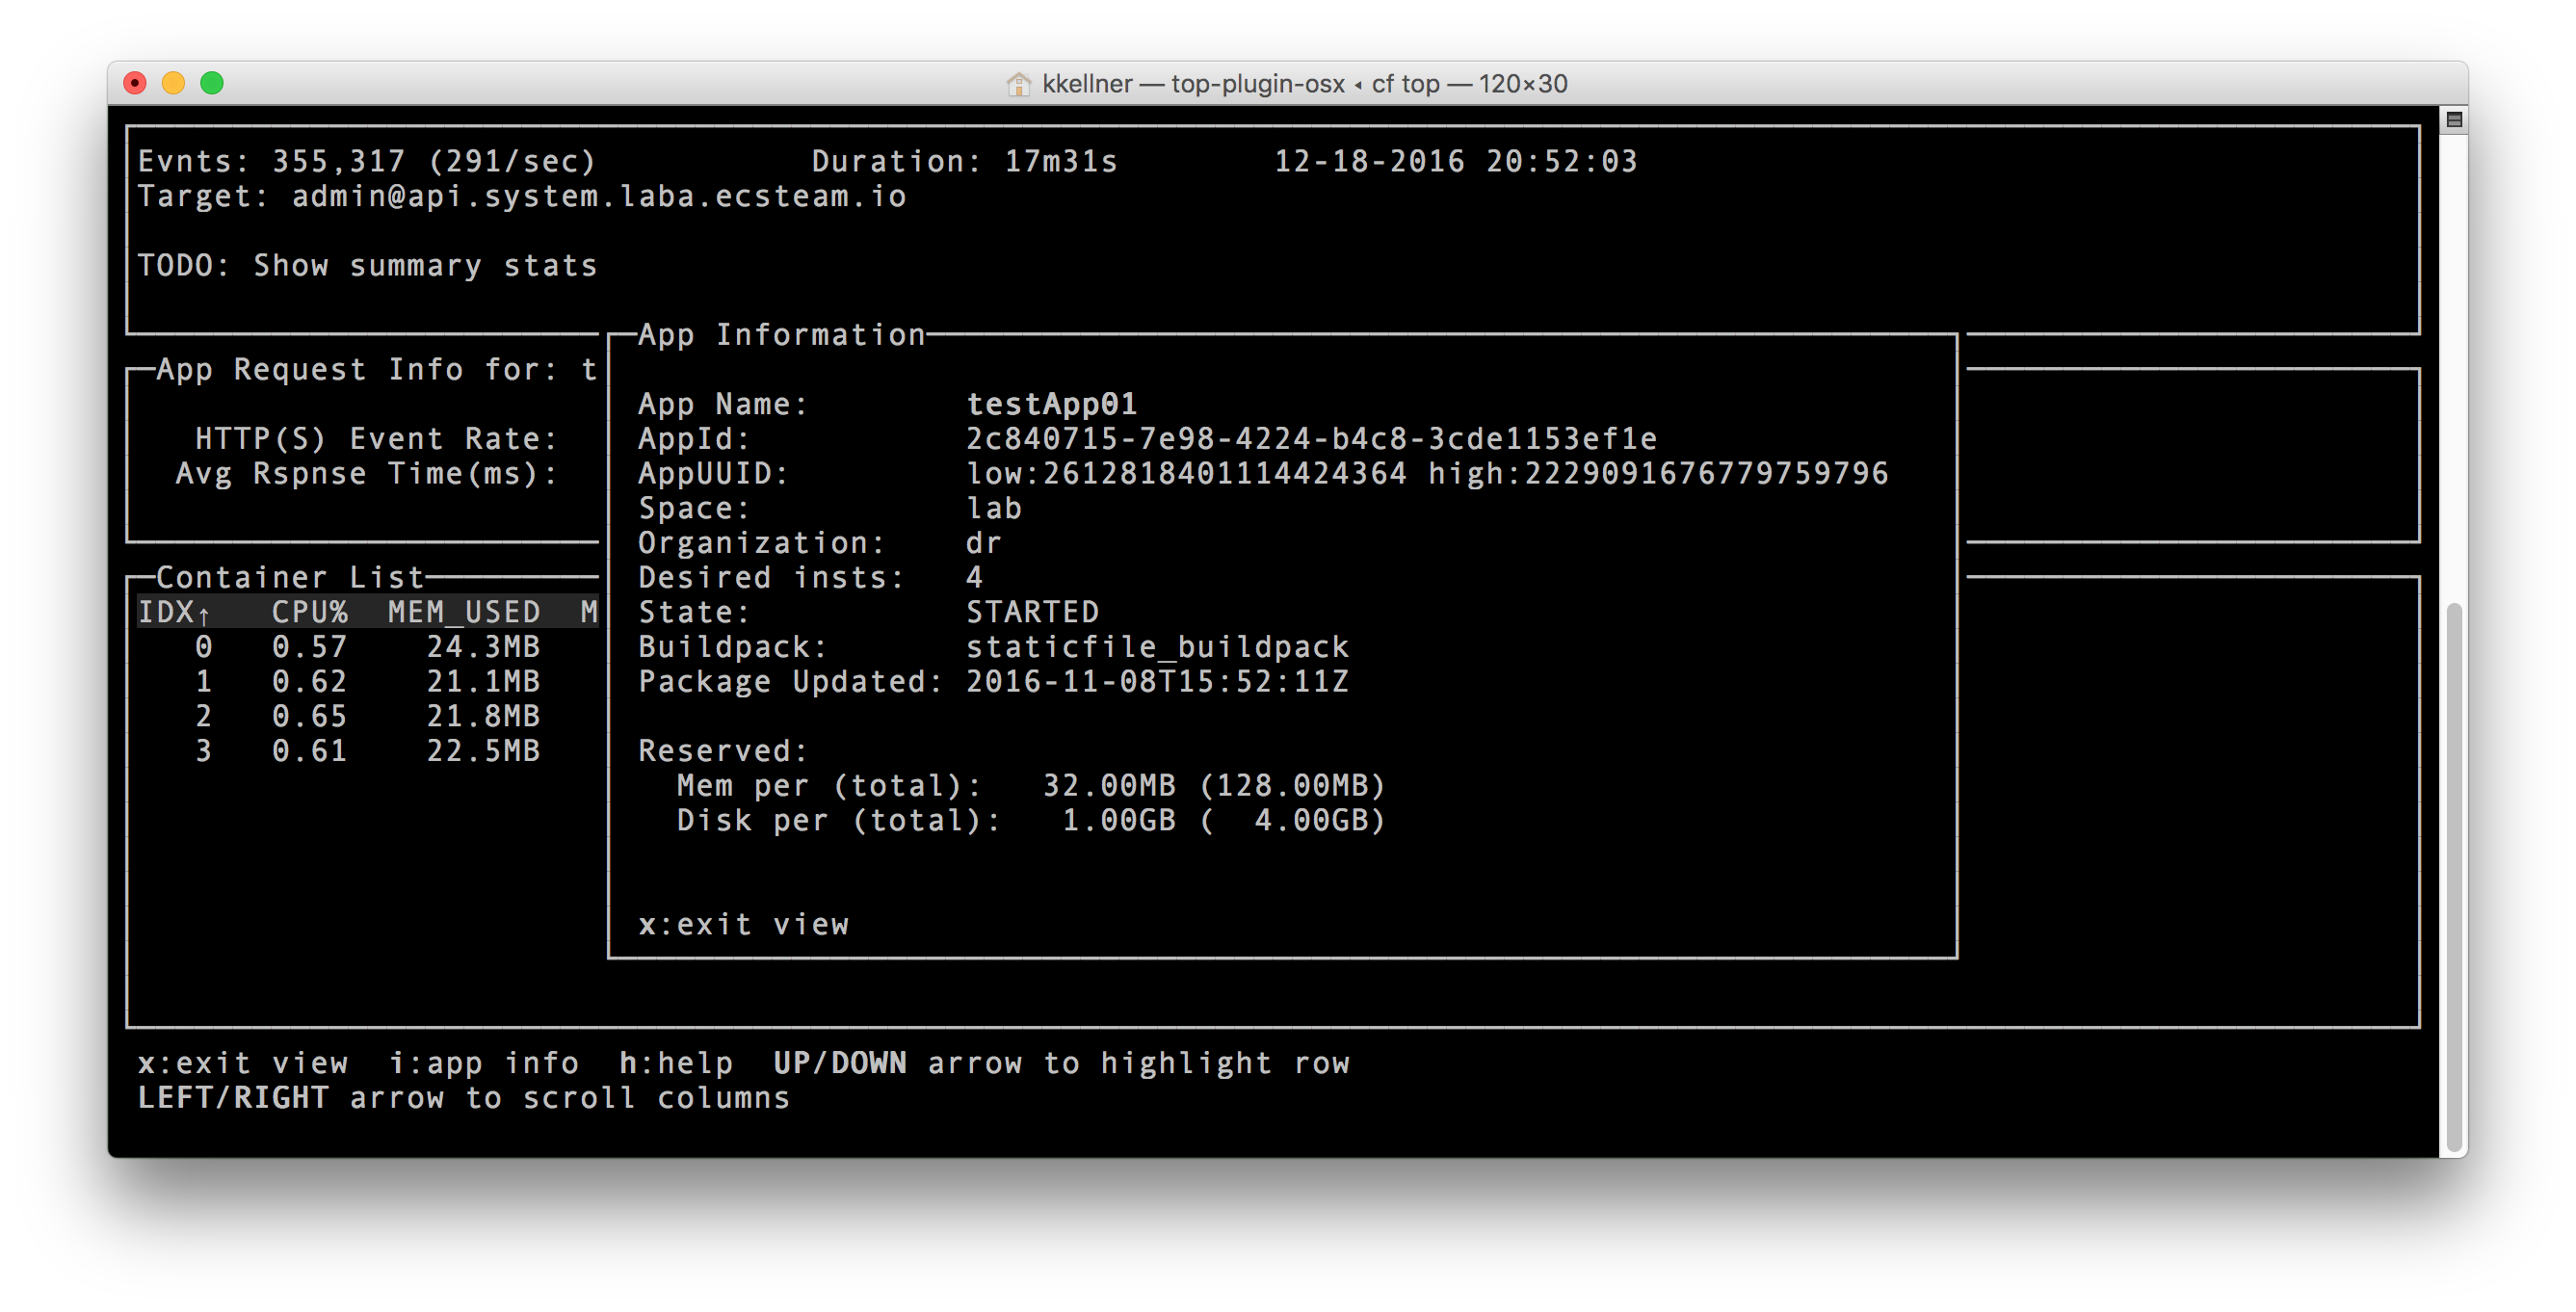
Shows all instances (containers) of selected application.

Shows additional information about selected application.
Shows a list of all organizations with memory quota information. When an organization is selected a list
of all spaces within the organization is shown along with space quota information.
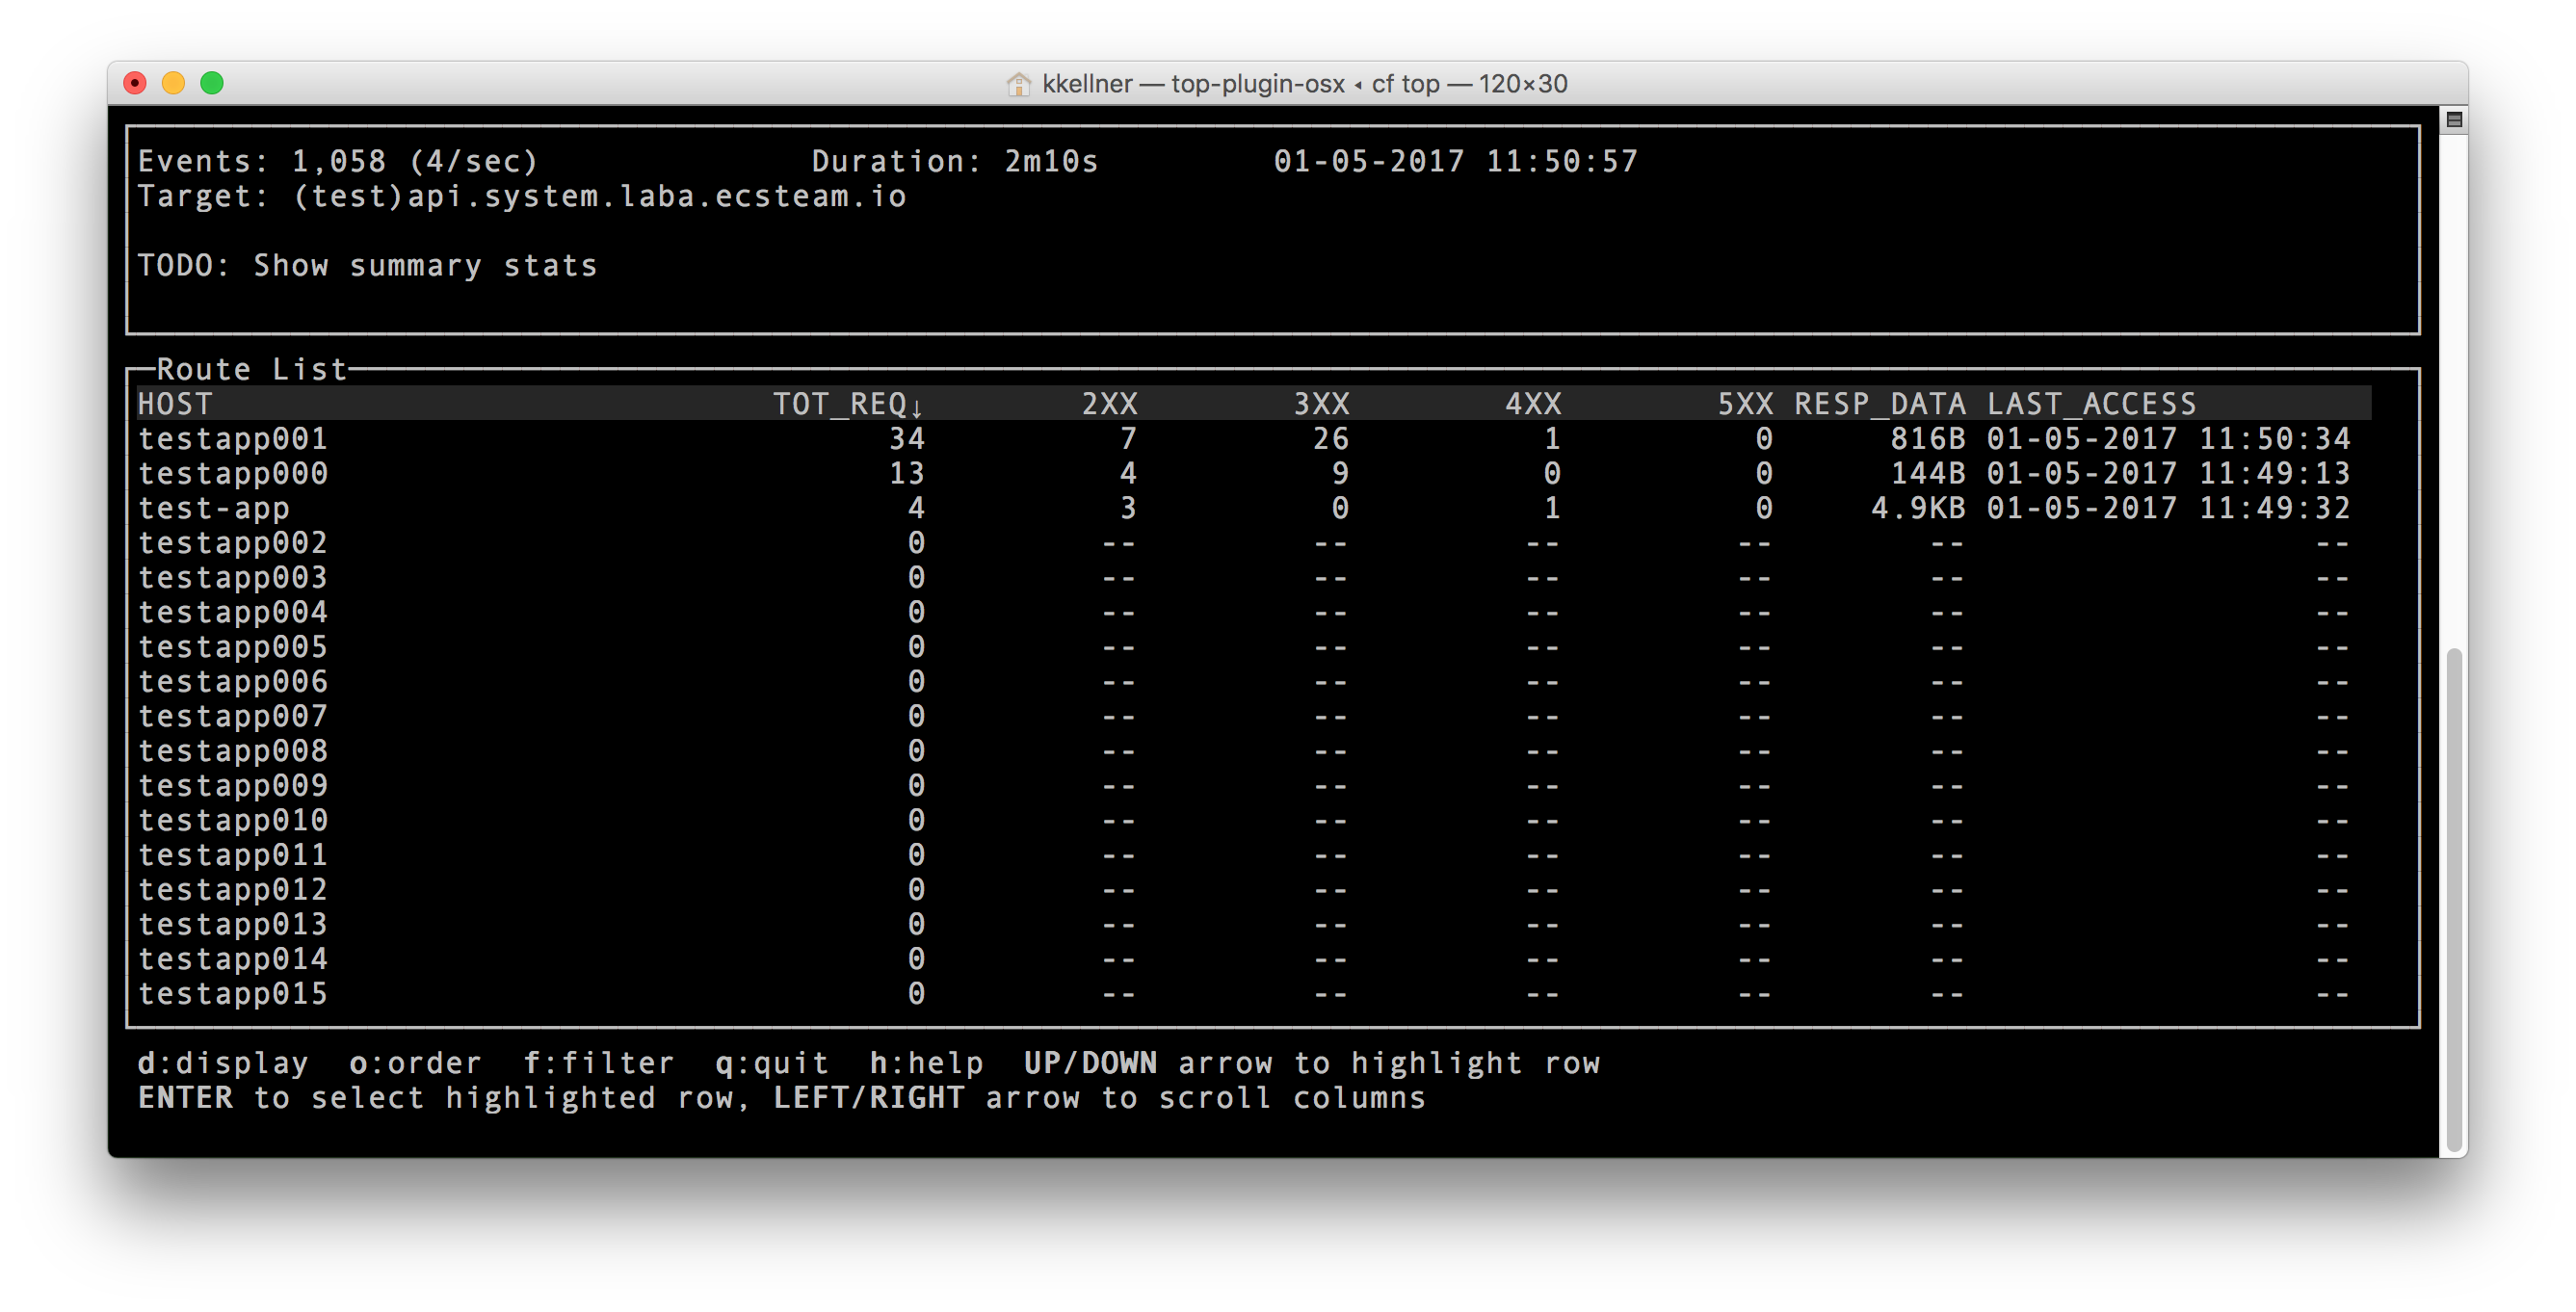
Shows all routes registered with the foundation (or your login has visibility to see).
This shows which routes are taking the most requests (through the go-router)
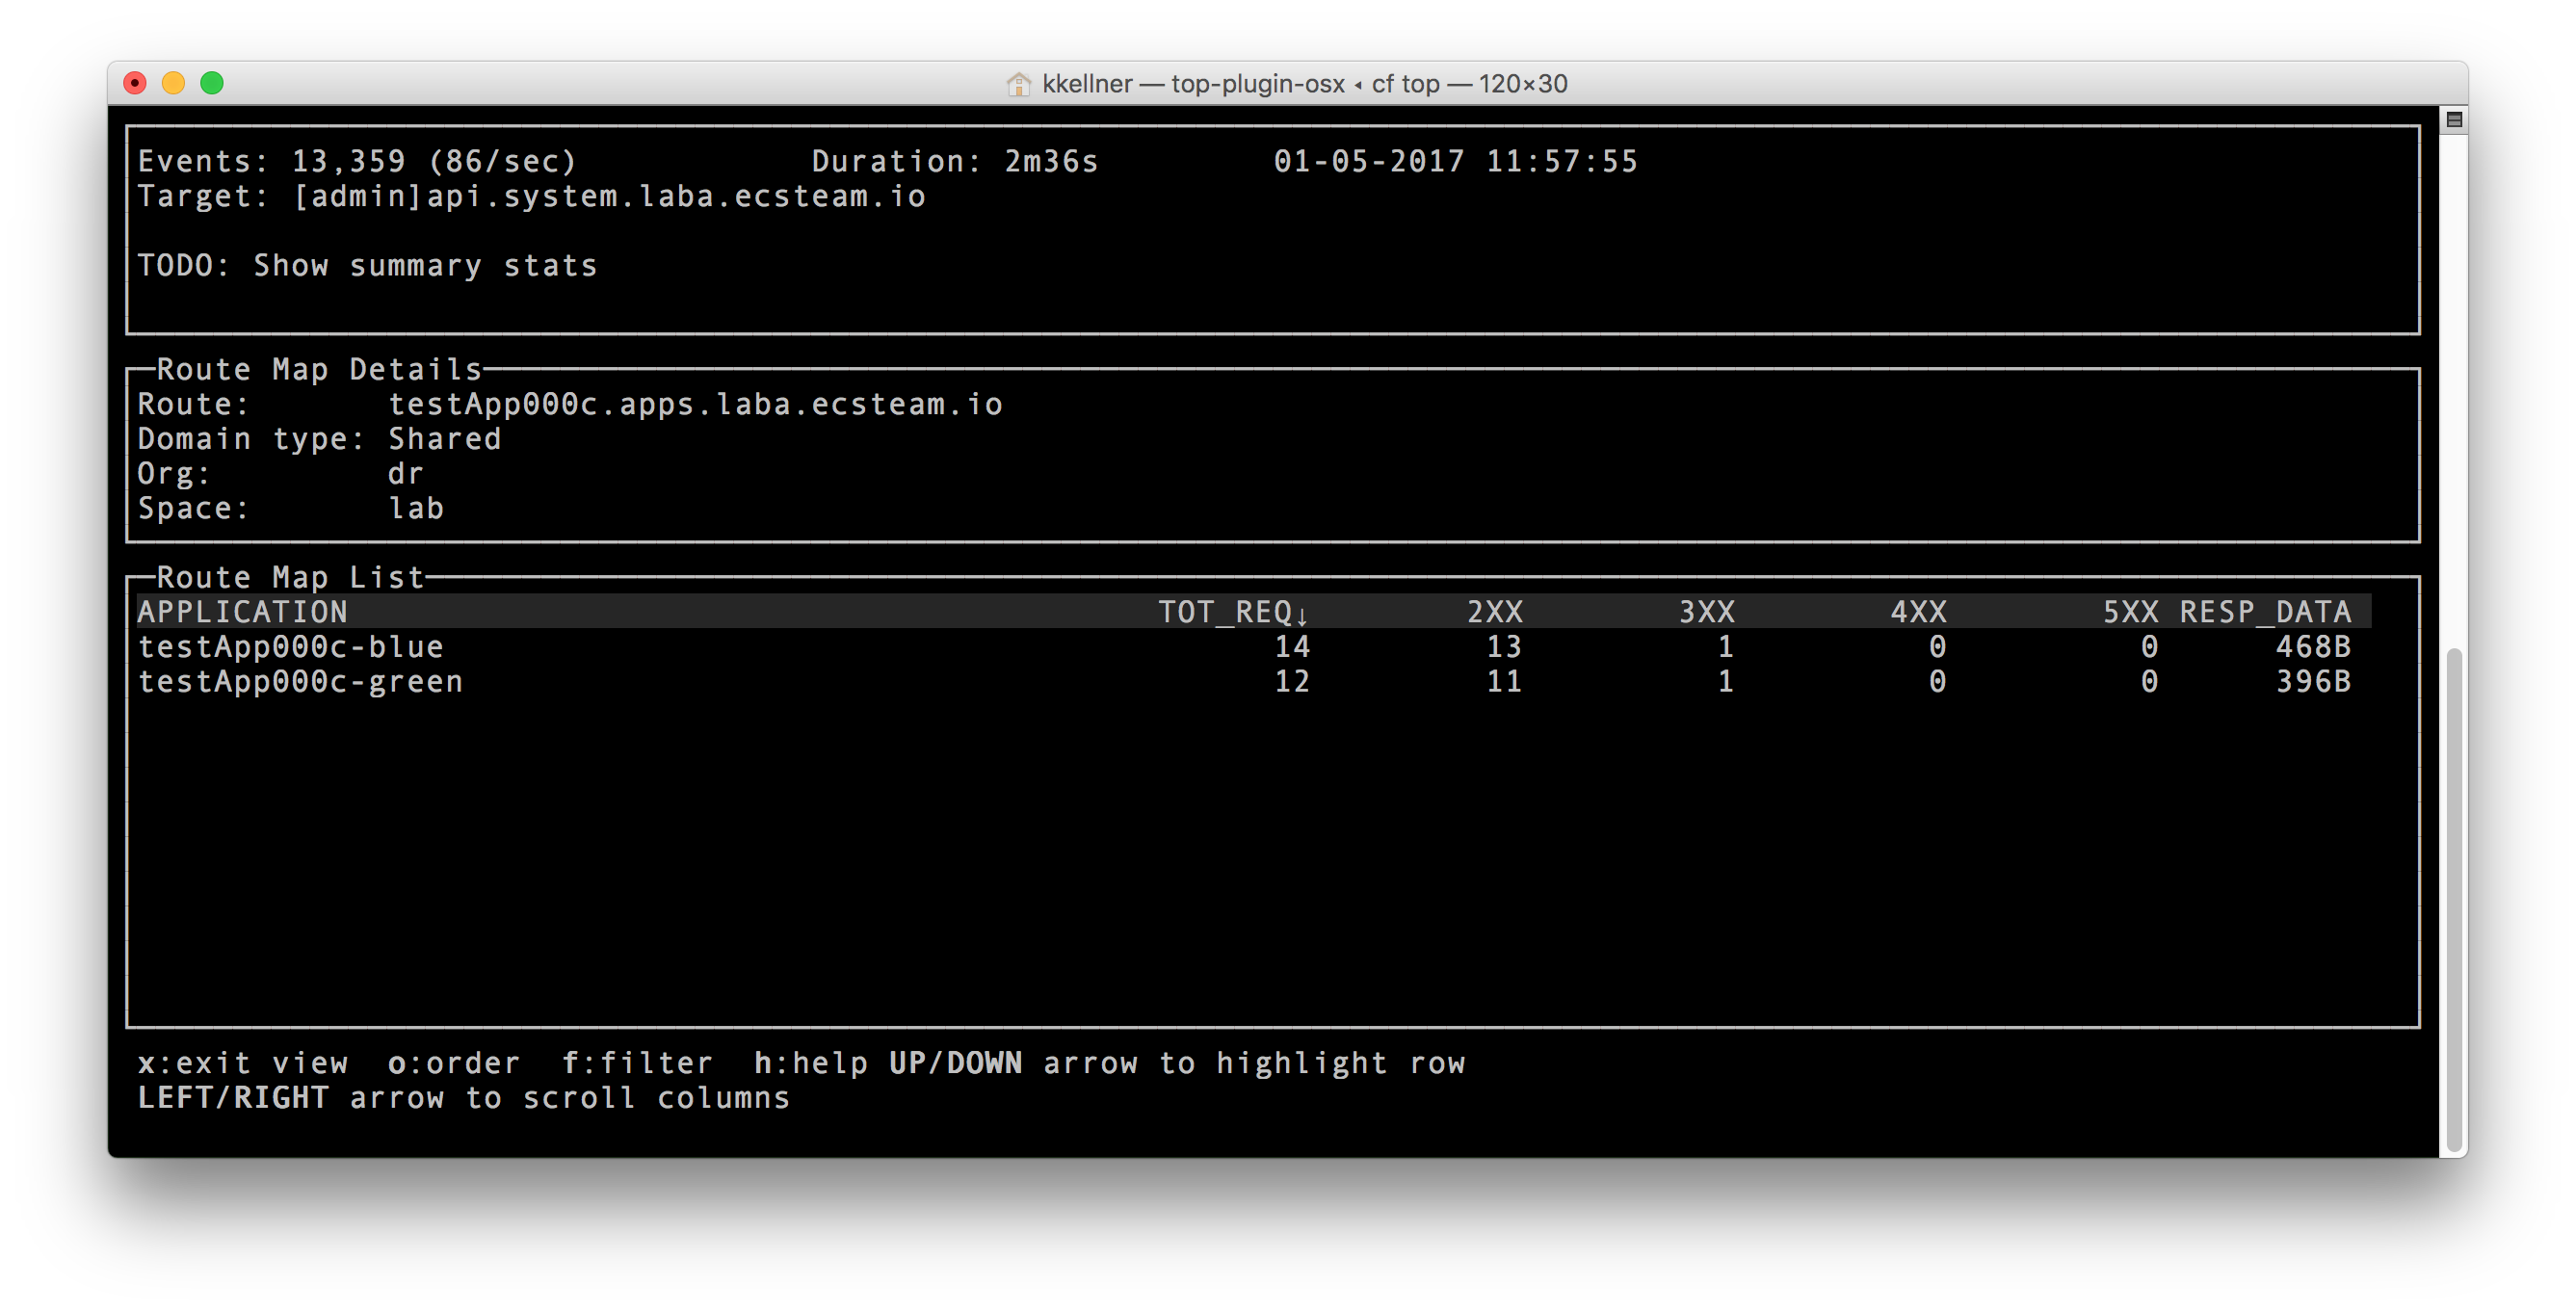
Shows all apps that are mapped to the selected route. This can be helpful in blue-green
deployments. It shows how much traffic is sent to each application along with HTTP status
codes.
Shows all Diego cells running on foundation. Includes cell CPU and memory usage.
This view is useful for locating any "hot" cell -- a cell that has a higher then
expected CPU utilization.

The Diego Cell view will colorize any value that might need attention. A value is colorized yellow if its
value is at 80% of cell capacity and red if its at 90% of cell capacity.
Example: If the cell has 4 vCPUs and the cell CPU percentage consumed is at 350% (3.5 vCPUs are busy)
the field value will be yellow as this is 87.5% of the cell's total CPU capacity.
Memory Free and Disk Free are colorized based on 80% / 90% of resource consumed.
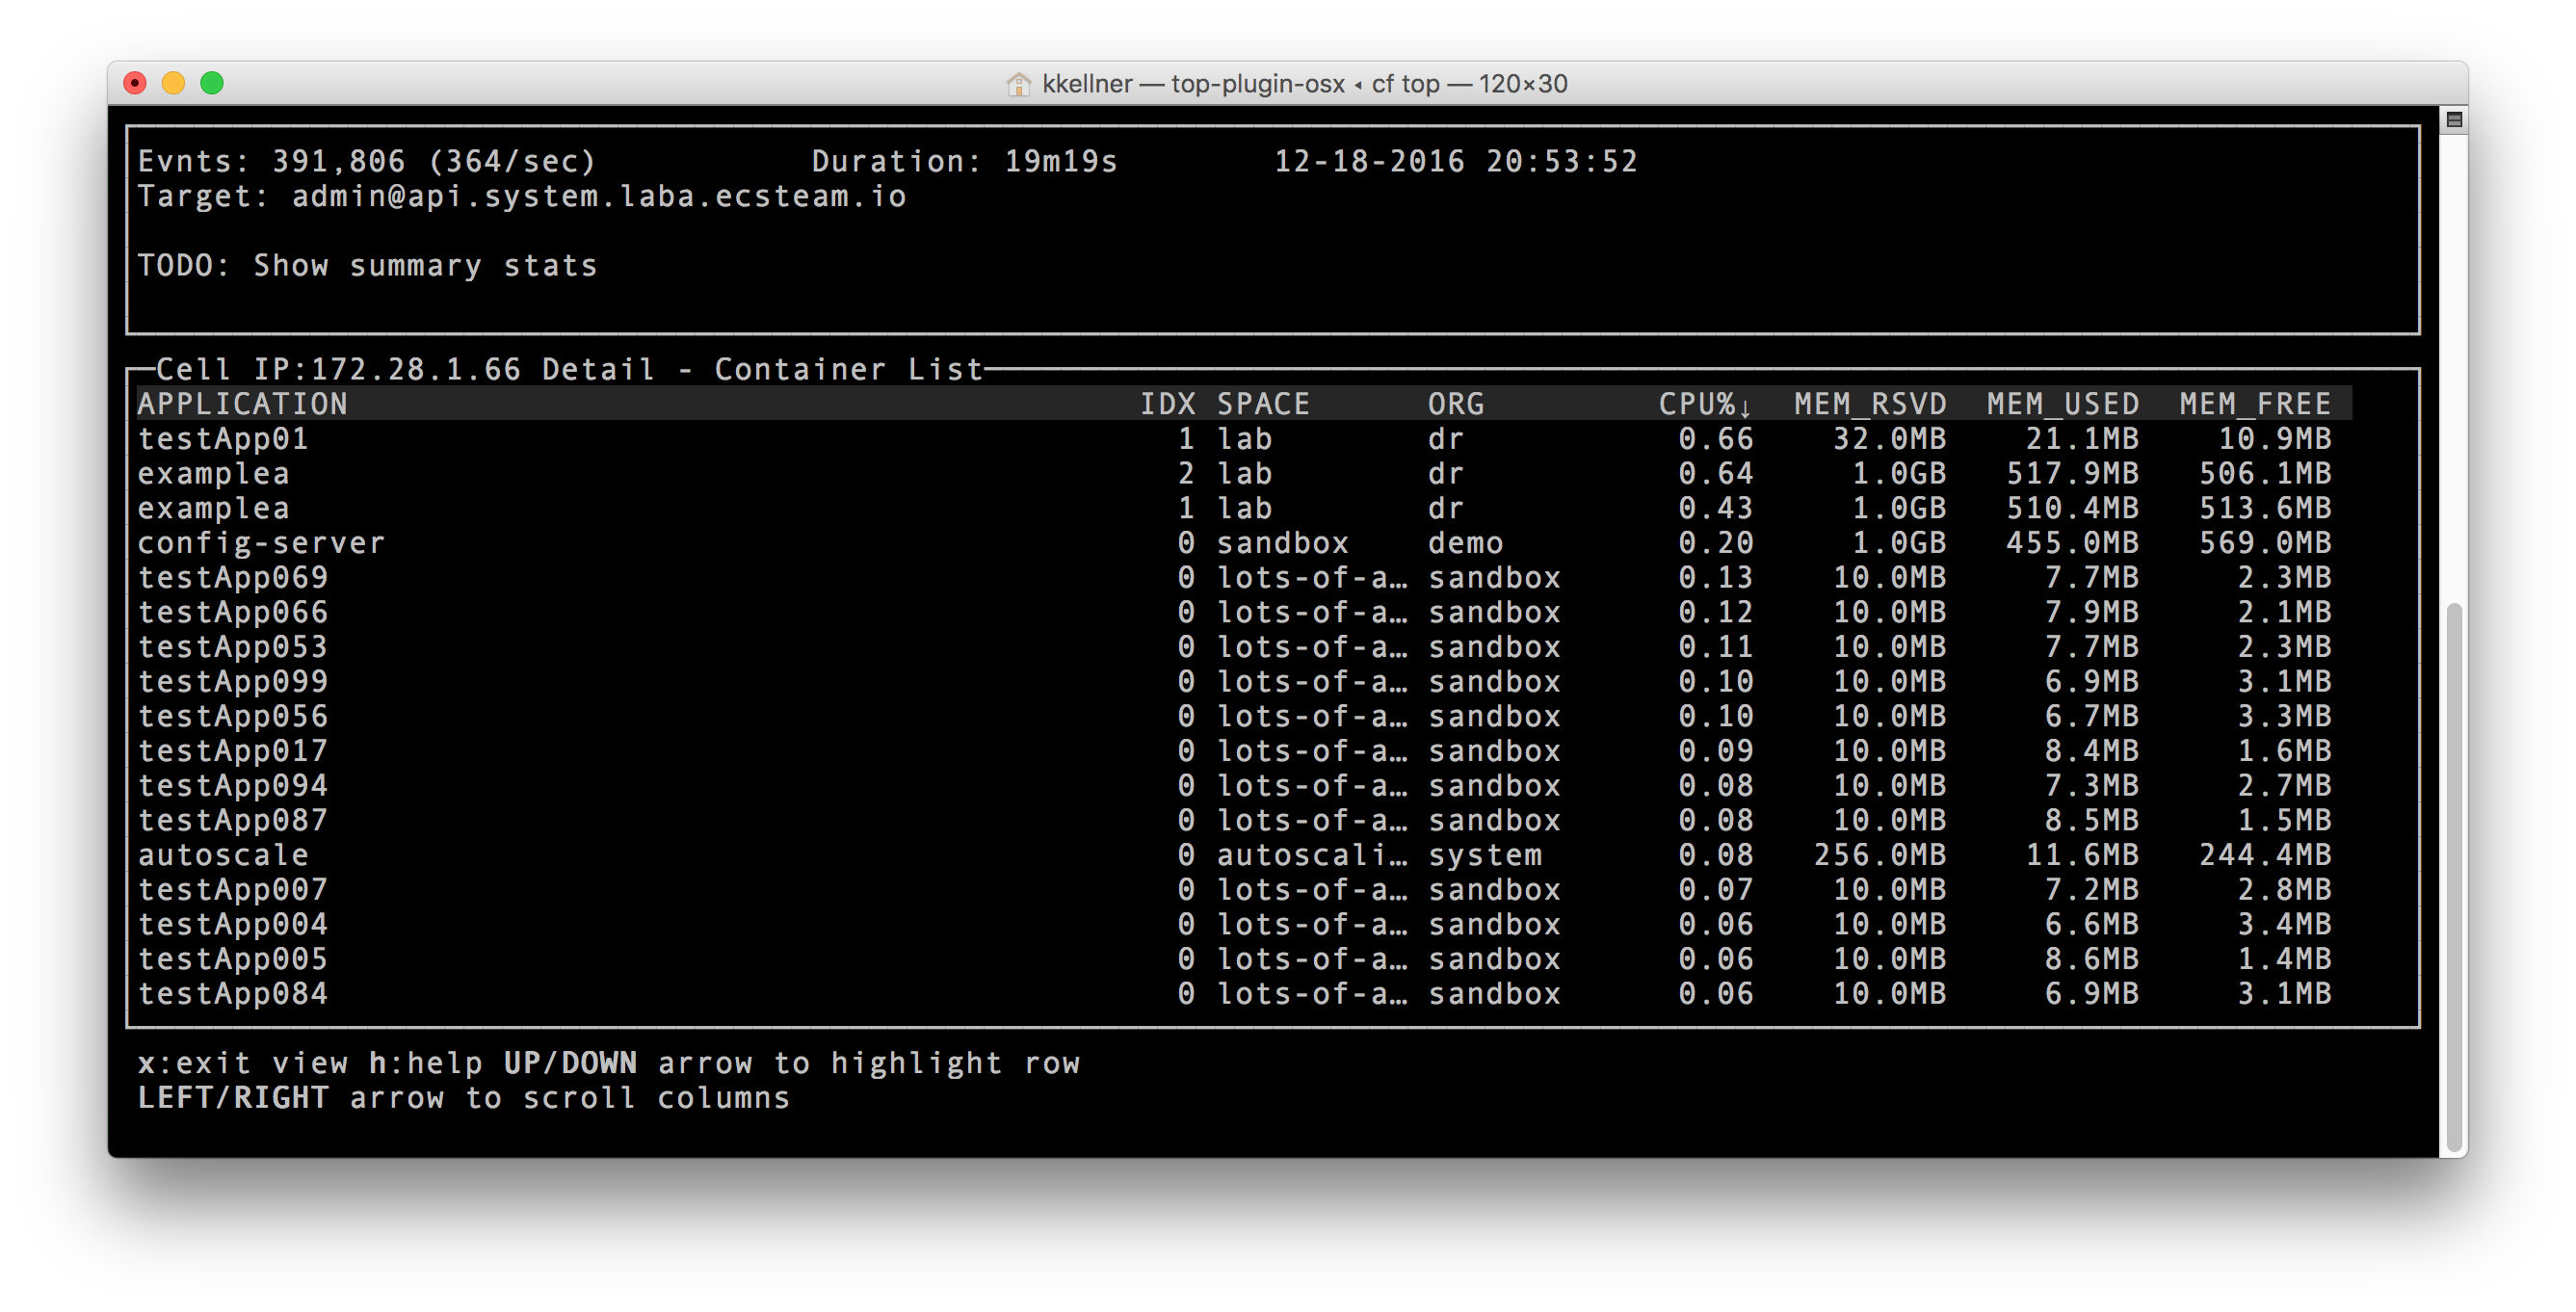
Shows all containers running on selected cell. Includes container CPU and memory usage.
If a cell has a high CPU utilization, this detail view can help identify which application instance is the culprit.