| title | order |
|---|---|
Create a fixed-window plot |
150 |
As of Rerun 0.16, the TimeSeriesView now supports direct manipulation of the visible time range. This allows you to create a plot that only shows a fixed window of data.
To specify the visible time range, you must pass one or more VisibleTimeRange objects to the time_ranges parameter of the TimeSeriesView blueprint type. If your app only uses a single timeline, you can directly pass a single VisibleTimeRange object instead of wrapping it in a list.
The VisibleTimeRange object takes three parameters:
timeline: The timeline that the range will apply to. This must match the timeline used to log your data, or if you are only using the rerun-provided timestamps, you can use the strings"log_time", or"log_tick".start: The start of the visible time range.end: The end of the visible time range.
The start and end parameters are set using a TimeRangeBoundary:
- To specify an absolute time, you can use the
TimeRangeBoundary.absolute()method. - To specify a cursor-relative time, you can use the
TimeRangeBoundary.cursor_relative()method. - You can also specify
TimeRangeBoundary.infinite()to indicate that the start or end of the time range should be unbounded.
In order to account for the different types of timeline (temporal or sequence-based), both the
TimeRangeBoundary.absolute() and TimeRangeBoundary.cursor_relative() methods can be specified using one of
the keyword args:
seconds: Use this if you calledrr.set_time_seconds()to update the timeline.nanos: Use this if you calledrr.set_time_nanos()to update the timeline.seq: Use this if you calledrr.set_time_seq()to update the timeline.
To create a trailing 5 second window plot, you can specify your TimeSeriesView like this:
rrb.TimeSeriesView(
    origin="plot_path",
    time_ranges=rrb.VisibleTimeRange(
            timeline="time",
            start=rrb.TimeRangeBoundary.cursor_relative(seconds=-5.0),
            end=rrb.TimeRangeBoundary.cursor_relative(),
        )
)For a complete working example, you can run the following code:
snippet: tutorials/fixed_window_plot
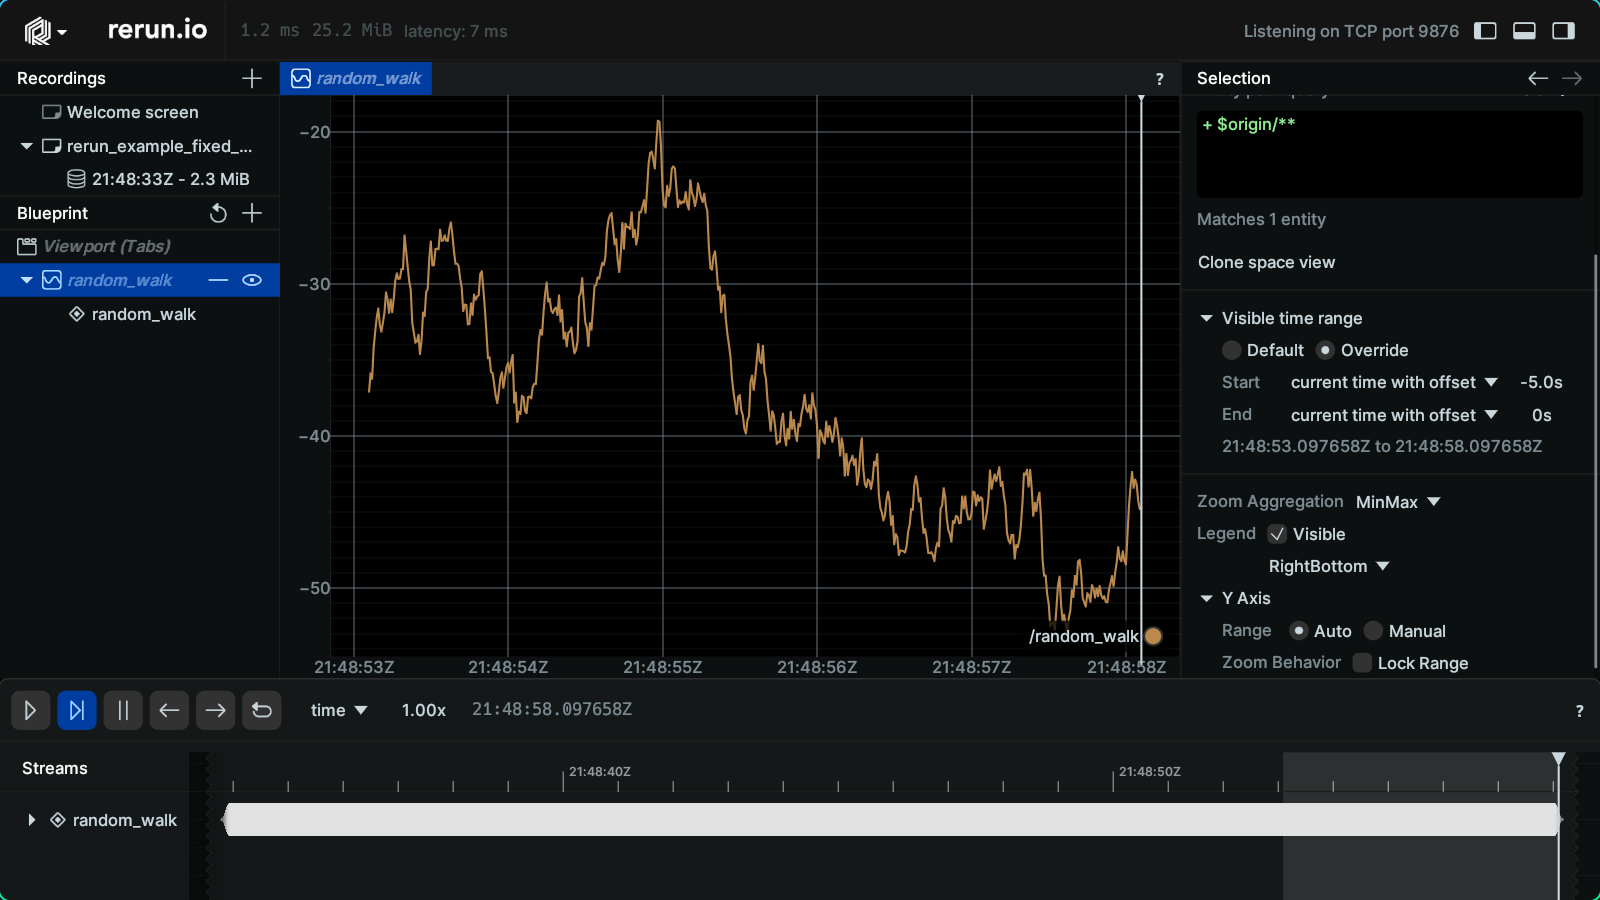
This should create a plot that only shows the last 5 seconds of data. If you select the view, you should see that the time range is configured as expected.
Alternatively, you can check out a more full-featured example with multiple plot windows here.
- Any time you log data, it has two timepoints associated with it: "log_time", and "log_tick".