Skip to content
New issue

Have a question about this project? Sign up for a free GitHub account to open an issue and contact its maintainers and the community.

By clicking “Sign up for GitHub”, you agree to our terms of service and privacy statement. We’ll occasionally send you account related emails.

Already on GitHub? Sign in to your account

Exporting to rtf with column spanner #153

Closed
moleps opened this issue Jan 30, 2019 · 2 comments
Closed

Exporting to rtf with column spanner #153

moleps opened this issue Jan 30, 2019 · 2 comments

Comments

@moleps
Copy link

moleps commented Jan 30, 2019

I tried exporting one of the examples to rtf, but the column spanner is lost somewhere in the process.


library(gt)

airquality_m <- 
  airquality %>%
  mutate(Year = 1973L) %>%
  slice(1:10)

gt_tbl <- 
  gt(data = airquality_m) %>%
  tab_header(
    title = "New York Air Quality Measurements",
    subtitle = "Daily measurements in New York City (May 1-10, 1973)"
  ) %>%
  tab_spanner(
    label = "Time",
    columns = vars(Year, Month, Day)
  ) %>%
  tab_spanner(
    label = "Measurement",
    columns = vars(Ozone, Solar.R, Wind, Temp)
  )

writeLines(as_rtf(gt_tbl),"t1.rtf")

Now - when I open t1.rtf I get:

skjermbilde 2019-01-30 22 18 43

Am I missing something here or is this feature not implemented in the rtf output?

@rich-iannone
Copy link
Member

Column spanner labels are supposed to work with RTF. I will take a look at this and implement a fix.

@rich-iannone rich-iannone added this to the v0.2.3 milestone Oct 6, 2020
@rich-iannone
Copy link
Member

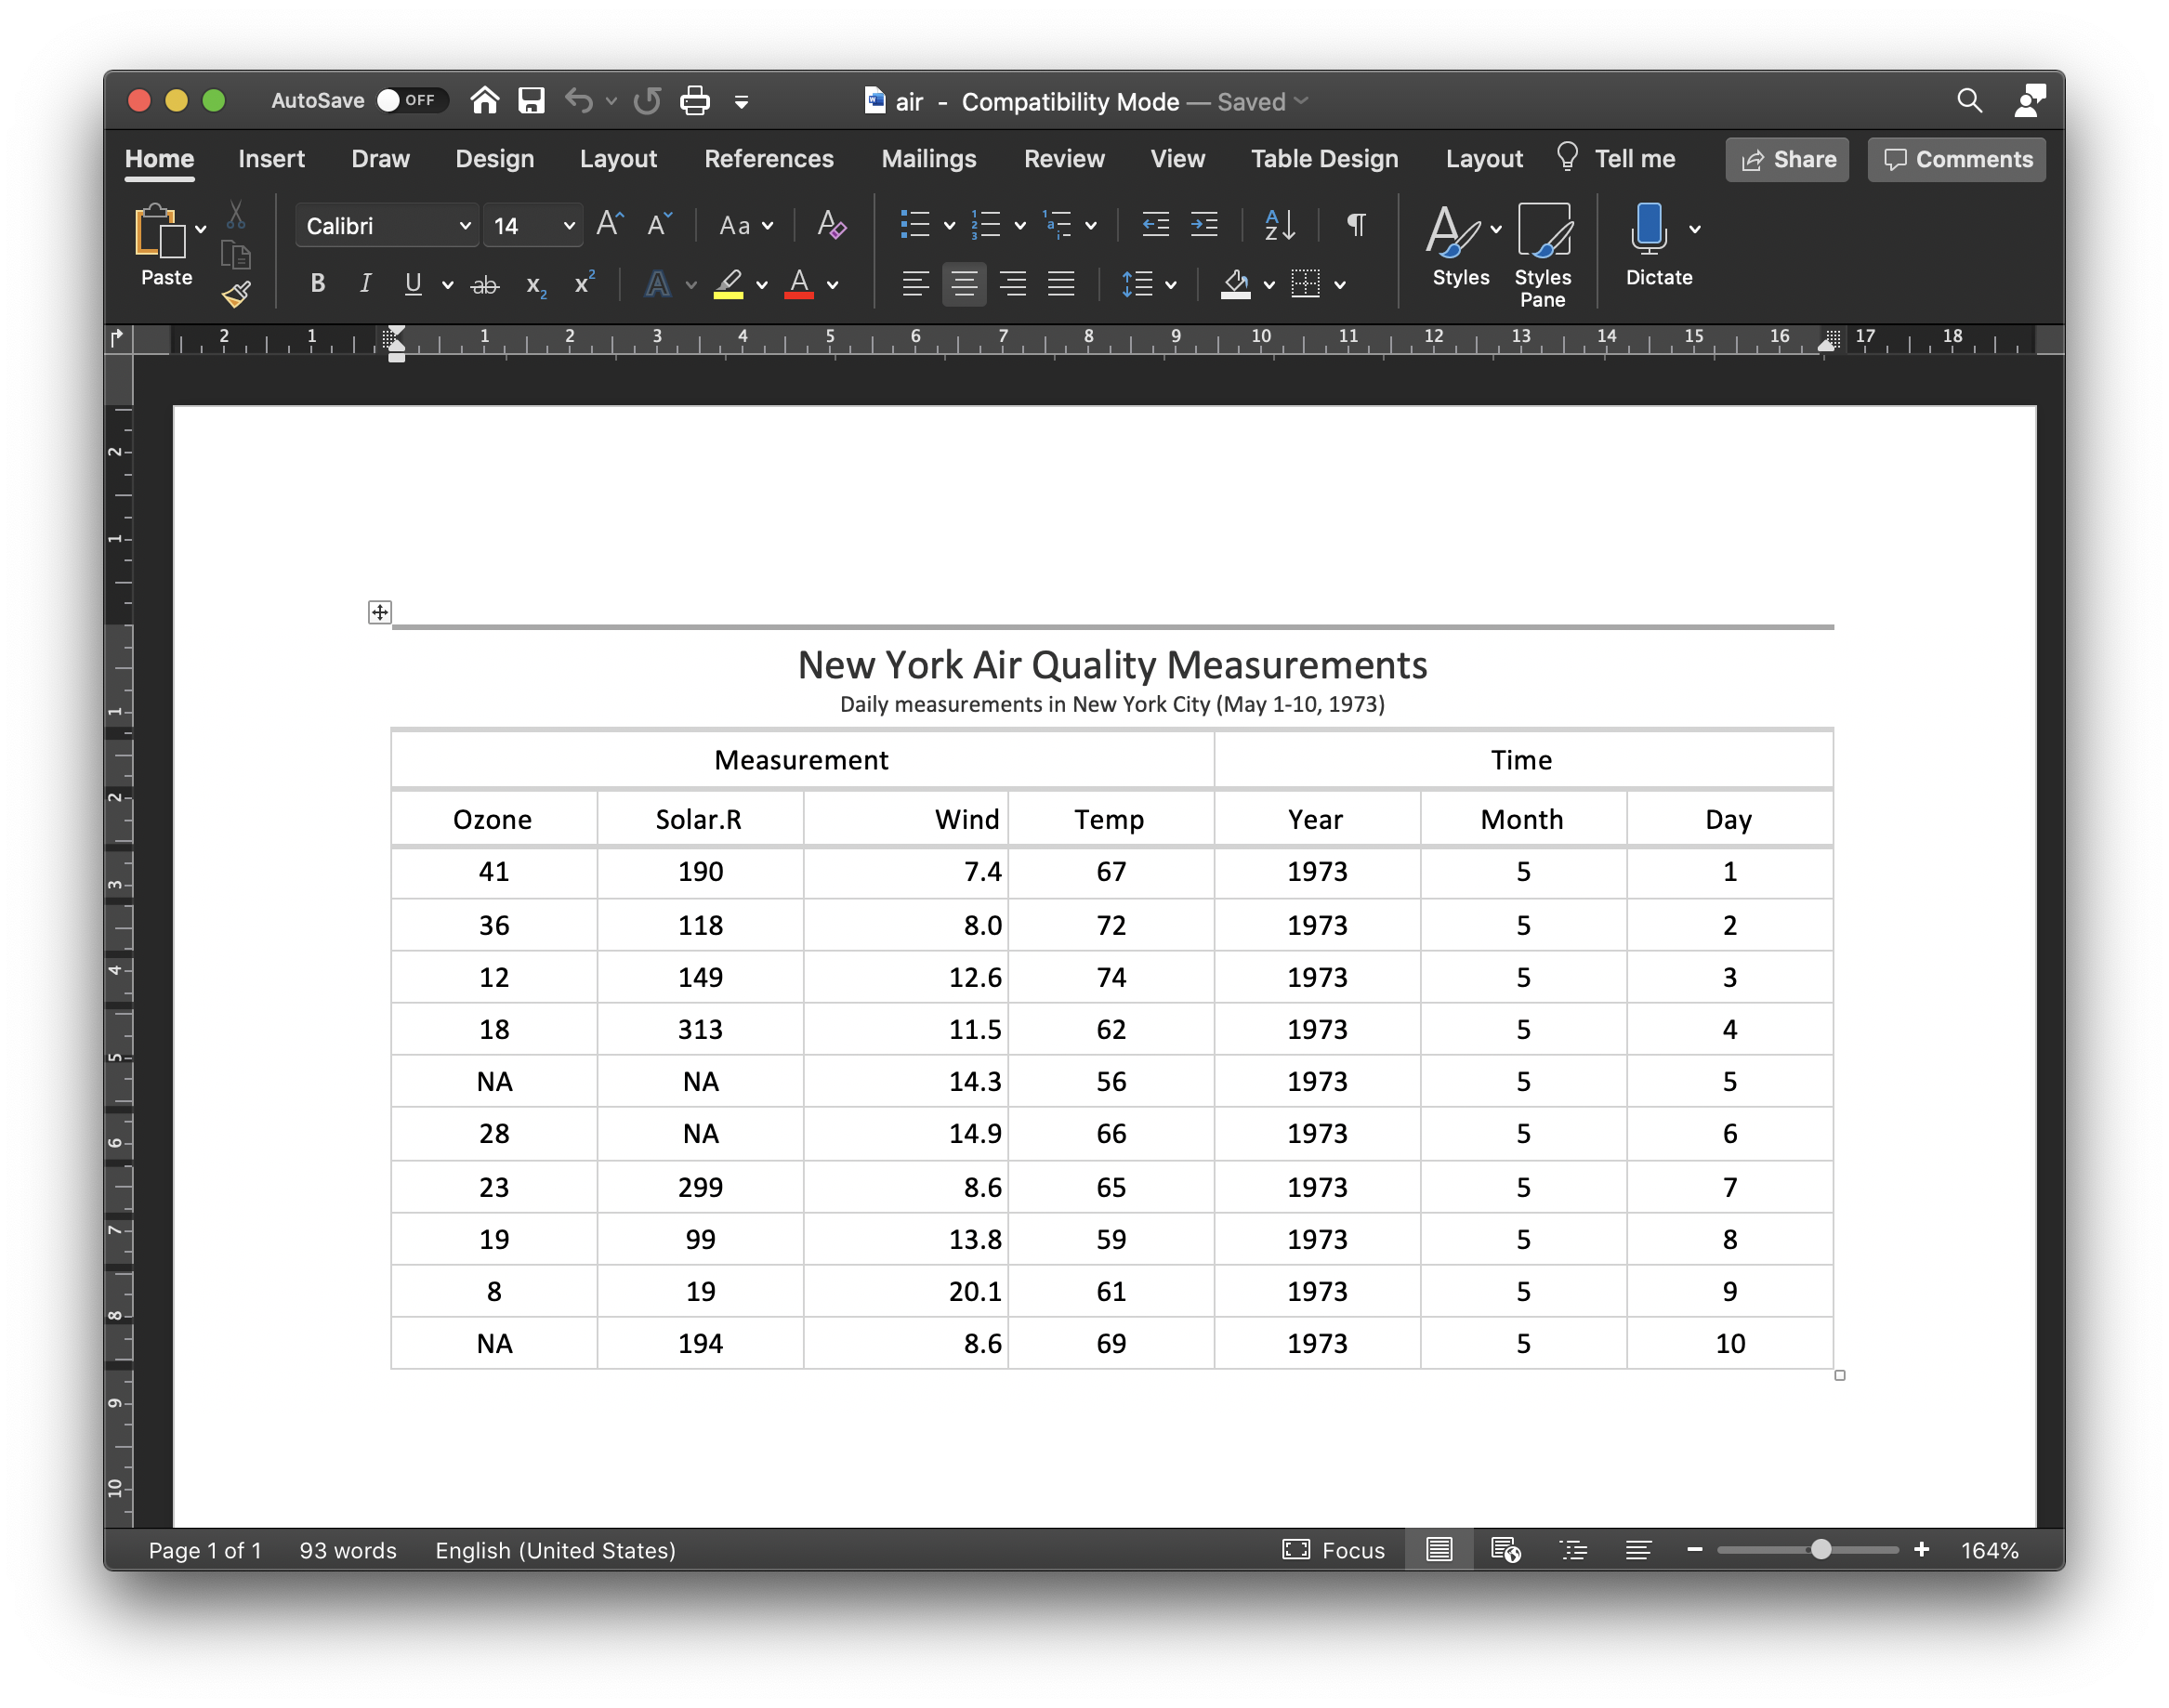
Sorry this took well over a year but a fix is now in place (#638) in the development version of gt. I tried the code again and opened the RTF in Word. Here is a screenshot.

air_quality_rtf

Sign up for free to join this conversation on GitHub. Already have an account? Sign in to comment
Projects
None yet
Development

No branches or pull requests

2 participants