These are ongoing notes for the Runrig pilot project with Richland Gro-op, seeking to develop and deploy targeted technology interventions that will benefit Richland Gro-Op's crop planning and auditing procedures. They are based, initially, on our Apr 19 meeting with Jess Hudson of Richland Gro-Op and the OSU Microfarm Project, as well as an earlier interview as a part of the Skywoman MAIA Project.
These are the primary software interventions we've identified that could have near-term benefits for Richland Gro-Op's crop planning and auditing procedures.
- Early Warning System: An auditing dashboard that reports when and where (in terms of relative urgency) an on-site farm visit or other action may be required, updated regularly with crop assessments on each farm through a combination of automated, manual and verbal survey submissions.
- Stretch goal: an array of networked temp and soil moisture sensors on each of the farms that can feed into the early warning system.
- Dynamic Yield Coefficients: A reliable yet flexible table of yield coefficients (ie, pounds per foot) that can be fed into the crop plan from a global source of known values, but adjusted locally given conditions or updated knowledge.
This is very rough, but to give a basic idea of what we'd like to achieve and when.
- Late April / early May: Further discovery to determine effectiveness of the proposed interventions (above); developing a scope of work for funded development; coordination of a volunteer-based hackathon with Skywoman's Design & Tech Incubator.
- Mid-May: Host Skywoman DTI hackathon and deploy a prototype of the proposed interventions; review any other proposed interventions that come out of discovery and/or the hackathon itself; determine feasibility of further funding.
- June onward: Regardless of funding, provide a production-ready MVP of the proposed interventions; based on available funding, extend key features, provide integrations with more mature platforms (eg, Qrop, farmOS, etc), and improve the overall resilience and longevity of the system.
Below is an outline of proposed features for the interventions above. Although they may not be "requirements" in the strictest sense, they can serve as "gestures" towards a few potential outcomes, as we iterate on a practicable solution.
- Display the status of a given crop succession, or specific crops earmarked for a pending customer order, using "red/yellow/green" color coding:
- 🟢 = On-track according to recent assessments; no audit recommended.
- 🟡 = Lacking recent assessments, but presumed on-track; audit when convenient.
- 🔴 = Negative indicators in crop assessments, or assessments have not been received within acceptable time range; on-site audit strongly recommended.
- In general, this is less about replacing on-site visits and more about:
- where to look,
- what to look for, and
- providing more lead time for remedial actions.
- Automated assessments
- Time duration since last recorded assessment of any kind, eg:
- 3 days since last assessment = 🟢
- 1 week since last assessment = 🟡
- 3 weeks since last assessment = 🔴
- Quantitative metrics:
- high-tunnel temp
- soil moisture (if they have a sensor)
- Qualitative metrics:
- soil moisture (finger testing, if they don't have a sensor)
- pest pressure
- Stretch goal: deploy networked temp & moisture sensors on the farms
- Time duration since last recorded assessment of any kind, eg:
- Manual and/or verbal assessments
- Use "red/yellow/green" language in regular communications
- Have growers submit qualitative assessments in those terms, on:
- soil moisture
- pest pressure
- general crop quality and health
- Coefficients are expressed as pounds of yield per bed foot (or row foot)
- eg:
yield-coefficient = 22 lbs / 10 bf = 2.2 - based on previous yield data, the seed company's estimates and general experience.
- must be able to adjust them for a particular crop or succession, from year-to-year, succession-to-succession, crop-to-crop
- eg:
- This is achievable with spreadsheets (or sheets within a spreadsheet), if carefully structured, at least for the short-term.
- One sheet containing these coefficients can be referenced in the main crop plan sheet.
- Intermediary sheet can be used to calibrate those coefficients further, if need-be, either for the crop plan as a whole, or specific successions.
- However... these linked sheets can prove brittle and susceptible to error.
- A NocoDB (ie, open-source AirTable) implementation may prove more efficient, reliable and sustainable in the middle- and long-term.
- It could be hosted by Runrig as portable, standardized data that can be adapted to other use cases in the future.
- Jamie & Nate Chang discussed a similar solution for 607 CSA / Catskills Agrarian Alliance
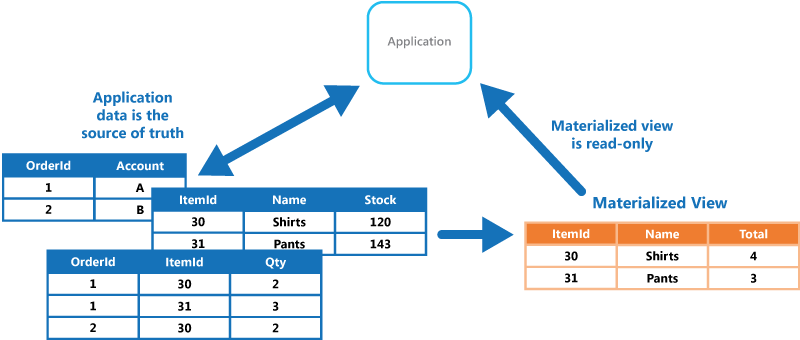
- Using a concept of "source-sink" tables or spreadsheets, where certain tables are considered "read-only" and are possible populated by automated tools or third-party API's, but used as an immutable source for downstream tables that can be modified, reformatted, or sorted according to the users needs.
- This guarantees integrity of the data, revision history and state rollbacks, while increasing flexibility and control by users. It's analogous to materialized views in database science.
- This could also provide a pathway for iterative development of more robust and sophisticated crop planning software.
- This specific use case could be adapted to fit more general needs, applicable to other farms and their needs (eg, 607/CAA, Blackbird, etc).
- Other implementations (in addition to spreadsheets or NocoDB) can and should be explored.
As summarized and illustrated by the MS Azure guide on database design patterns:
Generate prepopulated views over the data in one or more data stores when the data isn't ideally formatted for required query operations. This can help support efficient querying and data extraction, and improve application performance.