Skip to content
New issue

Have a question about this project? Sign up for a free GitHub account to open an issue and contact its maintainers and the community.

By clicking “Sign up for GitHub”, you agree to our terms of service and privacy statement. We’ll occasionally send you account related emails.

Already on GitHub? Sign in to your account

rust-analyzer is slow to compile #1987

Closed
matklad opened this issue Oct 10, 2019 · 58 comments
Closed

rust-analyzer is slow to compile #1987

matklad opened this issue Oct 10, 2019 · 58 comments
Labels
E-hard fun A technically challenging issue with high impact

Comments

@matklad
Copy link
Member

matklad commented Oct 10, 2019

Both ra_hir and ra_ide_api are really slow to compiler, which makes fix & test loop rather frustrating. Note that tests are extremely fast themselves, it's compile time that hurts us badly.

We need to do something with it...

@matklad matklad added E-hard fun A technically challenging issue with high impact labels Oct 10, 2019
@lnicola
Copy link
Member

lnicola commented Oct 10, 2019

image

Codegen seems to be taking an awful lot of time...

With debug=0:

image

But overall that's just a tiny improvement.

@kjeremy
Copy link
Contributor

kjeremy commented Oct 10, 2019

At the moment we carry around 2 versions of winapi which adds over 30 seconds to my build. I can get it down to (I think) one version of 0.2.8 being held back by mio.

@kjeremy
Copy link
Contributor

kjeremy commented Oct 10, 2019

@inicola is that cargo timings with build? 88s to generate metadata on ra_hir?

@lnicola
Copy link
Member

lnicola commented Oct 10, 2019

Yeah, and 102s by default. Maybe there's a lot of generic code?

@matklad
Copy link
Member Author

matklad commented Oct 10, 2019

Hm, that reminds me that we should set debug = 1 for the dev profile, to save some disk space...

@lnicola
Copy link
Member

lnicola commented Oct 10, 2019

Another interesting thing is that I tried to use lld. Even though it helped quite a lot on other projects, it seems to make no difference here.

@lnicola
Copy link
Member

lnicola commented Oct 10, 2019

Some random -Z self-profile measurements, which don't tell us anything new:

ra_hir:

+-----------------------------------------------+-----------+-----------------+------------+------------+--------------+-----------------------+
| Item                                          | Self time | % of total time | Item count | Cache hits | Blocked time | Incremental load time |
+-----------------------------------------------+-----------+-----------------+------------+------------+--------------+-----------------------+
| LLVM_module_optimize_module_passes            | 129.32s   | 35.794          | 199        | 0          | 0.00ns       | 0.00ns                |
+-----------------------------------------------+-----------+-----------------+------------+------------+--------------+-----------------------+
| LLVM_thin_lto_optimize                        | 75.69s    | 20.950          | 199        | 0          | 0.00ns       | 0.00ns                |
+-----------------------------------------------+-----------+-----------------+------------+------------+--------------+-----------------------+
| LLVM_module_codegen_emit_obj                  | 55.74s    | 15.429          | 199        | 0          | 0.00ns       | 0.00ns                |
+-----------------------------------------------+-----------+-----------------+------------+------------+--------------+-----------------------+
| codegen_crate                                 | 36.53s    | 10.111          | 1          | 0          | 0.00ns       | 0.00ns                |
+-----------------------------------------------+-----------+-----------------+------------+------------+--------------+-----------------------+
| codegen_module                                | 16.45s    | 4.553           | 199        | 0          | 0.00ns       | 0.00ns                |
+-----------------------------------------------+-----------+-----------------+------------+------------+--------------+-----------------------+
| LLVM_thin_lto_import                          | 13.98s    | 3.869           | 199        | 0          | 0.00ns       | 0.00ns                |
+-----------------------------------------------+-----------+-----------------+------------+------------+--------------+-----------------------+
| LLVM_module_optimize_function_passes          | 6.76s     | 1.870           | 199        | 0          | 0.00ns       | 0.00ns                |
+-----------------------------------------------+-----------+-----------------+------------+------------+--------------+-----------------------+
| typeck_tables_of                              | 3.29s     | 0.910           | 2798       | 0          | 0.00ns       | 0.00ns                |
+-----------------------------------------------+-----------+-----------------+------------+------------+--------------+-----------------------+
| LLVM_module_codegen_make_bitcode              | 2.61s     | 0.723           | 199        | 0          | 0.00ns       | 0.00ns                |
+-----------------------------------------------+-----------+-----------------+------------+------------+--------------+-----------------------+
| evaluate_obligation                           | 1.35s     | 0.374           | 79783      | 0          | 0.00ns       | 0.00ns                |
+-----------------------------------------------+-----------+-----------------+------------+------------+--------------+-----------------------+
| monomorphization_collector_graph_walk         | 1.04s     | 0.289           | 1          | 0          | 0.00ns       | 0.00ns                |
+-----------------------------------------------+-----------+-----------------+------------+------------+--------------+-----------------------+

ra_ide_api:

+-----------------------------------------------+-----------+-----------------+------------+------------+--------------+-----------------------+
| Item                                          | Self time | % of total time | Item count | Cache hits | Blocked time | Incremental load time |
+-----------------------------------------------+-----------+-----------------+------------+------------+--------------+-----------------------+
| LLVM_module_optimize_module_passes            | 166.80s   | 35.059          | 305        | 0          | 0.00ns       | 0.00ns                |
+-----------------------------------------------+-----------+-----------------+------------+------------+--------------+-----------------------+
| LLVM_thin_lto_optimize                        | 96.95s    | 20.377          | 305        | 0          | 0.00ns       | 0.00ns                |
+-----------------------------------------------+-----------+-----------------+------------+------------+--------------+-----------------------+
| LLVM_module_codegen_emit_obj                  | 69.66s    | 14.642          | 305        | 0          | 0.00ns       | 0.00ns                |
+-----------------------------------------------+-----------+-----------------+------------+------------+--------------+-----------------------+
| codegen_crate                                 | 50.28s    | 10.568          | 1          | 0          | 0.00ns       | 0.00ns                |
+-----------------------------------------------+-----------+-----------------+------------+------------+--------------+-----------------------+
| LLVM_thin_lto_import                          | 26.33s    | 5.533           | 305        | 0          | 0.00ns       | 0.00ns                |
+-----------------------------------------------+-----------+-----------------+------------+------------+--------------+-----------------------+
| codegen_module                                | 25.05s    | 5.266           | 305        | 0          | 0.00ns       | 0.00ns                |
+-----------------------------------------------+-----------+-----------------+------------+------------+--------------+-----------------------+
| LLVM_module_optimize_function_passes          | 10.47s    | 2.200           | 305        | 0          | 0.00ns       | 0.00ns                |
+-----------------------------------------------+-----------+-----------------+------------+------------+--------------+-----------------------+
| LLVM_module_codegen_make_bitcode              | 3.14s     | 0.660           | 305        | 0          | 0.00ns       | 0.00ns                |
+-----------------------------------------------+-----------+-----------------+------------+------------+--------------+-----------------------+
| normalize_projection_ty                       | 1.84s     | 0.386           | 15240      | 0          | 0.00ns       | 0.00ns                |
+-----------------------------------------------+-----------+-----------------+------------+------------+--------------+-----------------------+
| monomorphization_collector_graph_walk         | 1.74s     | 0.367           | 1          | 0          | 0.00ns       | 0.00ns                |
+-----------------------------------------------+-----------+-----------------+------------+------------+--------------+-----------------------+
| evaluate_obligation                           | 1.46s     | 0.307           | 74165      | 0          | 0.00ns       | 0.00ns                |
+-----------------------------------------------+-----------+-----------------+------------+------------+--------------+-----------------------+
| codegen_fulfill_obligation                    | 1.46s     | 0.307           | 23807      | 0          | 0.00ns       | 0.00ns                |
+-----------------------------------------------+-----------+-----------------+------------+------------+--------------+-----------------------+

@lnicola
Copy link
Member

lnicola commented Oct 10, 2019

chrome_profiler.zip

@matklad matklad changed the title rust-analyzer is slow to compiler rust-analyzer is slow to compile Oct 11, 2019
@ice1000
Copy link
Contributor

ice1000 commented Oct 12, 2019

Will further modularization help?

@kjeremy
Copy link
Contributor

kjeremy commented Oct 16, 2019

Might be relevant for cargo test rust-lang/cargo#7514

@matklad
Copy link
Member Author

matklad commented Oct 28, 2019

On thing that helps a bit is using lld:

λ cat ~/.cargo/config 
[build]
rustflags = [ "-C", "link-arg=-fuse-ld=lld" ]⏎

@lnicola
Copy link
Member

lnicola commented Oct 28, 2019

That's strange, I tried it a couple of times, and it made zero difference for RA. It does help a lot on other projects.

@Matthias247
Copy link
Contributor

Since I now got a fancy desktop PC which is not generally slow here is another observation: The compile cycle does barely use any parallelism.

The following is the CPU utilization for a small edit and recompile inside a file in ra_hir on a 12 core CPU:

The whole cargo build for this picture took 12s - so it's not super annoying. But it looks like it could go a lot faster if more resources are actually used. But I guess that is more likely a rustc than an actual rust-analyzer issue - unless the project is restructured to be more suitable to for parallelism (crates which are not that dependend on each other?).

@lnicola
Copy link
Member

lnicola commented Nov 10, 2019

I think small, incremental edits parallelize inherently worse, because there's less to compile. Still, it's not so bad:

image

But it's surprising how much debug info slows things down. Same scenario, touch crates/ra_hir/src/db.rs; cargo build --release -p ra_lsp_server, but with debug = 0 instead of 1:

image

@jens1o
Copy link
Contributor

jens1o commented Nov 10, 2019

How could one disable debug=0 constantly without an extra flag without having to constantly stash the change in Cargo.toml as soon as there's an update?

@lnicola
Copy link
Member

lnicola commented Nov 10, 2019

That's how, but you might not need to stash that often.

I generally use pull --rebase with autostash, so it doesn't come up most of the time.

@matklad
Copy link
Member Author

matklad commented Nov 10, 2019

Hm, should we put debug=0 into Cargo.toml? I think I personally can live with that, especially if it makes printf debugging faster :-)

We loose line numbers in backtraces, but I think I rarely look at backtraces (but we should retain debug=1 for releases, so that folks can get a useful backtraces from the debugger).

On the side note, one of the things I miss most from IntelliJ is the ability to colorize and linkify backtraces. If we could link rust::paths from backtraces to functions, that would be sooo helpful.

@lnicola
Copy link
Member

lnicola commented Nov 10, 2019

Hm, should we put debug=0 into Cargo.toml? I think I personally can live with that, especially if it makes printf debugging faster :-)

That depends on whether you're testing on debug or release builds. Re backtraces, unfortunately rust-analyzer pretty much never crashes for me. I've used the debug info for profiling, but I can enable it manually.

@jens1o
Copy link
Contributor

jens1o commented Nov 11, 2019

Well, I use rust-analyzer always with install-ra, which means afaic that I use release all the times. :/

@matklad
Copy link
Member Author

matklad commented Mar 9, 2020

It feels like it became significantly works for --release since we've introduced ra_ide_db crate, because now we repeatedly monomorphise hir for the same database in different crates.

@matklad
Copy link
Member Author

matklad commented Mar 13, 2020

Some measurements from today and a time before ra_ide_db introduction https://gist.github.com/matklad/9657836aa0a9ad226a95b6f18d55b3fc

image

image

:( :( :(

@lnicola
Copy link
Member

lnicola commented Mar 13, 2020

I haven't looked over the code (not sure what the polymorphic code is), but is there a way to avoid that, maybe by introducing monomorphic wrappers?

@matklad
Copy link
Member Author

matklad commented Mar 13, 2020

So "introducing monomorphic wrappers" is exactly what ra_ide_db did, and it made things worse.

Ie, making DB non-generic does not work (or, rather, makes things worse), because all functions are still generic, but are now monomorphised in each crate that uses a non-generic database.

@lnicola
Copy link
Member

lnicola commented Mar 13, 2020

because all functions are still generic

Do you mean things like impl<'db, DB: HirDatabase> Semantics<'db, DB> that are still generic over the database? Can they use RootDatabase instead?

@matklad
Copy link
Member Author

matklad commented Mar 13, 2020

That as well, but mostly all query definitions, like infer_query.

@matklad
Copy link
Member Author

matklad commented Mar 13, 2020

(though, I still haven't really debugged this properly, my understanding of how monomorphisation happens might be wrong)

@lnicola
Copy link
Member

lnicola commented Mar 13, 2020

I can't try right now, but I'm curious what happens on a non-LTO build. It seemed to me that half of the build time was spent during linking.

@kjeremy
Copy link
Contributor

kjeremy commented May 15, 2020

Maybe cargo-llvm-lines could help us identify some hot spots.

@lnicola
Copy link
Member

lnicola commented May 15, 2020

Some results on the rust-analyzer crate:

  Lines        Copies         Function name
  -----        ------         -------------
 483559 (100%)  15673 (100%)  (TOTAL)
  15650 (3.2%)   1263 (8.1%)  core::ptr::drop_in_place
  13702 (2.8%)     34 (0.2%)  alloc::raw_vec::RawVec<T,A>::grow
  11638 (2.4%)    182 (1.2%)  core::result::Result<T,E>::map
  11547 (2.4%)    178 (1.1%)  core::result::Result<T,E>::map_err
   8855 (1.8%)     35 (0.2%)  rust_analyzer::main_loop::result_to_task
   8249 (1.7%)     59 (0.4%)  <serde_json::value::de::MapDeserializer as serde::de::MapAccess>::next_key_seed
   7463 (1.5%)     58 (0.4%)  serde_json::value::de::visit_object
   7389 (1.5%)     32 (0.2%)  serde::ser::Serializer::collect_seq
   7324 (1.5%)     35 (0.2%)  rust_analyzer::main_loop::PoolDispatcher::parse
   7063 (1.5%)     73 (0.5%)  core::iter::traits::iterator::Iterator::try_fold
   6803 (1.4%)    131 (0.8%)  core::result::Result<T,E>::unwrap_or_else
   6173 (1.3%)     48 (0.3%)  serde_json::value::de::visit_array
   5375 (1.1%)     68 (0.4%)  <serde_json::value::ser::SerializeMap as serde::ser::SerializeMap>::serialize_value
   5214 (1.1%)     88 (0.6%)  core::option::Option<T>::map
   4465 (0.9%)     19 (0.1%)  hashbrown::raw::RawTable<T>::rehash_in_place
   4340 (0.9%)     35 (0.2%)  serde_json::value::de::<impl serde::de::Deserializer for serde_json::value::Value>::deserialize_struct
   3771 (0.8%)     30 (0.2%)  rust_analyzer::main_loop::PoolDispatcher::on
   3728 (0.8%)     49 (0.3%)  <serde_json::value::de::SeqDeserializer as serde::de::SeqAccess>::next_element_seed
   3429 (0.7%)     49 (0.3%)  <serde_json::value::de::MapDeserializer as serde::de::MapAccess>::next_value_seed
   3332 (0.7%)     58 (0.4%)  core::option::Option<T>::ok_or_else
   3193 (0.7%)    145 (0.9%)  serde_json::value::to_value
   3141 (0.6%)     30 (0.2%)  lsp_server::msg::Request::extract
   3083 (0.6%)     39 (0.2%)  alloc::vec::Vec<T>::extend_desugared
   3059 (0.6%)     19 (0.1%)  hashbrown::raw::RawTable<T>::resize
   2856 (0.6%)     24 (0.2%)  hashbrown::raw::RawTable<T>::find
   2732 (0.6%)     60 (0.4%)  core::ptr::swap_nonoverlapping_one
   2720 (0.6%)     68 (0.4%)  serde::ser::SerializeMap::serialize_entry
   2655 (0.5%)     59 (0.4%)  <serde_json::value::de::BorrowedCowStrDeserializer as serde::de::Deserializer>::deserialize_any
   2625 (0.5%)     31 (0.2%)  <alloc::vec::Vec<T> as alloc::vec::SpecExtend<T,I>>::from_iter
   2314 (0.5%)      1 (0.0%)  rust_analyzer::cli::analysis_stats::analysis_stats
   2290 (0.5%)     80 (0.5%)  alloc::alloc::box_free
   2229 (0.5%)     45 (0.3%)  crossbeam_channel::context::Context::with::{{closure}}
   2133 (0.4%)     27 (0.2%)  core::iter::traits::exact_size::ExactSizeIterator::len
   2091 (0.4%)     41 (0.3%)  alloc::raw_vec::RawVec<T,A>::current_memory
   2065 (0.4%)     59 (0.4%)  serde::de::Visitor::visit_string

@lnicola
Copy link
Member

lnicola commented May 15, 2020

And ra_ide_db:

    Finished dev [unoptimized] target(s) in 1m 05s
  Lines        Copies         Function name
  -----        ------         -------------
1620843 (100%)  62960 (100%)  (TOTAL)
  61069 (3.8%)   5316 (8.4%)  core::ptr::drop_in_place
  51419 (3.2%)     47 (0.1%)  salsa::derived::slot::Slot<DB,Q,MP>::read_upgrade
  48978 (3.0%)     94 (0.1%)  salsa::derived::slot::Slot<DB,Q,MP>::probe
  36812 (2.3%)    561 (0.9%)  core::result::Result<T,E>::map_err
  35226 (2.2%)    636 (1.0%)  core::option::Option<T>::map
  34771 (2.1%)     47 (0.1%)  <salsa::derived::slot::Slot<DB,Q,MP> as salsa::dependency::DatabaseSlot<DB>>::maybe_changed_since
  34658 (2.1%)     86 (0.1%)  alloc::raw_vec::RawVec<T,A>::grow
  30141 (1.9%)    498 (0.8%)  core::option::Option<T>::ok_or_else
  26176 (1.6%)    571 (0.9%)  core::ptr::swap_nonoverlapping_one
  19537 (1.2%)    249 (0.4%)  alloc::sync::Arc<T>::new
  19045 (1.2%)    196 (0.3%)  core::iter::traits::iterator::Iterator::try_fold
  18565 (1.1%)     79 (0.1%)  hashbrown::raw::RawTable<T>::rehash_in_place
  18207 (1.1%)    153 (0.2%)  hashbrown::raw::RawTable<T>::find
  18146 (1.1%)     43 (0.1%)  std::sync::mpsc::stream::Packet<T>::abort_selection
  17757 (1.1%)    343 (0.5%)  core::result::Result<T,E>::unwrap_or_else
  16966 (1.0%)     47 (0.1%)  salsa::derived::slot::PanicGuard<DB,Q,MP>::overwrite_placeholder
  13416 (0.8%)     43 (0.1%)  std::sync::mpsc::Sender<T>::send
  12719 (0.8%)     79 (0.1%)  hashbrown::raw::RawTable<T>::resize
  12389 (0.8%)     43 (0.1%)  std::sync::mpsc::shared::Packet<T>::try_recv
  12304 (0.8%)    342 (0.5%)  alloc::sync::Arc<T>::drop_slow
  12210 (0.8%)     47 (0.1%)  salsa::derived::slot::Slot<DB,Q,MP>::sweep
  11844 (0.7%)     47 (0.1%)  salsa::derived::slot::Memo<DB,Q>::validate_memoized_value
  11610 (0.7%)     43 (0.1%)  std::sync::mpsc::Receiver<T>::recv
  11452 (0.7%)    166 (0.3%)  core::result::Result<T,E>::map
  11395 (0.7%)     43 (0.1%)  std::sync::mpsc::stream::Packet<T>::try_recv
  11000 (0.7%)     44 (0.1%)  smallvec::SmallVec<A>::try_grow
  10241 (0.6%)     77 (0.1%)  hashbrown::raw::RawTable<T>::new_uninitialized
  10017 (0.6%)    665 (1.1%)  core::ptr::read
   9933 (0.6%)     77 (0.1%)  hashbrown::raw::RawTable<T>::try_with_capacity
   9768 (0.6%)     44 (0.1%)  std::sync::mpsc::sync::Packet<T>::drop_port
   9729 (0.6%)     47 (0.1%)  salsa::lru::LruData<Node>::insert_new
   9682 (0.6%)     47 (0.1%)  salsa::lru::Lru<Node>::record_use
   9458 (0.6%)    291 (0.5%)  <alloc::vec::Vec<T> as core::ops::index::IndexMut<I>>::index_mut
   9429 (0.6%)    347 (0.6%)  alloc::alloc::box_free
   9417 (0.6%)     43 (0.1%)  std::sync::mpsc::stream::Packet<T>::recv
   9417 (0.6%)     43 (0.1%)  std::sync::mpsc::sync::Packet<T>::recv
   9027 (0.6%)    177 (0.3%)  alloc::raw_vec::RawVec<T,A>::current_memory
   8930 (0.6%)     47 (0.1%)  salsa::lru::LruData<Node>::promote_yellow_to_green
   8624 (0.5%)     44 (0.1%)  <std::sync::mpsc::shared::Packet<T> as core::ops::drop::Drop>::drop
   8453 (0.5%)     47 (0.1%)  salsa::runtime::Runtime<DB>::execute_query_implementation
   8154 (0.5%)    196 (0.3%)  <ra_ide_db::RootDatabase as salsa::Database>::salsa_event
   8137 (0.5%)    158 (0.3%)  hashbrown::raw::RawTable<T>::rehash_in_place::{{closure}}
   8020 (0.5%)    564 (0.9%)  salsa::derived::slot::Slot<DB,Q,MP>::probe::{{closure}}
   8004 (0.5%)     43 (0.1%)  std::sync::mpsc::oneshot::Packet<T>::try_recv
   7913 (0.5%)     47 (0.1%)  <salsa::derived::DerivedStorage<DB,Q,MP> as salsa::plumbing::QueryStorageOps<DB,Q>>::try_fetch
   7664 (0.5%)      1 (0.0%)  ra_ide_db::change::<impl ra_ide_db::RootDatabase>::per_query_memory_usage
   7481 (0.5%)    324 (0.5%)  core::mem::replace
   7396 (0.5%)     43 (0.1%)  std::sync::mpsc::sync::Packet<T>::wakeup_senders
   7391 (0.5%)     15 (0.0%)  salsa::interned::InternedStorage<DB,Q>::intern_index
   7360 (0.5%)    320 (0.5%)  core::fmt::ArgumentV1::new
   7285 (0.4%)     47 (0.1%)  salsa::derived::slot::Slot<DB,Q,MP>::register_with_in_progress_thread
   7184 (0.4%)    342 (0.5%)  <alloc::sync::Arc<T> as core::ops::drop::Drop>::drop
   7052 (0.4%)     43 (0.1%)  std::sync::mpsc::shared::Packet<T>::abort_selection
   6840 (0.4%)    342 (0.5%)  core::alloc::layout::Layout::for_value
   6708 (0.4%)     43 (0.1%)  std::sync::mpsc::shared::Packet<T>::recv
   6593 (0.4%)     43 (0.1%)  std::sync::mpsc::shared::Packet<T>::send
   6399 (0.4%)     79 (0.1%)  hashbrown::raw::RawTable<T>::reserve_rehash
   6391 (0.4%)     77 (0.1%)  hashbrown::raw::RawTable<T>::find_insert_slot
   6364 (0.4%)     43 (0.1%)  std::sync::mpsc::stream::Packet<T>::decrement
   6149 (0.4%)     43 (0.1%)  std::sync::mpsc::sync::wait_timeout_receiver
   6134 (0.4%)     72 (0.1%)  hashbrown::rustc_entry::<impl hashbrown::map::HashMap<K,V,S>>::rustc_entry
   6116 (0.4%)     44 (0.1%)  std::sync::mpsc::spsc_queue::Queue<T,ProducerAddition,ConsumerAddition>::pop
   6028 (0.4%)     44 (0.1%)  <std::sync::mpsc::stream::Packet<T> as core::ops::drop::Drop>::drop
   5977 (0.4%)     43 (0.1%)  std::sync::mpsc::oneshot::Packet<T>::recv
   5848 (0.4%)     43 (0.1%)  std::sync::mpsc::shared::Packet<T>::decrement
   5734 (0.4%)     47 (0.1%)  salsa::lru::LruData<Node>::promote_red_to_green
   5687 (0.4%)     47 (0.1%)  salsa::derived::slot::Slot<DB,Q,MP>::read
   5635 (0.3%)    670 (1.1%)  core::mem::maybe_uninit::MaybeUninit<T>::assume_init
   5547 (0.3%)     43 (0.1%)  std::sync::mpsc::oneshot::Packet<T>::upgrade
   5504 (0.3%)     43 (0.1%)  std::sync::mpsc::oneshot::Packet<T>::send
   5332 (0.3%)     43 (0.1%)  std::sync::mpsc::oneshot::Packet<T>::abort_selection
   5324 (0.3%)     44 (0.1%)  <std::sync::mpsc::sync::Packet<T> as core::ops::drop::Drop>::drop
   5226 (0.3%)     78 (0.1%)  <hashbrown::raw::RawIterRange<T> as core::iter::traits::iterator::Iterator>::next
   5205 (0.3%)    343 (0.5%)  alloc::boxed::Box<T>::into_unique
   4988 (0.3%)    344 (0.5%)  alloc::raw_vec::RawVec<T,A>::grow::{{closure}}
   4859 (0.3%)     43 (0.1%)  std::sync::mpsc::sync::wait
   4816 (0.3%)     43 (0.1%)  std::sync::mpsc::stream::Packet<T>::do_send
   4806 (0.3%)    178 (0.3%)  <alloc::raw_vec::RawVec<T,A> as core::ops::drop::Drop>::drop
   4773 (0.3%)     43 (0.1%)  std::sync::mpsc::spsc_queue::Queue<T,ProducerAddition,ConsumerAddition>::with_additions
   4753 (0.3%)     97 (0.2%)  core::iter::traits::iterator::Iterator::find::check::{{closure}}
   4601 (0.3%)     43 (0.1%)  std::sync::mpsc::sync::abort_selection
   4568 (0.3%)    571 (0.9%)  core::ptr::swap_nonoverlapping
   4429 (0.3%)     12 (0.0%)  rayon_core::join::join_context::{{closure}}
   4418 (0.3%)     47 (0.1%)  salsa::lru::LruData<Node>::record_use
   4371 (0.3%)     47 (0.1%)  salsa::derived::slot::Memo<DB,Q>::check_durability
   4269 (0.3%)     45 (0.1%)  <core::iter::adapters::zip::Zip<A,B> as core::iter::adapters::zip::ZipImpl<A,B>>::next
   4257 (0.3%)     43 (0.1%)  std::sync::mpsc::stream::Packet<T>::send
   4170 (0.3%)     94 (0.1%)  salsa::derived::slot::Slot<DB,Q,MP>::read_upgrade::{{closure}}
   4137 (0.3%)    470 (0.7%)  core::cell::UnsafeCell<T>::new
   4094 (0.3%)    178 (0.3%)  core::ptr::slice_from_raw_parts_mut
   4085 (0.3%)     43 (0.1%)  std::sync::mpsc::spsc_queue::Queue<T,ProducerAddition,ConsumerAddition>::alloc
   4059 (0.3%)     72 (0.1%)  hashbrown::raw::RawTable<T>::insert_no_grow
   4039 (0.2%)     90 (0.1%)  core::option::Option<T>::unwrap_or_else
   4002 (0.2%)    667 (1.1%)  core::intrinsics::copy_nonoverlapping
   4002 (0.2%)     95 (0.2%)  core::result::Result<T,E>::unwrap
   3984 (0.2%)     81 (0.1%)  alloc::vec::Vec<T>::push
   3948 (0.2%)    141 (0.2%)  <salsa::derived::slot::Slot<DB,Q,MP> as salsa::dependency::DatabaseSlot<DB>>::maybe_changed_since::{{closure}}
   3910 (0.2%)     44 (0.1%)  std::sync::mpsc::mpsc_queue::Queue<T>::pop
   3904 (0.2%)     47 (0.1%)  std::collections::hash::map::Entry<K,V>::or_insert_with
   3870 (0.2%)     43 (0.1%)  std::sync::mpsc::spsc_queue::Queue<T,ProducerAddition,ConsumerAddition>::push
   3825 (0.2%)    765 (1.2%)  core::mem::size_of
   3810 (0.2%)    617 (1.0%)  core::mem::manually_drop::ManuallyDrop<T>::new
   3747 (0.2%)     72 (0.1%)  std::collections::hash::map::map_entry
   3741 (0.2%)     43 (0.1%)  std::sync::mpsc::channel

I'm not sure how actionable these are.

@kjeremy
Copy link
Contributor

kjeremy commented May 15, 2020

Yeah... I was hoping it would show us if there were a lot of monomorphized things we could reduce.

@panstromek
Copy link

@lnicola @kjeremy Note that RawVec::grow, which is pretty high on both of these lists, was recently changed to be mostly non generic in rust-lang/rust#72013. Another similar optimization was done for iterator methods in rust-lang/rust#72166, so they now use try_fold less, which is also pretty high on these lists.

Both PRs reduced the number of llvm-ir lines generated and improved compile time. They will land on stable in next Rust release in July, so until that, you might want to measure with cargo-llvm-lines on nightly to account for these improvements 😉

@lnicola
Copy link
Member

lnicola commented Jun 12, 2020

@panstromek thanks for the heads-up. I ran it again on ra_ide_db, it seems worse?

ra_ide_db LLVM lines
  Lines           Copies        Function name
  -----           ------        -------------
  1664810 (100%)  65419 (100%)  (TOTAL)
    73271 (4.4%)   6095 (9.3%)  core::ptr::drop_in_place
    55793 (3.4%)     51 (0.1%)  salsa::derived::slot::Slot<DB,Q,MP>::read_upgrade
    53146 (3.2%)    102 (0.2%)  salsa::derived::slot::Slot<DB,Q,MP>::probe
    37731 (2.3%)     51 (0.1%)  <salsa::derived::slot::Slot<DB,Q,MP> as salsa::dependency::DatabaseSlot<DB>>::maybe_changed_since
    32628 (2.0%)    539 (0.8%)  core::option::Option<T>::ok_or_else
    30708 (1.8%)    534 (0.8%)  core::option::Option<T>::map
    28252 (1.7%)    616 (0.9%)  core::ptr::swap_nonoverlapping_one
    21528 (1.3%)    271 (0.4%)  alloc::sync::Arc<T>::new
    20210 (1.2%)     86 (0.1%)  hashbrown::raw::RawTable<T>::rehash_in_place
    19754 (1.2%)    166 (0.3%)  hashbrown::raw::RawTable<T>::find
    19411 (1.2%)     47 (0.1%)  std::sync::mpsc::stream::Packet<T>::abort_selection
    18755 (1.1%)    363 (0.6%)  core::result::Result<T,E>::unwrap_or_else
    18410 (1.1%)     51 (0.1%)  salsa::derived::slot::PanicGuard<DB,Q,MP>::overwrite_placeholder
    17549 (1.1%)    180 (0.3%)  core::iter::traits::iterator::Iterator::try_fold
    15720 (0.9%)    236 (0.4%)  core::result::Result<T,E>::map_err
    14845 (0.9%)    371 (0.6%)  <alloc::sync::Weak<T> as core::ops::drop::Drop>::drop
    14664 (0.9%)     47 (0.1%)  std::sync::mpsc::Sender<T>::send
    13846 (0.8%)     86 (0.1%)  hashbrown::raw::RawTable<T>::resize
    13364 (0.8%)    371 (0.6%)  alloc::sync::Weak<T>::inner
    12852 (0.8%)     51 (0.1%)  salsa::derived::slot::Memo<DB,Q>::validate_memoized_value
    12736 (0.8%)     49 (0.1%)  salsa::derived::slot::Slot<DB,Q,MP>::sweep
    12690 (0.8%)     47 (0.1%)  std::sync::mpsc::Receiver<T>::recv
    12658 (0.8%)     47 (0.1%)  std::sync::mpsc::shared::Packet<T>::try_recv
    12384 (0.7%)     48 (0.1%)  std::sync::mpsc::sync::Packet<T>::drop_port
    12032 (0.7%)     47 (0.1%)  std::sync::mpsc::stream::Packet<T>::try_recv
    12000 (0.7%)     48 (0.1%)  smallvec::SmallVec<A>::try_grow
    11515 (0.7%)     47 (0.1%)  std::sync::mpsc::sync::Packet<T>::wakeup_senders
    11303 (0.7%)     89 (0.1%)  alloc::raw_vec::RawVec<T,A>::grow_amortized
    11039 (0.7%)     83 (0.1%)  hashbrown::raw::RawTable<T>::new_uninitialized
    10815 (0.6%)    718 (1.1%)  core::ptr::read
    10726 (0.6%)    173 (0.3%)  core::alloc::layout::Layout::array
    10707 (0.6%)     83 (0.1%)  hashbrown::raw::RawTable<T>::try_with_capacity
    10557 (0.6%)     51 (0.1%)  salsa::lru::LruData<Node>::insert_new
    10353 (0.6%)     51 (0.1%)  salsa::lru::Lru<Node>::record_use
    10293 (0.6%)     47 (0.1%)  std::sync::mpsc::stream::Packet<T>::recv
    10239 (0.6%)    377 (0.6%)  alloc::alloc::box_free
     9823 (0.6%)     47 (0.1%)  std::sync::mpsc::sync::Packet<T>::recv
     9690 (0.6%)     51 (0.1%)  salsa::lru::LruData<Node>::promote_yellow_to_green
     9639 (0.6%)    189 (0.3%)  alloc::raw_vec::RawVec<T,A>::current_memory
     9169 (0.6%)     51 (0.1%)  salsa::runtime::Runtime<DB>::execute_query_implementation
     9030 (0.5%)    212 (0.3%)  <ra_ide_db::RootDatabase as salsa::Database>::salsa_event
     8976 (0.5%)     48 (0.1%)  <std::sync::mpsc::shared::Packet<T> as core::ops::drop::Drop>::drop
     8858 (0.5%)    172 (0.3%)  hashbrown::raw::RawTable<T>::rehash_in_place::{{closure}}
     8700 (0.5%)    612 (0.9%)  salsa::derived::slot::Slot<DB,Q,MP>::probe::{{closure}}
     8579 (0.5%)     51 (0.1%)  <salsa::derived::DerivedStorage<DB,Q,MP> as salsa::plumbing::QueryStorageOps<DB,Q>>::try_fetch
     8468 (0.5%)     47 (0.1%)  std::sync::mpsc::oneshot::Packet<T>::try_recv
     8380 (0.5%)     17 (0.0%)  salsa::interned::InternedStorage<DB,Q>::intern_index
     8072 (0.5%)    350 (0.5%)  core::mem::replace
     7906 (0.5%)      1 (0.0%)  ra_ide_db::change::<impl ra_ide_db::RootDatabase>::per_query_memory_usage
     7905 (0.5%)     51 (0.1%)  salsa::derived::slot::Slot<DB,Q,MP>::register_with_in_progress_thread
     7843 (0.5%)    341 (0.5%)  core::fmt::ArgumentV1::new
     7420 (0.4%)    371 (0.6%)  core::alloc::layout::Layout::for_value
     7332 (0.4%)     47 (0.1%)  std::sync::mpsc::shared::Packet<T>::recv
     7285 (0.4%)     47 (0.1%)  std::sync::mpsc::shared::Packet<T>::abort_selection
     6966 (0.4%)     86 (0.1%)  hashbrown::raw::RawTable<T>::reserve_rehash
     6889 (0.4%)     83 (0.1%)  hashbrown::raw::RawTable<T>::find_insert_slot
     6721 (0.4%)     47 (0.1%)  std::sync::mpsc::sync::wait_timeout_receiver
     6666 (0.4%)     78 (0.1%)  hashbrown::rustc_entry::<impl hashbrown::map::HashMap<K,V,S>>::rustc_entry
     6363 (0.4%)     47 (0.1%)  std::sync::mpsc::shared::Packet<T>::send
     6288 (0.4%)     48 (0.1%)  <std::sync::mpsc::stream::Packet<T> as core::ops::drop::Drop>::drop
     6251 (0.4%)     47 (0.1%)  std::sync::mpsc::oneshot::Packet<T>::recv
     6251 (0.4%)     47 (0.1%)  std::sync::mpsc::stream::Packet<T>::decrement
     6222 (0.4%)     51 (0.1%)  salsa::lru::LruData<Node>::promote_red_to_green
     6171 (0.4%)     51 (0.1%)  salsa::derived::slot::Slot<DB,Q,MP>::read
     6093 (0.4%)    723 (1.1%)  core::mem::maybe_uninit::MaybeUninit<T>::assume_init
     5922 (0.4%)     47 (0.1%)  std::sync::mpsc::oneshot::Packet<T>::upgrade
     5734 (0.3%)     47 (0.1%)  std::sync::mpsc::oneshot::Packet<T>::send
     5687 (0.3%)     47 (0.1%)  std::sync::mpsc::shared::Packet<T>::decrement
     5664 (0.3%)     48 (0.1%)  <std::sync::mpsc::sync::Packet<T> as core::ops::drop::Drop>::drop
     5664 (0.3%)     48 (0.1%)  std::sync::mpsc::spsc_queue::Queue<T,ProducerAddition,ConsumerAddition>::pop
     5628 (0.3%)     84 (0.1%)  <hashbrown::raw::RawIterRange<T> as core::iter::traits::iterator::Iterator>::next
     5567 (0.3%)    371 (0.6%)  <alloc::sync::Arc<T> as core::ops::drop::Drop>::drop
     5546 (0.3%)     47 (0.1%)  std::sync::mpsc::oneshot::Packet<T>::abort_selection
     5311 (0.3%)     47 (0.1%)  std::sync::mpsc::sync::wait
     5178 (0.3%)     14 (0.0%)  rayon_core::join::join_context::{{closure}}
     5103 (0.3%)    189 (0.3%)  <alloc::raw_vec::RawVec<T,A> as core::ops::drop::Drop>::drop
     5096 (0.3%)    104 (0.2%)  core::iter::traits::iterator::Iterator::find::check::{{closure}}
     5076 (0.3%)     47 (0.1%)  std::sync::mpsc::spsc_queue::Queue<T,ProducerAddition,ConsumerAddition>::with_additions
     5029 (0.3%)     47 (0.1%)  std::sync::mpsc::sync::abort_selection
     4982 (0.3%)     47 (0.1%)  std::sync::mpsc::stream::Packet<T>::do_send
     4928 (0.3%)    616 (0.9%)  core::ptr::swap_nonoverlapping
     4794 (0.3%)     51 (0.1%)  salsa::lru::LruData<Node>::record_use
     4743 (0.3%)     51 (0.1%)  salsa::derived::slot::Memo<DB,Q>::check_durability
     4522 (0.3%)    102 (0.2%)  salsa::derived::slot::Slot<DB,Q,MP>::read_upgrade::{{closure}}
     4512 (0.3%)     47 (0.1%)  std::sync::mpsc::stream::Packet<T>::send
     4507 (0.3%)    512 (0.8%)  core::cell::UnsafeCell<T>::new
     4397 (0.3%)     78 (0.1%)  hashbrown::raw::RawTable<T>::insert_no_grow
     4347 (0.3%)    189 (0.3%)  core::ptr::slice_from_raw_parts_mut
     4320 (0.3%)    720 (1.1%)  core::intrinsics::copy_nonoverlapping
     4309 (0.3%)     96 (0.1%)  core::option::Option<T>::unwrap_or_else
     4284 (0.3%)    153 (0.2%)  <salsa::derived::slot::Slot<DB,Q,MP> as salsa::dependency::DatabaseSlot<DB>>::maybe_changed_since::{{closure}}
     4270 (0.3%)     45 (0.1%)  <core::iter::adapters::zip::Zip<A,B> as core::iter::adapters::zip::ZipImpl<A,B>>::next
     4236 (0.3%)     51 (0.1%)  std::collections::hash::map::Entry<K,V>::or_insert_with
     4176 (0.3%)     85 (0.1%)  alloc::vec::Vec<T>::push
     4138 (0.2%)    373 (0.6%)  alloc::boxed::Box<T>::leak
     4136 (0.2%)     98 (0.1%)  core::result::Result<T,E>::unwrap
     4104 (0.2%)    667 (1.0%)  core::mem::manually_drop::ManuallyDrop<T>::new
     4090 (0.2%)    818 (1.3%)  core::mem::size_of
     4089 (0.2%)     47 (0.1%)  std::sync::mpsc::channel
     4059 (0.2%)    371 (0.6%)  alloc::sync::Arc<T>::drop_slow
     4059 (0.2%)     78 (0.1%)  std::collections::hash::map::map_entry
     4042 (0.2%)     47 (0.1%)  std::sync::mpsc::spsc_queue::Queue<T,ProducerAddition,ConsumerAddition>::alloc
     4023 (0.2%)     51 (0.1%)  salsa::derived::DerivedStorage<DB,Q,MP>::slot
     3976 (0.2%)     48 (0.1%)  std::sync::mpsc::mpsc_queue::Queue<T>::pop
     3948 (0.2%)     47 (0.1%)  std::sync::mpsc::spsc_queue::Queue<T,ProducerAddition,ConsumerAddition>::push
     3840 (0.2%)     48 (0.1%)  std::sys_common::poison::map_result
     3830 (0.2%)    121 (0.2%)  <alloc::vec::Vec<T> as core::ops::index::Index<I>>::index
     3744 (0.2%)     48 (0.1%)  std::sync::mpsc::shared::Packet<T>::drop_chan
     3676 (0.2%)    122 (0.2%)  <alloc::vec::Vec<T> as core::ops::index::IndexMut<I>>::index_mut
     3627 (0.2%)     93 (0.1%)  salsa::QueryTable<DB,Q>::get::{{closure}}
     3612 (0.2%)     84 (0.1%)  <hashbrown::raw::RawTable<T> as core::ops::drop::Drop>::drop
     3546 (0.2%)    698 (1.1%)  core::ptr::write
     3406 (0.2%)    566 (0.9%)  core::ptr::unique::Unique<T>::cast
     3360 (0.2%)     84 (0.1%)  hashbrown::raw::calculate_layout
     3319 (0.2%)     51 (0.1%)  salsa::derived::slot::Slot<DB,Q,MP>::evict
     3318 (0.2%)     12 (0.0%)  rayon::iter::plumbing::bridge_producer_consumer::helper
     3312 (0.2%)     48 (0.1%)  smallvec::SmallVec<A>::try_reserve
     3296 (0.2%)     28 (0.0%)  <rayon_core::job::StackJob<L,F,R> as rayon_core::job::Job>::execute
     3243 (0.2%)     47 (0.1%)  std::sync::mpsc::oneshot::Packet<T>::new
     3216 (0.2%)     48 (0.1%)  std::sync::mpsc::stream::Packet<T>::drop_port
     3149 (0.2%)     47 (0.1%)  std::sync::mpsc::mpsc_queue::Node<T>::new
     3082 (0.2%)    134 (0.2%)  core::ptr::slice_from_raw_parts

@lnicola
Copy link
Member

lnicola commented Jul 1, 2020

It feels like we're getting slower and slower:

image

@matklad
Copy link
Member Author

matklad commented Jul 1, 2020 via email

@lnicola
Copy link
Member

lnicola commented Jul 1, 2020

  • SSR isn't heavy, Semantics is
  • I'll tell Niko that chalk-solve builds too quickly (chalk-parse takes ages)

bors bot added a commit that referenced this issue Jul 1, 2020
5153: Make SemanticsScope non-generic r=matklad a=lnicola

This slightly reduces the build times:

![image](https://user-images.githubusercontent.com/308347/86210975-3a809480-bb7e-11ea-8975-788457f6b353.png)

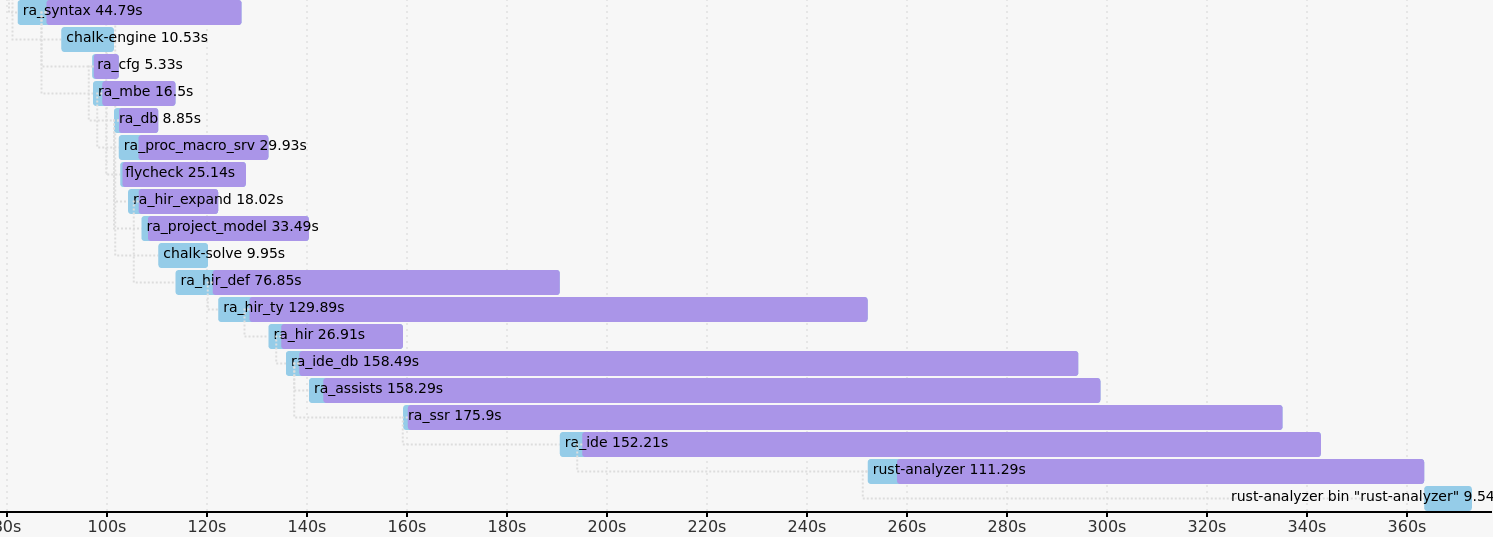
(compare to #1987 (comment))

Co-authored-by: Laurențiu Nicola <lnicola@dend.ro>
@lnicola
Copy link
Member

lnicola commented Jul 7, 2020

After #5242:

image

@lnicola
Copy link
Member

lnicola commented Jul 7, 2020

One of my tests is to compile a new crate containing only this code:

use hir::Semantics;
use ra_syntax::{ast, AstNode, SyntaxNode};

pub struct MatchFinder<'db> {
    sema: Semantics<'db, ra_ide_db::RootDatabase>,
}

impl<'db> MatchFinder<'db> {
    pub fn new(db: &'db ra_ide_db::RootDatabase) -> MatchFinder<'db> {
        MatchFinder { sema: Semantics::new(db) }
    }

    pub fn find_matches(&self, code: &SyntaxNode) {
        if let Some(macro_call) = ast::MacroCall::cast(code.clone()) {
            self.sema.expand(&macro_call);
        }
    }
}

It takes 11.5 seconds (vs. ~35 last week).

@matklad
Copy link
Member Author

matklad commented Jul 7, 2020

Much more reasonable!

@matklad
Copy link
Member Author

matklad commented Jul 7, 2020

Substantial amount of the rest seems to be serde-generated code. Not sure how to combat that....

@matklad
Copy link
Member Author

matklad commented Jul 7, 2020

cc tokio-rs/tracing#783

@mati865
Copy link
Contributor

mati865 commented Jul 7, 2020

@lnicola do you have up-to-date CPU usage metrics over time?
Combining them with crates build chart would show bottlenecks where only a few cores are used.

@lnicola
Copy link
Member

lnicola commented Jul 7, 2020

We're pretty good on that front:

cargo-timing-20200707T083110Z.zip

@mati865
Copy link
Contributor

mati865 commented Jul 7, 2020

Yeah, overall CPU usage looks very reasonable with exception of small 5 seconds window where only 3 threads are properly utilized.

16 thread CPU reveals some bottlenecks though:
cargo-timing-20200707T103522Z.zip

@matklad
Copy link
Member Author

matklad commented Jul 7, 2020

I wonder how much do we pay for may AST methods being trait methods. It might make sense to experiment with generating all methods as inherent methods, and then implementing traits via delegation to inherent methods. This will also reduce the amount of imports we od.

@lnicola
Copy link
Member

lnicola commented Jul 7, 2020

We should also try the self-profiling feature. Last time I wasn't really able to understand the profile output -- it seemed to me that ThinLTO took up to 80 seconds for some CGUs, but I didn't have a baseline to compare it with.

@kjeremy kjeremy mentioned this issue Jul 10, 2020
bors bot added a commit that referenced this issue Jul 10, 2020
5300: Update deps r=matklad a=kjeremy

Bumps tracing to 0.1.16 which reduces monomorphization: #1987 (comment)

Co-authored-by: kjeremy <kjeremy@gmail.com>
@matklad
Copy link
Member Author

matklad commented Aug 31, 2020

Let's close this: we implemented a couple of optimization in this space recently, and I feel that the compile times are reasonable .

One of the optimizations was to fix thermal throttling bug in my laptop: #5903 (comment) =/

@matklad matklad closed this as completed Aug 31, 2020
@lnicola
Copy link
Member

lnicola commented Aug 31, 2020

One of the optimizations was to fix thermal throttling bug in my laptop

Wrong link?

@matklad
Copy link
Member Author

matklad commented Aug 31, 2020

Indeed: https://github.com/erpalma/throttled

@lnicola
Copy link
Member

lnicola commented Mar 5, 2021

Here's a fresh -Z timings output (on different hardware, though):

image

Sign up for free to join this conversation on GitHub. Already have an account? Sign in to comment
Labels
E-hard fun A technically challenging issue with high impact
Projects
None yet
Development

No branches or pull requests

8 participants