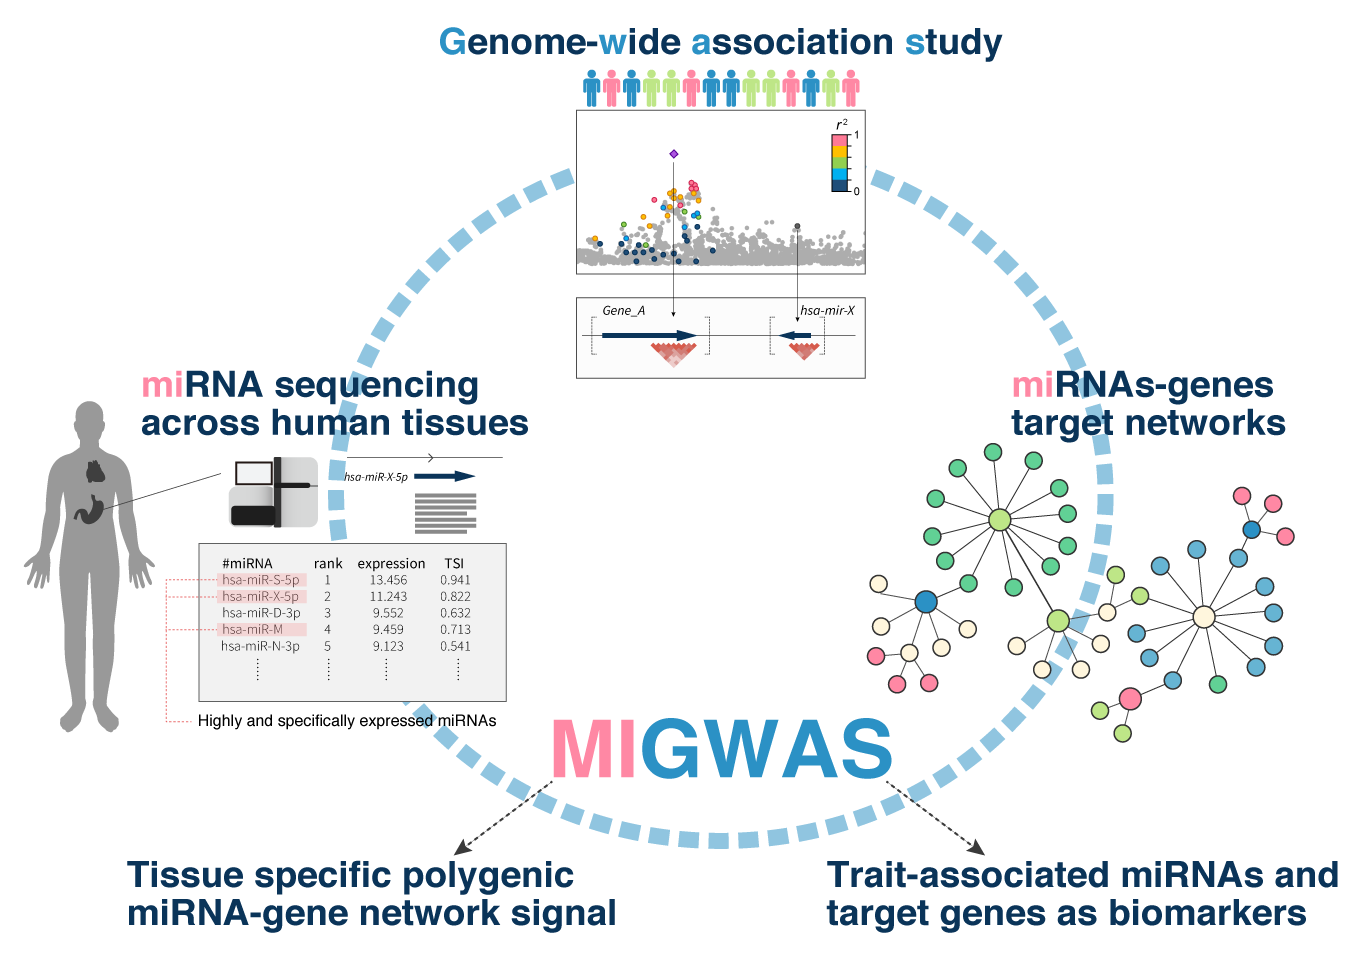
This software evaluates enrichment of genome-wide association study (GWAS) signals on miRNA-target gene networks (MIGWAS) and partition them into various human tissues with the help of tissue specific miRNA expression data.
Our paper is out!
Sakaue S. et al. Integration of genetics and miRNA-target gene network identified disease biology implicated in tissue specificity. Nucleic Acids Research. doi:10.1093/nar/gky1066.
Please cite this paper if you use the software or any material in this repository.
- python 3.X
- scipy
- numpy
- pandas
- six
- argparse
- math
- multiprocessing
- futures
In order to get started with MIGWAS, you can just clone this repo as follows;
git clone https://github.com/saorisakaue/MIGWAS
cd ./MIGWASAll you need is a text file with GWAS summary statistics.
| Column | Descriptions |
|---|---|
| 1 | rsID (optional with --no-rsid flag below.) |
| 2 | chromosome |
| 3 | BP position |
| 4 | z-score (optional) |
| 5 | p-value |
Please have a look at an example input at ./example/RA_trans.chr12.pos.P.txt (RA GWAS result at chr12).
This part is based on the excelent work by Masahiro Kanai, which was implemented to calculate the corrected "gene association score" from a GWAS result, according to MAGENTA's method. For detailed explanations, please visit the original repository. Do take care of the input format of the summary statistics. The example command is as follows;
$ python3 ./minimgnt.py score_filename --out output_prefix [--cpus 4] [--not-remove-HLA] [--remove-NA] --no-rsidNote! Our example data file ./example/RA_trans.chr12.pos.P.txt only contains chr12 summary statistics (due to the size limitation on GitHub), while the subsequent analysis assumes genome-wide one.
score_filename: GWAS summary statistics.
| Option name | Descriptions | Required | Default |
|---|---|---|---|
--out, -o |
An output prefix. This should preferably be a phenotype name. | Yes | "your_phenotype" |
--cpus, -j |
a number of cpus used for computation. | No | 1 |
--not-remove-HLA |
do not remove genes in HLA region from a result. | No | False |
--remove-NA |
remove genes with NA score from the output. | No | False |
--no-rsid |
use this flag when a score file doesn't contain a rsID column. | No | False |
Output files will be generated at ./miRNA_P/ and ./gene_P/.
The example command is as follows;
$ python3 ./migwas.py --phenotype RA_trans --out miRA_RA [--cpus 4] --iterations 20000 [--output-candidate]| Option name | Descriptions | Required | Default |
|---|---|---|---|
--phenotype, -p |
Name of the phenotype of interest (file name prefix from minimgnt output). | Yes | None |
--out, -o |
Output file prefix. | No | "your_migwas" |
--cpus, -j |
Number of CPUs to be used. | No | 1 |
--iterations, -i |
Number of permutations to simulate null distributions. | No | 20000 |
--output-candidate, -c |
If you want to output a list of candidate miRNAs and genes associated with the trait, set this flag. | No | False |
--tsi, -t |
Tissue specificity index threshold for partitioning miRNA's enrichment signal. Details will be in our article. | No | 0.7 |
- The example enritchment resut output is as follows;
$ head miRA_RA_migwas_result.txt
#tissue	P_value	Fold_change
endothelial_cell_of_hepatic_sinusoid	0.0734928970649366	1.3943485234788573
epithelial_cell_of_proximal_tubule	0.22659192222025776	0.9410164034752201
keratinocyte	0.3550971896625686	0.7721248194464695
Each cell's partitioned enrichment P value and fold change, as well as miRNA-gene enrichment for all tissues will be described.
- The example candidate output is as follows;
$ head DIAGRAM_DM_candidates.txt
99	ZNF148	hsa-mir-548aq	MIMAT0022263
99	ZNF148	hsa-mir-548aq	MIMAT0022264
99	C5orf24	hsa-mir-548aq	MIMAT0022263
99	C5orf24	hsa-mir-548aq	MIMAT0022264
Each row shows the candidate trait-associated miRNA-gene pairs.
| Column | Descriptions |
|---|---|
| 1 | The percentile of scores indicating gene-miRNA target prediction certainty. |
| 2 | The target gene symbol. |
| 3 | The miRNA ID. |
| 4 | The mature miRNA ID. |
Please note that the candidate output list holds redundancy, because the pairs supported by higher score are included those with lower scores.
- Tissue specific miRNA-gene enrichment analysis was made possible by the awesome work from FANTOM5, a comprehensive expression catalog of miRNA expression in varitous human cells. The original data can be found here.
- The original MAGENTA was written by Ayellet Segre, Mark Daly, and David Altshuler of The Broad Institute.
- Ayellet V. Segrè, DIAGRAM Consortium, MAGIC investigators, Leif Groop, Vamsi K. Mootha, Mark J. Daly, and David Altshuler (2010). Common Inherited Variation in Mitochondrial Genes is not Enriched for Associations with Type 2 Diabetes or Related Glycemic Traits. PLoS Genetics Aug 12;6(8). pii: e1001058.
- Minimgnt (miniMAGENTA) part was written by Masahiro Kanai, reimplementing the calculation of "gene associatino score" feature in Python.
This software is freely available for academic users. Usage for commercial purposes is not allowed. Please refer to the LICENCE page.
