![]()
SMAGEXP (Statistical Meta-Analysis for Gene EXPression) for Galaxy is a Galaxy tool suite providing a unified way to carry out meta-analysis of gene expression data, while taking care of their specificities. It handles microarray data from Gene Expression Omnibus (GEO) database or custom data from affymetrix microarrays. These data are then combined to carry out meta-analysis using metaMA package. SMAGEXP also offers to combine Next Generation Sequencing (NGS) RNA-seq analysis from DESeq2 results thanks to metaRNASeq package. In both cases, key values, independent from the technology type, are reported to judge the quality of the meta-analysis.
- How to install SMAGEXP
- How to analyse data with SMAGEXP
- Step by step example of a micro-array meta-analysis
- Step by step example of a RNA-seq meta-analysis
How to install SMAGEXP [toc]
From the galaxy toolshed [toc]
SMAGEXP is available on the galaxy main toolshed
SMAGEXP dependencies are available through conda either on bioconda or r conda channels.
If you want to manually install the SMAGEXP dependencies, without conda, these are the required R packages.
-
From bioconductor :
- GEOquery
- limma
- affy
- annaffy
- HTSFilter
- GEOmetadb
- affyPLM
- recount
-
From CRAN :
- metaMA
- metaRNASeq
- jsonlite
- VennDiagram
- dplyr
- optparse
- UpSetR
Using Docker [toc]
A dockerized version of Galaxy containing SMAGEXP, based on bgruening galaxy-stable is also available.
At first you need to install Docker. Please follow the very good instructions from the Docker project.
After the successful installation, all you need to do is:
docker run -d -p 8080:80 -p 8021:21 -p 8022:22 sblanck/galaxy-smagexp
If you already have run galaxy-smagexp with docker and want to fetch the last docker image of galaxy-smagexp, type
docker pull sblanck/galaxy-smagexp
docker run -d -p 8080:80 -p 8021:21 -p 8022:22 sblanck/galaxy-smagexp
Then, you just need to open a web browser (chrome or firefox are recommanded) and type
localhost:8080
into the adress bar to access Galaxy running SMAGEXP.
The Galaxy Admin User has the username admin@galaxy.org and the password admin. In order to use some features of Galaxy, like import history, one has to be logged in with this username and password.
Docker images are "read-only", all your changes inside one session will be lost after restart. This mode is useful to present Galaxy to your colleagues or to run workshops with it. To install Tool Shed repositories or to save your data you need to export the calculated data to the host computer.
Fortunately, this is as easy as:
docker run -d -p 8080:80 \
    -v /home/user/galaxy_storage/:/export/ \
    sblanck/galaxy-smagexp
For more information about the parameters and docker usage, please refer to https://github.com/bgruening/docker-galaxy-stable/blob/master/README.md#Usage
How to analyse data with SMAGEXP [toc]
Micro-array meta-analysis [toc]
SMAGEXP is able to perform analysis from 3 different data sources :
- From GEO database
- From .CEL files
- From custom matrix text files
Data from GEO database [toc]
SMAGEXP can fetch data directly from GEO database, thanks to the GEOQuery R package.
The inputs for each individual dataset are :
- The GEO Series Accession ID of the microarray experiment
- log2 transformation option : Limma expects data values to be on a logarithmic scale. If the values of the experiments are not on a logarithmic scale, SMAGEXP is able to check and to transform them accordingly (option auto). The user can also choose to force the transformation (option yes) or to override the auto detect feature (option no)
The outputs are :
- A tabular file containing the values of probes in rows and samples in columns.
- An .rdata file containing a Bioconductor ExpressionSet object. This file is required for further differential analysis.
- A tabular text file (.cond extension) summarizing the conditions of the experiment.
Exemple of a .cond file
GSM80460	series of 16 tumors		GSM80460 OSCE-2T SERIES OF 16 TUMORS
GSM80461	series of 16 tumors		GSM80461 OSCE-4T Series of 16 Tumors
GSM80461	series of 16 tumors		GSM80462 OSCE-6T Series of 16 Tumors
GSM80476	series of 4 normals		GSM80476 OSCE-2N Series of 4 Normals
GSM80477 	series of 4 normals		GSM80477 OSCE-9N Series of 4 Normals
.cond file is a text file, containing 3 columns, separated by tabs, summarizing the conditions of the experiment.
- 1st column is the ID of the sample
- 2nd column is the condition of the sample
- 3rd column is a description of the sample
When extracting data from GEO database, SMAGEXP automatically generates a .cond files based on the metadata of the experiment.
Data from affymetrix .CEL files [toc]
SMAGEXP handles affymetrix .CEL files. .CEL files have to be normalized with QCnormalization tool. This tool normalizes data and allows the user to check quality.
The inputs are
- A list of .CEL files
- The normalization methods
- rma normalization
- quantile normalization + log2
- background correction + log2
- log2 only
The outputs are
- Several quality figures : microarray images, boxplots and MA plots
- An .rdata file containing a Bioconductor ExpressionSet object containing the normalized data for further analysis
- Text file containing normalized data
Custom matrix data [toc]
Import custom data tool imports data stored in a tabular text file. A few normalization methods are proposed, but it is possible to skip the normalization step, by choosing "none" in the normalization methods options. Therefore, this tool is of special interest when the input dataset has been previously normalized.
The inputs are :
- A text file, with probes in rows and samples in columns. Column titles (sample IDs) must match the IDs (first column) of the .cond file (see the example given below).
- Normalization method (choose none if the data is already normalized)
- A GPL annotation code to fetch annotations from GEO.
The text file has to be first uploaded by Galaxy's Get Data -> upload file
Example of a header of input tabular text file
""			"GSM80460"			"GSM80461"			"GSM80462"			"GSM80463"			"GSM80464"
"1007_s_at"	-0.0513991525066443	0.306845500314283	0.0854246562526777	-0.142417044615852	0.0854246562526777
"1053_at"	-0.187707155126729	-0.488026018218199	-0.282789700980404	0.160920188181103	0.989865622866287
"117_at"	0.814755482809874	-2.15842936260448	-0.125006361067033	-0.256700472111743	0.0114956388378294
"121_at"	-0.0558912008920451	-0.0649174766813385	0.49467161164755	-0.0892673380970874	0.113700499164728
"1294_at"	0.961993677420255	-0.0320936297098533	-0.169744675832317	-0.0969617298870879	-0.181149439104566
"1316_at"	0.0454429707611671	0.43616183931445	-0.766111939825723	-0.182786075741673	0.599317793698226
"1405_i_at"	2.23450132056221	0.369606070031838	-1.06190243892591	-0.190997225060914	0.595503660502742
The corresponding .cond file should look like this :
GSM80460	series of 16 tumors		GSM80460 OSCE-2T SERIES OF 16 TUMORS
GSM80461	series of 16 tumors		GSM80461 OSCE-4T Series of 16 Tumors
GSM80461	series of 16 tumors		GSM80462 OSCE-6T Series of 16 Tumors
GSM80476	series of 4 normals		GSM80476 OSCE-2N Series of 4 Normals
GSM80477 	series of 4 normals		GSM80477 OSCE-9N Series of 4 Normals
The .cond file is a text file, containing 3 columns, separated by tabs, summarizing the conditions of the experiment.
- 1st column is the ID of the sample
- 2nd column is the condition of the sample
- 3rd column is a description of the sample
Even if the .cond file is not needed to import data from custom matrix, it will be required in the limma analysis step, and should be manually generated by the user.
The outputs are
- Boxplots and MA plots -An .rdata file containing a Bioconductor ExpressionSet object containing the data for further analysis.
Limma Analysis [toc]
The Limma analysis tool performs single analysis either of data previously retrieved from GEO database or normalized affymetrix .CEL files data. Given a .cond file, it runs a standard limma differential expression analysis.
The inputs are
- An .rdata file containing a Bioconductor ExpressionSet object from GEOQuery tool, QCnormalization tool or Import custom data tool
- A .cond file,
- 2 conditions to compare
The .cond file is either generated by the GEOquery tool or must be manually generated by the user for data imported from .CEL files or custom matrix data.
A .cond file should look like this.
GSM80460	series of 16 tumors		GSM80460 OSCE-2T SERIES OF 16 TUMORS
GSM80461	series of 16 tumors		GSM80461 OSCE-4T Series of 16 Tumors
GSM80461	series of 16 tumors		GSM80462 OSCE-6T Series of 16 Tumors
GSM80476	series of 4 normals		GSM80476 OSCE-2N Series of 4 Normals
GSM80477 	series of 4 normals		GSM80477 OSCE-9N Series of 4 Normals
The .cond file is a text file, containing 3 columns, separated by tabs, summarizing the conditions of the experiment.
- 1st column is the ID of the sample, and must match the sample IDs of the .CEL files or the columns of the custom matrix data if it was manually generated.
- 2nd column is the condition of the sample
- 3rd column is a description of the sample
The outputs are :
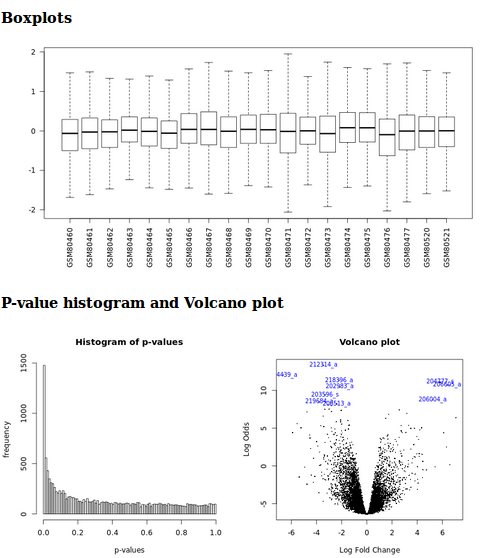
- Boxplots, p-value histograms and a volcano plot
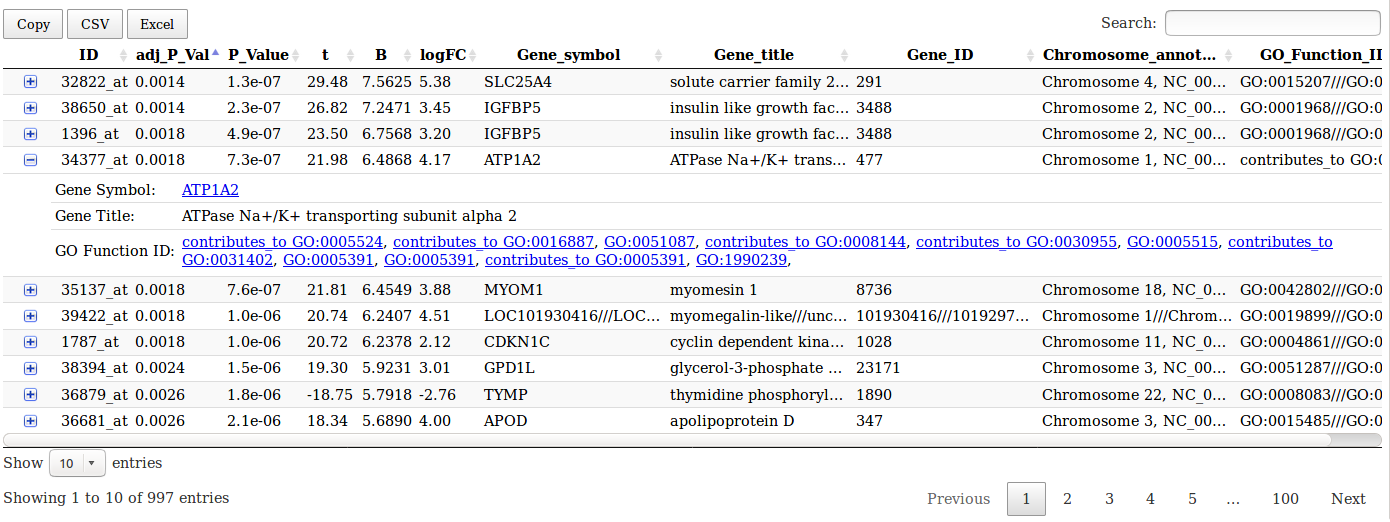
- A table summarizing the differentially expressed genes and their annotations. This table is sortable, requestable and annotated. When a row is expended, links to NCBI gene annotations and Gene Ontology functions are available
- An .rdata file containing a Bioconductor ExpressionSet object to perform further meta-analysis.
- A text file containing the annotated results of the differential analysis

Micro-array meta analysis [toc]
Given several .rdata files from the limma analysis tool, the microarray meta-analysis tool runs a meta-analysis using the metaMA R package.
The Inputs are :
- .rdata files from limma analysis tool.
The outputs are :
-
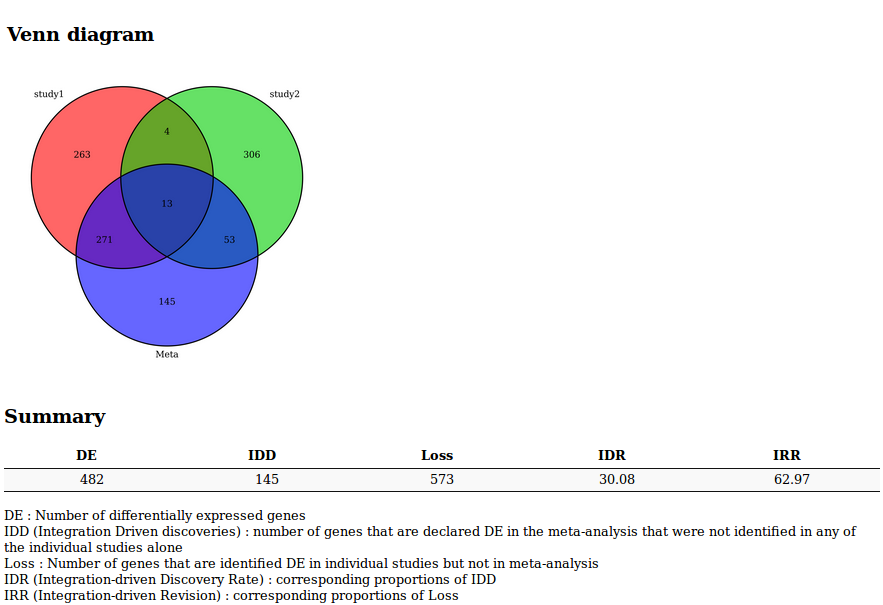
Venn Diagram or UpSet diagram (when the number of studies is greater than 3) summarizing the results of the meta-analysis
-
A list of indicators to evaluate the quality of the performance of the meta-analysis
- DE : Number of differentially expressed genes
- IDD (Integration Driven Discoveries) : number of genes that are declared differentially expressed in the meta-analysis that were not identified in any of the single studies alone
- Loss : Number of genes that are identified differentially expressed in single studies but not in meta-analysis
- DR (Integration-driven Discovery Rate) : corresponding proportion of IDD
- IRR (Integration-driven Revision) : corresponding proportion of Loss
-
Fully sortable and requestable table, with gene annotations and hypertext links to NCBI gene database.
Plots and results generated by the microarray meta-analysis tool
Rna-seq meta analysis [toc]
Getting rna-seq count data from recount2 [toc]
recount2 is an online resource consisting of RNA-seq gene and exon counts as well as coverage bigWig files for 2041 different studies. The recount galaxy tool wraps the Bioconductor R package recount and fetch gene counts from one experiment.
Input is
- Accession ID
Outputs are
- Tabular file containing sample ID and samples conditions
- One count file per sample
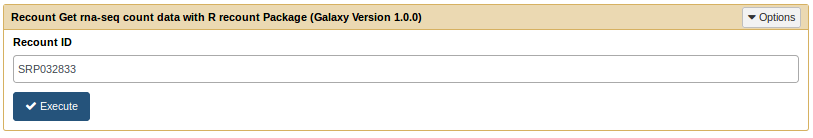
recount tool form
DESeq2 analysis [toc]
Count files retrieved by the recount galaxy tool can be analyzed with the DESeq2 tool available on the galaxy toolshed For more information of how this tool works, see the help section on the tool or refer to the Run DESeq2 section of the Step by step example of a RNA-seq meta-analysis chapter.
RNA-seq meta-analysis [toc]
The RNA-seq data meta-analysis tool relies on DESeq2 results. It uses the metaRNAseq R package from CRAN.
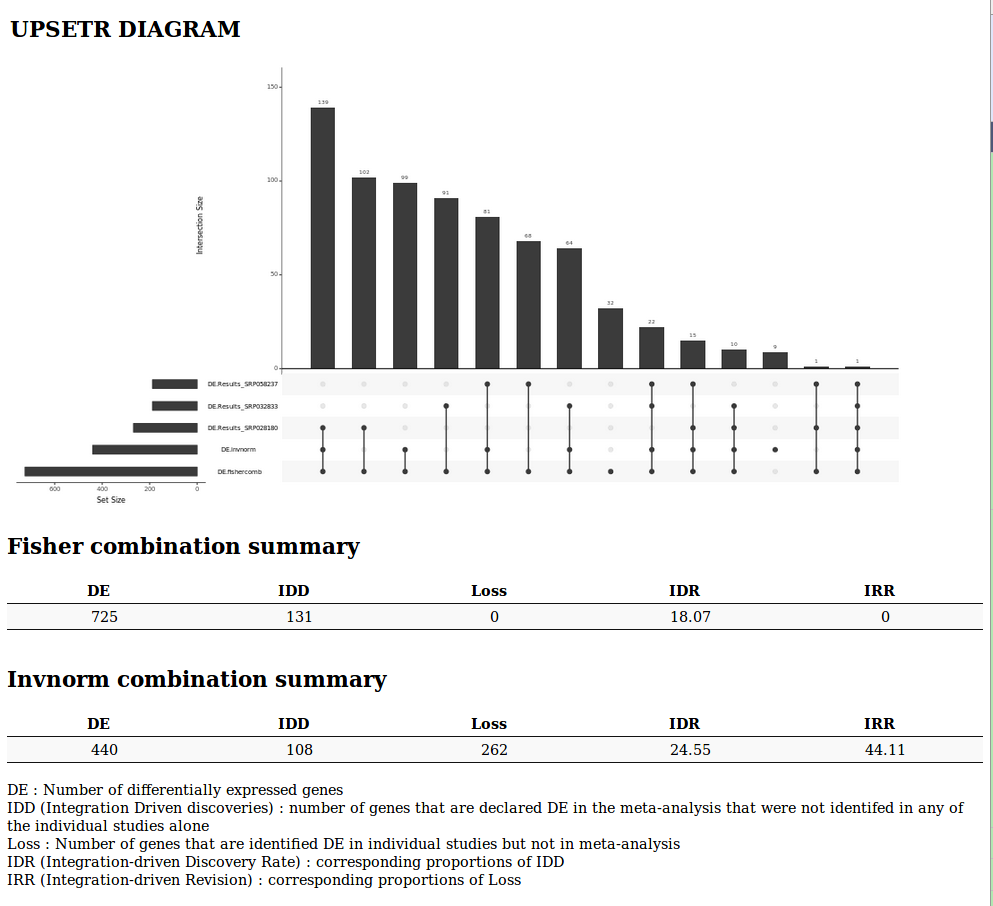
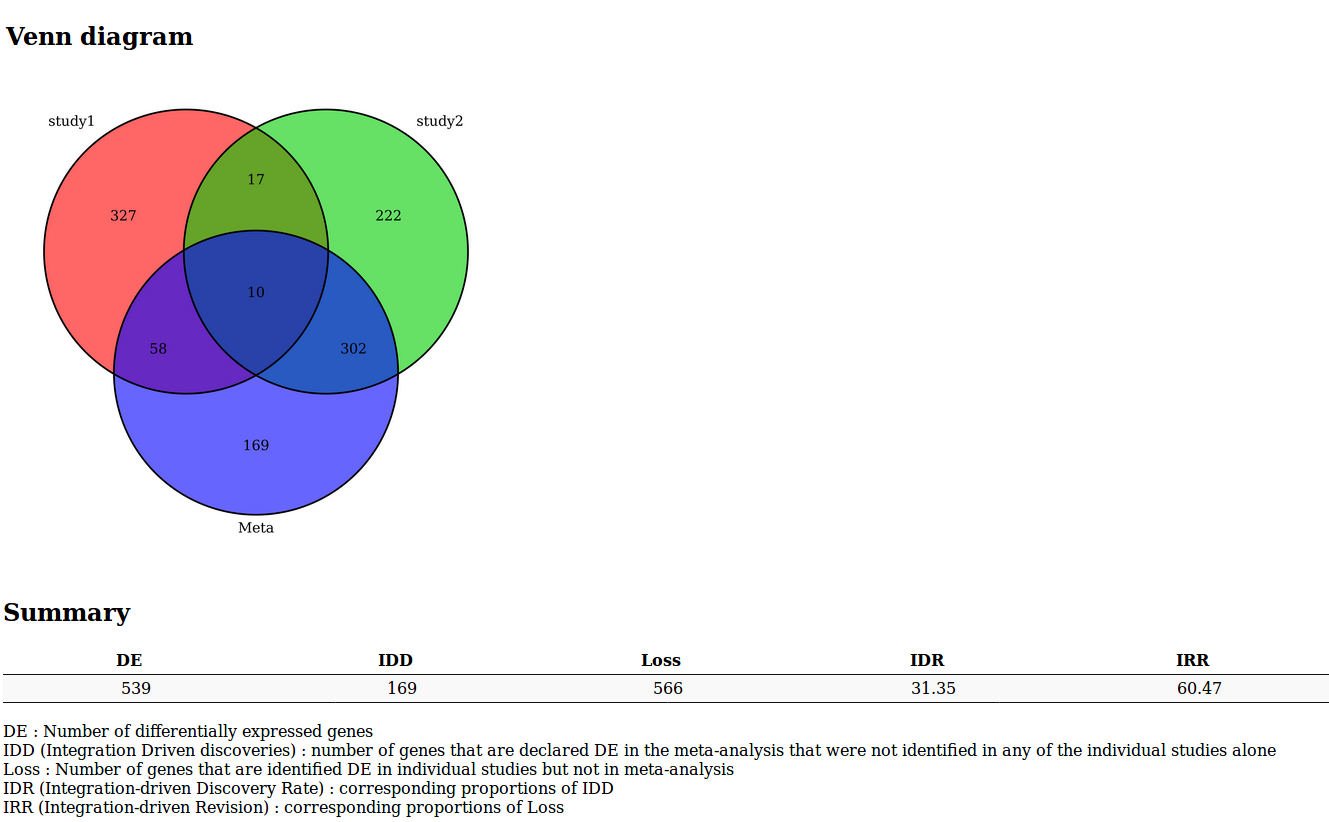
It outputs a Venn diagram or an UpSet diagram (when the number of studies is greater than 2) and the same indicators as in the microarray meta-analysis tool for both Fisher and inverse normal p-value combinations.
The inputs are :
- At least 2 studies, and for each study
- Results of DESeq2 study
- Number of replicates of the study
- A FDR Threshold
The outputs are :
-
Venn Diagram or UpSetR diagram (when the number of studies is greater than 3) summarizing the results of the meta-analysis
-
A list of indicators to evaluate the quality of the performance of the meta-analysis
- DE : Number of differentially expressed genes
- IDD (Integration Driven discoveries) : number of genes that are declared differentially expressed in the meta-analysis that were not identified in any of the single studies alone
- Loss : Number of genes that are identified differentially expressed in single studies but not in meta-analysis
- DR (Integration-driven Discovery Rate) : corresponding proportion of IDD
- IRR (Integration-driven Revision) : corresponding proportion of Loss
It also generates a text file containing summarization of the results of each single analysis and meta-analysis. Potential conflicts between single analyses are indicated by zero values in the "signFC" column.
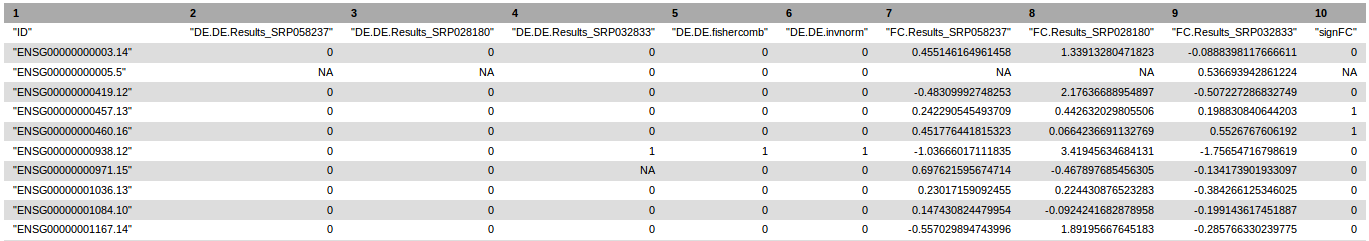
Header of RNA-seq data meta-analysis text results
Step by step example of a micro-array meta-analysis [toc]
Data used in this example [toc]
In order to import histories into galaxy, you have to be logged in your galaxy instance. If you use the dockerized version of galaxy, The Galaxy Admin User has the username admin@galaxy.org and the password admin.
The full history of this example is available at :
https://github.com/sblanck/smagexp/raw/master/examples/Galaxy-History-Example-of-micro-array-meta-analysis.tar.gz
.CEL files used in this example are extracted from the GEO dataset GSE13601. We picked up 6 .CEL files (to simplify the example) which can be found here :
https://github.com/sblanck/smagexp/raw/master/examples/GSM342582.CEL
https://github.com/sblanck/smagexp/raw/master/examples/GSM342583.CEL
https://github.com/sblanck/smagexp/raw/master/examples/GSM342584.CEL
https://github.com/sblanck/smagexp/raw/master/examples/GSM342585.CEL
https://github.com/sblanck/smagexp/raw/master/examples/GSM342586.CEL
https://github.com/sblanck/smagexp/raw/master/examples/GSM342587.CEL
We also manually generated a .cond file corresponding to these 6 .CEL files.
https://raw.githubusercontent.com/sblanck/smagexp/master/examples/Celfiles.cond
To easily upload these data on Galaxy, it is possible to load an existing history containing all these data :
https://github.com/sblanck/smagexp/raw/master/examples/Galaxy-History-Example-Data.tar.gz
Download this history on your computer and import it in galaxy. If you choose to manually upload these data on Galaxy don't forget to specify the type of each file (.CEL or .cond) as Galaxy won't auto-detect them.
First analysis: from GEO database [toc]
Run the GEOQuery Tool [toc]
The GSE accession ID is needed (i.e GSE3524). The log2 transformation is set to auto in this example.
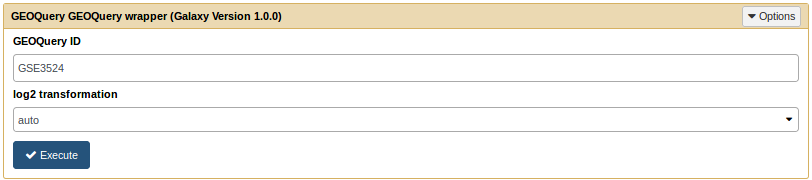
GEOQuery tool form
The tool produces
- A tabular text file containing normalized expression value for each probe (in row) and each sample (in column).
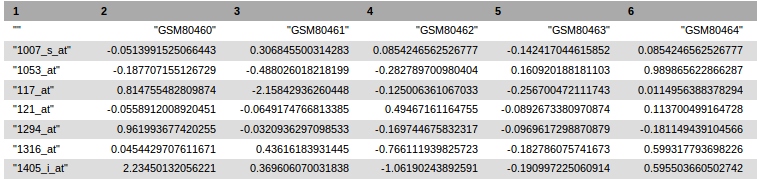
Header of the tabular text file generated by GEOquery tool
- A .cond file summarizing the conditions of the experiment.

Condition file generated by GEOquery tool
- An .rdata file containing a Bioconductor ExpressionSet object for further analysis
Run a limma analysis [toc]
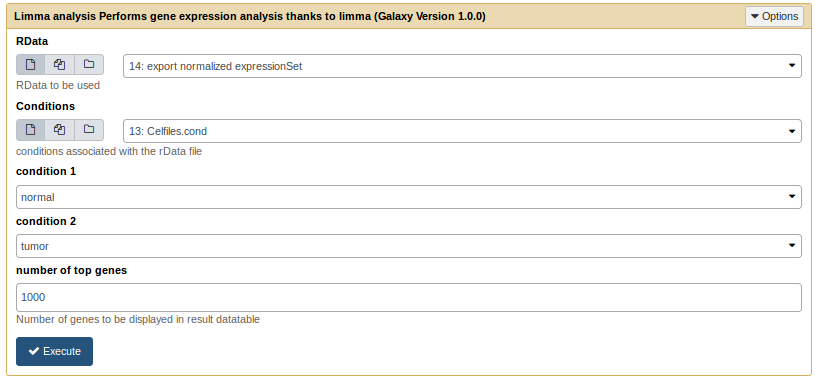
The limma analysis tool takes an .rdata and a .cond file as inputs.
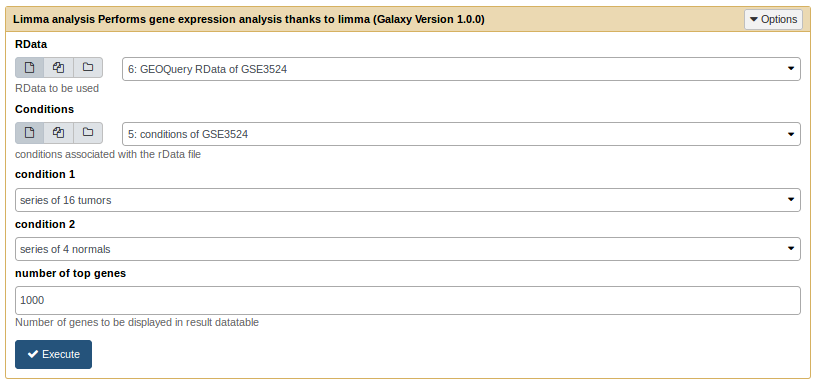
Limma analysis tool form
It generates a html report with boxplots, p-value histogram, a volcano plot and a table listing the differentially expressed genes.
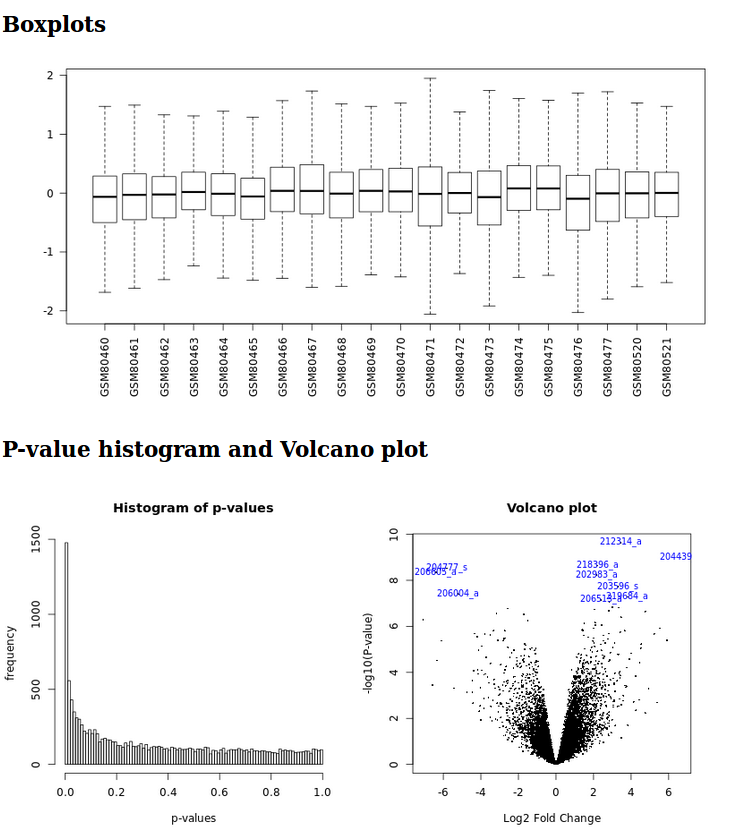
Limma analysis tool graphic outputs
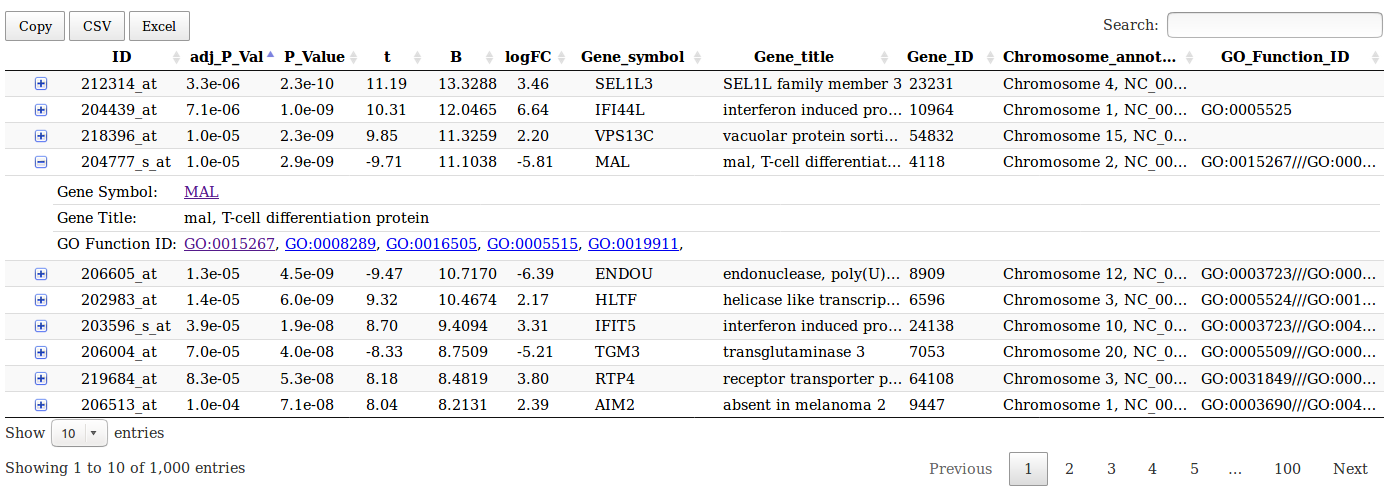
Limma analysis tool table output
This table gives access to gene annotation on NCBI and gene ontology websites.

NCBI gene annotations
Second analysis : from raw .CEL files [toc]
Run the QCnormalisation tool [toc]
The QC normalisation tool only needs a list of .CEL files and a normalization method.
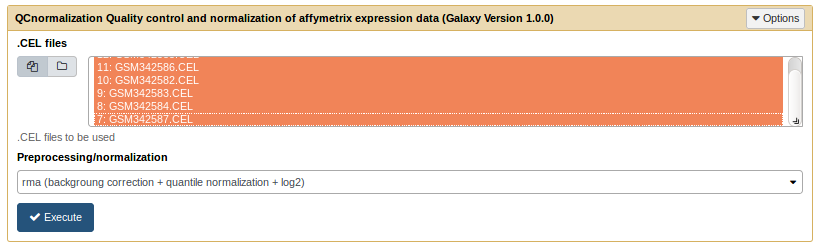
QCnormalization tool form
It generates an html report showing microarray pseudo-images, boxplots and MA plots for raw and normalized data. It also generates an .rdata file containing normalized data in a ExpressionSet object for further analysis with limma.
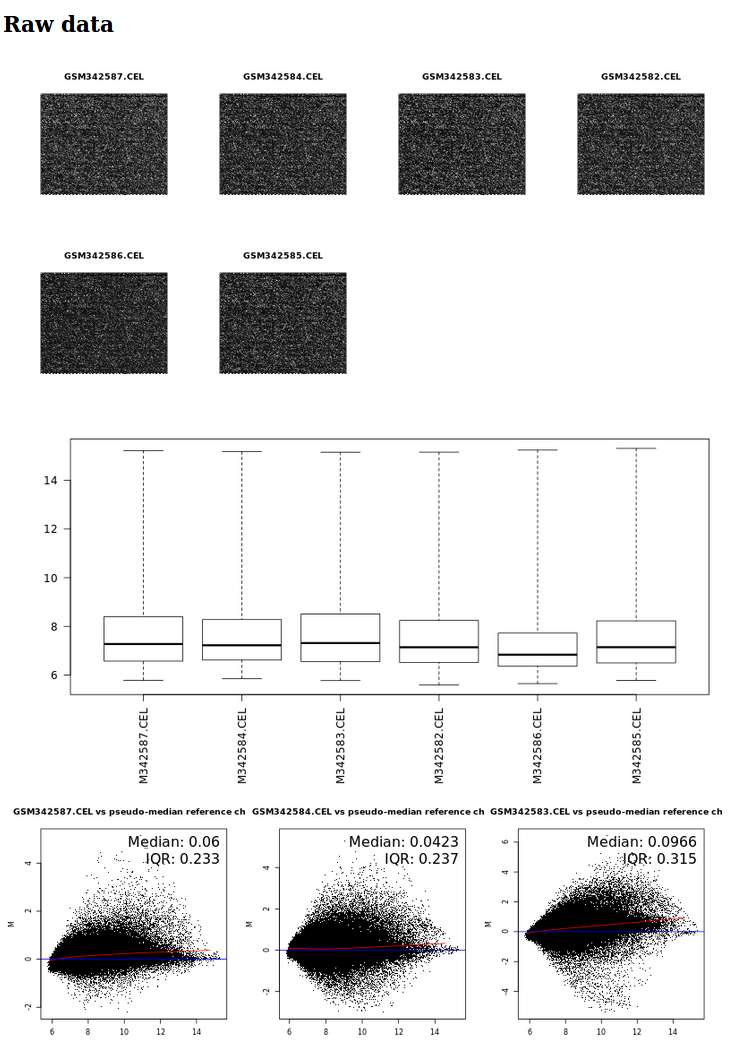
QCnormalization tool (partial) results with microarray pseudo-images, boxplots and MA-plots for raw data
Run a limma analysis [toc]
The limma analysis tool takes an .rdata and a .cond file as inputs.
Limma analysis tool form
It generates a html report with boxplots, p-value histogram, a volcano plot, and a table listing the differentially expressed genes.
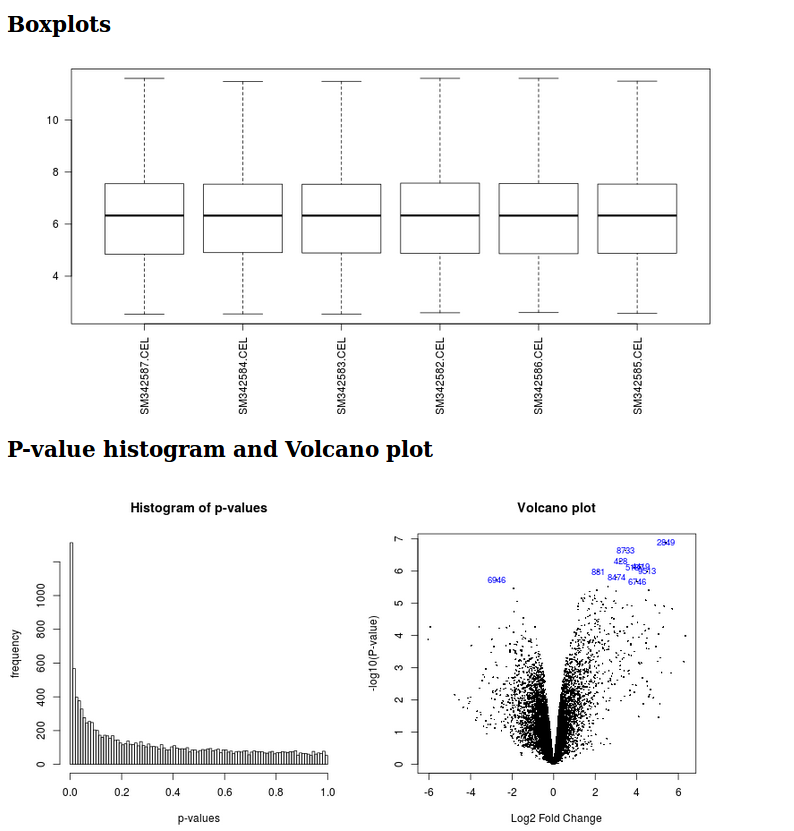
Limma analysis tool graphic outputs
Limma analysis tool table output
Run the meta-analysis with metaMA [toc]
The meta-analysis tool only needs the .rdata files produced by the limma analysis tool.
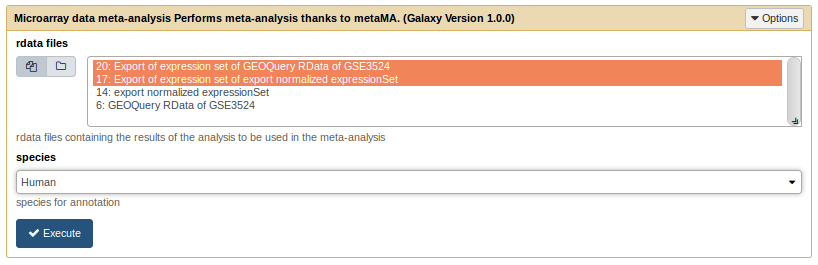
metaMA tool form
The outputs are :
-
A Venn diagram or an UpSet diagram summarizing the results of the meta-analysis
-
A list of indicators to evaluate the quality of the performance of the meta-analysis
- DE : Number of differentially expressed genes
- IDD (Integration Driven Discoveries) : number of genes that are declared differentially expressed in the meta-analysis that were not identified in any of the single studies alone
- Loss : Number of genes that are identified differentially expressed in single studies but not in meta-analysis
- DR (Integration-driven Discovery Rate) : corresponding proportion of IDD
- IRR (Integration-driven Revision) : corresponding proportion of Loss
-
Fully sortable and requestable table, with gene annotations and hypertext links to NCBI gene database.
MetaMA tool results
Step by step example of a RNA-seq meta-analysis [toc]
Data used in this example [toc]
In order to import histories into galaxy, you have to be logged in your galaxy instance. If you use the dockerized version of galaxy, The Galaxy Admin User has the username admin@galaxy.org and the password admin.
The full history of this example is available at :
https://github.com/sblanck/smagexp/raw/master/examples/Galaxy-History-Example-of-RNA-seq-meta-analysis.tar.gz
Three dataset from the recount database are used in this example :
First Analysis [toc]
Run the recount tool [toc]
The first step is to fetch raw count data from Recount. The galaxy recount tool wraps the recount bioconductor R package. It only needs the accession ID of the experiment.
Recount tool form
The recount tool generates one count file per sample of the experiment, in order to be analysed with DESeq2.
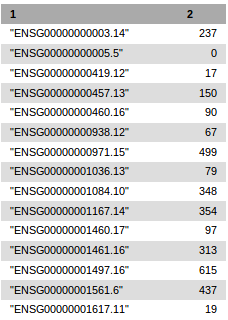
Example of header of a count file generated by recount tool
In this example 17 count files are generated
Run a DESeq2 analysis [toc]
The DESeq2 tool is available on the galaxy toolshed. It takes the count files generated by the recount tool as inputs. It also wraps others DESeq2 parameters (see DESeq2 tool help section for more information). In this example we keep the 6 invasive lung cancer samples to compare with the 5 normal samples.
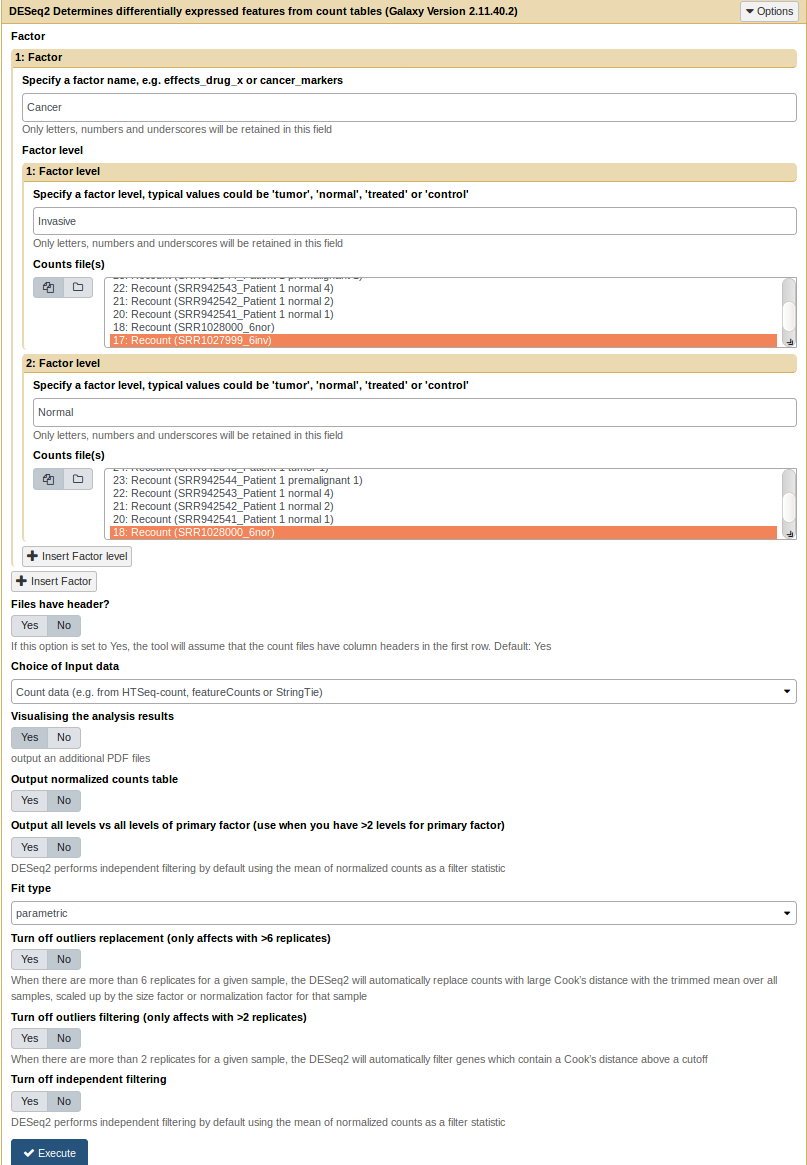
DESeq2 form
It generates a pdf report and a tabular text results file.
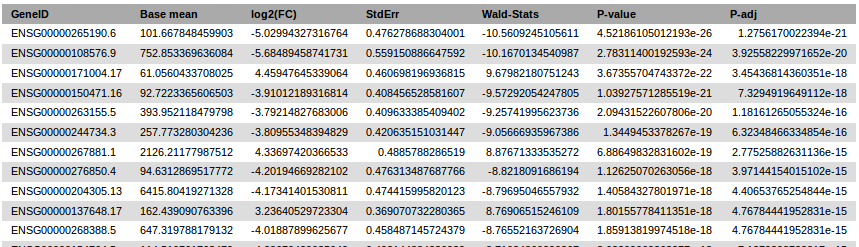
DESeq2 results header
Second Analysis [toc]
We perform the same kind of analysis on the second recount dataset (SRP028180)
Run the recount tool [toc]

Recount tool form
In this example 24 count files are generated
Run a DESeq2 analysis [toc]
In this example we keep the 10 tumor samples to compare with the 7 normal samples.

DESeq2 tool form
Third Analysis [toc]
At last, we perform the 3rd analysis on the third recount dataset (SRP058237)
Run the recount tool [toc]
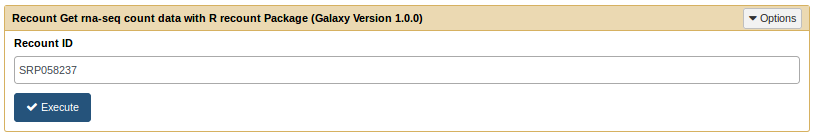
Recount tool form
In this example 17 count files are generated
Run a DESeq2 analysis [toc]
In this example we keep the 7 tumor samples to compare with the 10 adjacent samples.

DESeq2 tool form
Meta Analysis with metaRNASeq [toc]
MetaRNASeq tool takes several results from DESeq2 tool and performs a meta-analysis. It requires text results files from DESeq2 and the number of replicates of each analysis. In this example we have 17, 17, and 11 replicates for each of the 3 analysis. It also requires a FDR threshold for genes to be declared differentially expressed (default is 0.05)
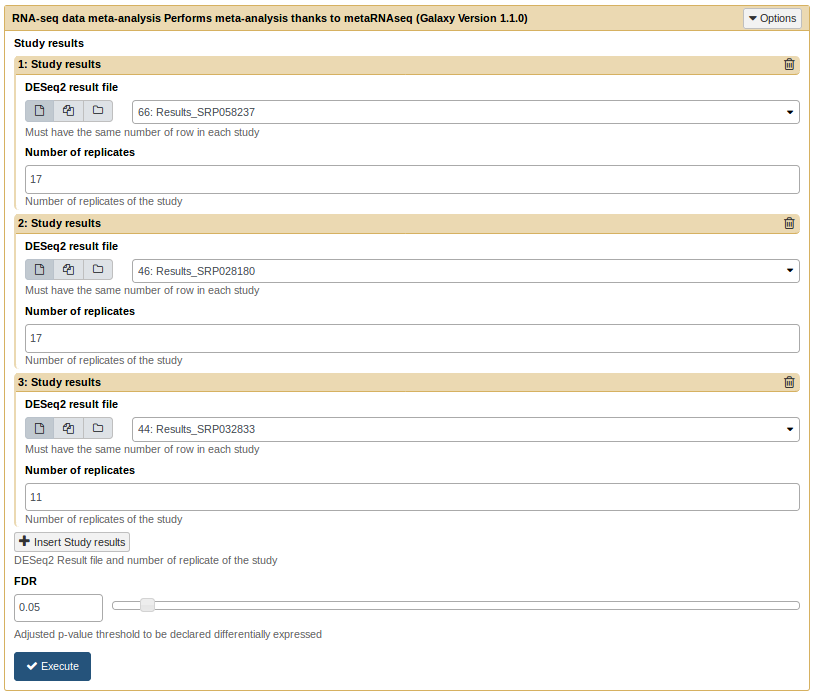
MetaRNAseq tool form
The tool outputs 2 datasets :
Upset diagram and statistical indicators of the meta-analysis
Header of the text file generated by the metaRNAseq tool
It summarizes the results of each single analysis and meta-analysis. Potential conflicts between single analyses are indicated by zero values in the "signFC" column.