Mean Standardized Log Loss (MSLL) for uncertainty aware regression models #21665
Comments
|
I think @lorentzenchr would be very much interested in this one. |
|
The proposed score is the log-likelihood of a Normal/Gaussian distribution. Two questions come up to mind:
|
|
Thank you for your response @lorentzenchr.
Can you please elaborate a bit more on this question?
A Generalized score seems interesting. I was wondering if you could point me towards a reference. However, I think that the normality assumption holds true for |
|
We are talking about the pair of point forecasts (mean, variance). The question is: Are pairs of point forecasts in-scope? Which API would we follow ( If we stick to the assumption of normal distributed targests, the log-likelihood may be fine. There is, however, literature for scoring functions (aka loss functions or metrics) for pairs of point forecasts, see Eq. (3.8) of https://doi.org/10.1214/19-EJS1552, where |
|
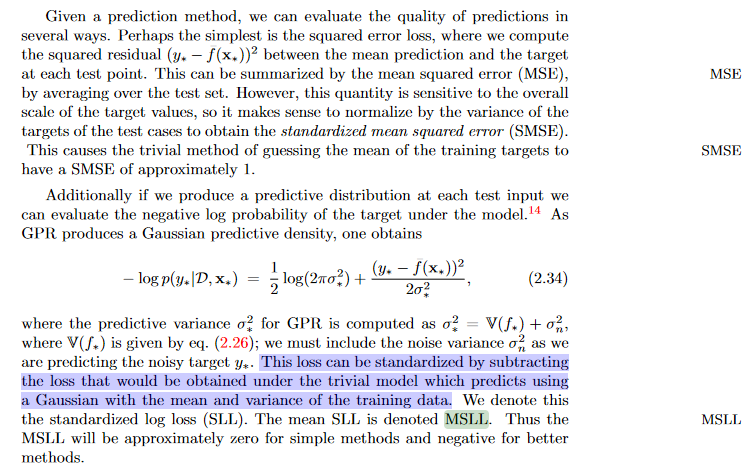
Hi @patel-zeel. Thank you for your suggestion. I am not a scikit-learn core-dev but I landed here because I was also very interested in this metric found in Rasmussen, C. E. (2006, February). Comparing the formulas in such reference with your rough code, I would like to clarify a couple of doubts that have arisen: :
Thank you in advance! |
|
Hi @pyLP7, Several probabilistic metrics are now available in the gpytorch library. You can find them here.
|
|
Hi @patel-zeel and thank you for your reply. Thank you also for the Pytorch link with probabilistic metrics. I was just a bit confused because I thought we were on the scikit-learn module ;) Anyway, my main reference is the old but gold Rasmussen & Williams, pp. 23, eq. 2.34 that you also mentioned immediately after presenting the MSLL formula. The screenshot you pasted looks different from the current reference though (check the link please). I therefore enclose a new picture here below to answer your pts. 2. and 3.
Just take a look please, maybe I misunderstood something :) |
|
From what I understand (and I could be wrong, please let me know if so) but I believe there is a problem with what's been said above. People are referring to equation (2.34) as the MSLL. This is incorrect - it is simply the negative log (Gaussian) likelihood. As highlighted above, the SLL is calculated by subtracting the loss obtained under the trivial model. To find the trivial model, simply calculate the mean and std of the y_test you're trying to predict and then plug these values into the negative log likelihood (2.34) to get your trivial loss. Subtract the trivial loss from the actual loss and you have the SLL. |
|
@scikit-learn/core-devs Are there other opinions whether or not to include (scoring) metrics for a pair of point predictions like There is good literature for it, see https://www.jstor.org/stable/43974729 (theory heavy) and https://doi.org/10.1214/19-EJS1552 Eq 4.13, e.g. we know when such a metric is statistical consistent in the large sample limit. The easiest metrics would probably be an extension of the squared error, either
What would our API be? |
|
There are a bunch of distribution-free interval-based scikit-learn style metrics available here as well: mapie.metrics. For the API, if it has to be consistent with taking two arguments only, one more option could be |
|
I don't think that we should restrain ourselves to the current metric API (i.e. only two parameters). If I recall, the clustering metrics are already different.
Our API for the "Bayesian" estimator has never been too much discussed. Since all of those can in general return the estimate of the mean and the standard deviation, I would expect our metric to take those arguments as input. |
|
Then if we considered MAPIE and potentially think ahead of a new API that would return different estimates, then we would probably want to have a different API for these metrics. But I am unsure that we should prevent adding such a metric for this reason. |
|
I'm okay with including metrics which consume expectation and variance, even if this changes the metrics API. |
|
For me, it is more a question whether or not we provide models to compute both. Currently we have gaussian process and bayesian ridge and, in a way, bayesian mixture. So yes, we do. |
Describe the workflow you want to enable
Why MSLL?
Traditional metrics such as
mean_squared_errororr2_scoremay not be able to correctly evaluate uncertainty aware models because they do not take predictive standard deviation (y_std) into account.Why sklearn?
To the best of my knowledge, I am unaware of any other library in Python that is widely used and has a well-organized, standardized set of metrics implemented for ML regression models.
Mean Standardized Log Loss (MSLL)
If the above equation (standardized log loss) is averaged over all the values in
y_predandy_std, the resultant metric is Mean Standardized Log Loss (MSLL). The above equation is derived from Eq. 2.34, pp. 23 in GPML book - Cited by 23541.Properties
y_predandy_std, like GaussianProcessRegressor).Which algorithms from sklearn can use this metric?
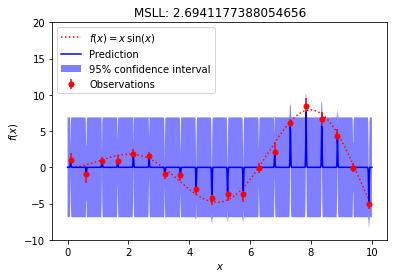
A demo
An overfitted model (high MSLL)
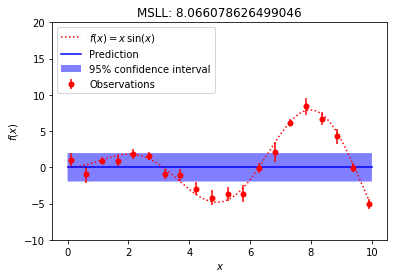
An underfitted model (very high MSLL)
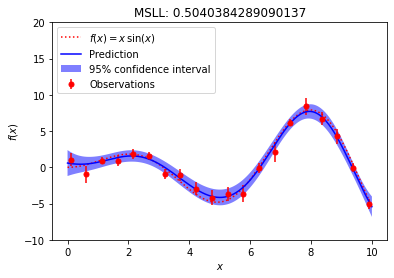
A well-fitted model (low MSLL)
A comparison between RMSE and MSLL
MSLL is high if the prediction intervals are not well calibrated, on the other side, RMSE can not take this criterion into account.
Describe your proposed solution
A PR to include
mean_standardized_log_lossinsklearn.metrics.Potential usage
A rough version of
mean_standardized_log_lossfunction:Describe alternatives you've considered, if relevant
No response
Additional context
A set of publications that have used MSLL as a metric
Acknowledgement
I would like to thank @wesselb for suggesting this metric for the first time to me.
The text was updated successfully, but these errors were encountered: