Sampling uncertainty on precision-recall and ROC curves #25856
Comments
|
I am actually interested in this topic. I reactivated some works that I started in #21211 last week. The idea is to provide some uncertainty measures for the different displays. Our original thought was to use cross-validation (using I will have a look at the paper to get a better understanding of the statistical aspect of the confidence intervals. Somehow, reading the thread tells me that we need to be extra careful when reporting error bars: we need to be explicit on what those mean, i.e. what type of uncertainties are we providing. |
|
Yes, we saw you pull request before, see my comment above.
Let me know if you want the suggested feature, and I will open the PR. |
IIUC, this issue is quite explicit by asking for sample uncertainty of the (test) data, given a fixed model (i.e. no cross validation). This would be similar to the plotting capabilities of https://lorentzenchr.github.io/model-diagnostics/. @stephanecollot It is easier to open separate issues for your suggested plot improvements. |
Yes exactly
Could you point me more specifically where (and how) the sample uncertainty is computed in model-diagnostics?
Ok here is the separate issue for plot improvements: #25929 |
It‘s best seen in the example. The simplest function is |
|
@lorentzenchr, interesting package, thanks for sharing! I see that it plots uncertainties on the calibration curves (i.e. std of the difference between prediction and observed values). We are proposing some quite different on the 2D uncertainties for PR or ROC curves. (In particular for PR curves the 2D correlation is non-trivial.) We think it would be very nice to integrate this in sklearn, so anyone can use it. Code is ready on my side; I'm waiting for a confirmation that sklearn want the feature before opening the pull request. |
|
This issue proposes to add sample uncertainties to ROC and PR curves. While the paper clearly fails our inclusion criteria, the proposed method using Wilk’s theorem is much older. I personally like it to visualize uncertainty. @scikit-learn/core-devs @scikit-learn/contributor-experience-team @scikit-learn/communication-team opinions welcome. |
|
I don't think this section "What are the inclusion criteria for new algorithms?" applies here, since it is not really an algorithm that does fit/transform. |
|
I think this would be a useful tool to have. As I understand it this tool allows you to estimate how well you know the performance of your fitted estimator, given the test dataset. This means it should be easy to demonstrate in an example that the uncertainty reduces as you increase the size of the test dataset (keeping everything else fixed). If the above understanding is correct then I'd vote for adding this. |
|
I still did not get time to read the paper but I am +1 for adding uncertainty visualization. Here, I think that we should get them via I would find it complementary with the |
|
Yes, ok I will open the PR soon. |
@betatim you're correct. A quick example: from sklearn.datasets import make_classification
from sklearn.linear_model import LogisticRegression
from sklearn.model_selection import train_test_split
import mmu
from mmu.viz.utils import _set_plot_style
_ = _set_plot_style()
seeds = mmu.commons.utils.SeedGenerator(2343451)
X, y = make_classification(
n_samples=2000, n_classes=2, random_state=seeds()
)
X_train, X_test, y_train, y_test = train_test_split(
X, y, test_size=0.5, random_state=seeds()
)
model = LogisticRegression(solver='lbfgs')
model.fit(X_train, y_train)
y_score = model.predict_proba(X_test)[:, 1]
err_500 = mmu.PRU.from_scores(y=y_test[:500], scores=y_score[:500])
err_1000 = mmu.PRU.from_scores(y=y_test[:1000], scores=y_score[:1000])
ax = err_500.plot(other=err_1000)produces |

Describe the workflow you want to enable
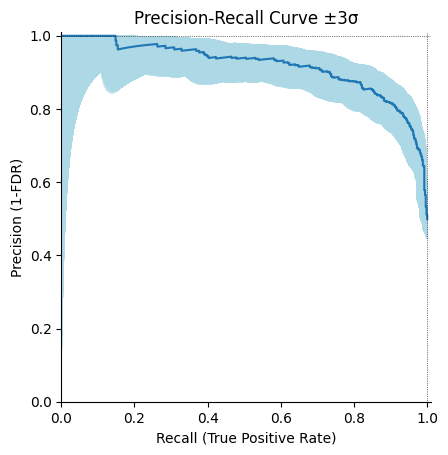
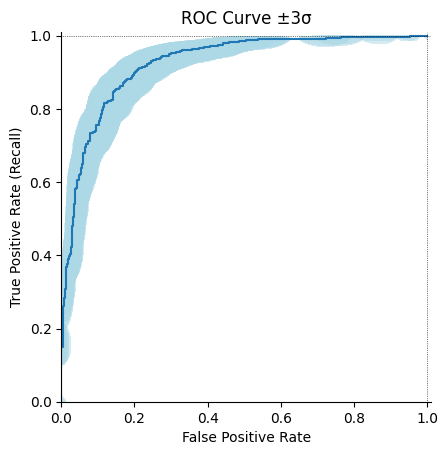
We would like to add the possibility to plot sampling uncertainty on precision-recall and ROC curves.
Describe your proposed solution
We (@mbaak, @RUrlus, @ilanfri and I) published a paper in AISTAT 2023 called Pointwise sampling uncertainties on the Precision-Recall curve, where we compared multiple methods to compute and plot them.
We found out that a great way to compute them is to use profile likelihoods based on Wilks’ theorem.
It consists of the following steps:
We have a minimal pure Python implementation:
https://github.com/RUrlus/ModelMetricUncertaintyResearch/blob/sklearn_pull_request/notebooks/pr_ellipse_validation/demo_ROC_PR_curves_sklearn_pull_request.ipynb
And a C++ implementation: the paper is supported by our package ModelMetricUncertainty which has a C++ core with, optional, OpenMP support and Pybind11 bindings. Note that this package contains much more functionality than the above notebook. The core is binding agnostic allowing a switch to Cython if needed. Upside is that it is much faster (multiple orders) than the above Python implementation at the cost of complexity.
The pure Python implementation would look like this:

I’m also suggesting other visual improvements:
With those it can look like this:
Remark: I set the contour color to lightblue, let me know if it is fine.
We need to align on the API integration. I suggest adding some parameters in
PrecisionRecallDisplayand inRocCurveDisplaycalled:uncertainty=Trueto enabel plot uncertainty band (orplot_uncertainty_style=?)uncertainty_n_std=3to decide how +/- standard deviation the band should beuncertainty_n_bins=100to decide how fine-grained the band should be (see remark about running time)Describe alternatives you've considered, if relevant
Other ways to compute uncertainties are evaluated in our paper.
We have noticed that there is open pull request on related topic: #21211
That is great, however cross-validation covers different sources of uncertainties, and has some limitations (a bias is introduced by overlapping training folds, introducing a correlation in the trained models. In addition, this uncertainty depends on the size of a fold, and is likely larger than on the test set, see ref.)
Additional context
Running time discussion
Here is an analysis of the running time of this pure Python method:
The execution time depends on the number of points (i.e. thresholds) plotte and on
uncertainty_n_bins.With a surrounding grid of
uncertainty_n_bins=100per point it is fast enough and fine enough.There is barely any noticeable visual difference between 50 and 100 (or more) points (at least in this example), see curves.
For let’s say for a 100k set, it is too slow for ROC, because there is much more thresholds, but this is going to be fixed soon here #24668 . But anyway, in this case, the uncertainties are really small, so plotting them doesn’t really make.
The text was updated successfully, but these errors were encountered: