Add compositional to scipy.stats for compositional data analysis
#12782
Comments
|
Hi Josh,
Thanks for your interest.
For our criteria on adding new features please read the page:
http://scipy.github.io/devdocs/dev/core-dev/index.html#deciding-on-new-features
From reading what is written in the issue I’m unclear on the specific proposal. I agree coda is a useful field but some of the items referenced in the writeup are very biological specific. I’d recommend to reduce the scope of what you are proposing to a couple common statistical coda functions (which could either go in stats module or it’s own coda module in stats) and propose those on the dev list for inclusion. If those go in then you could see about adding more.
The compositional package has some dependencies the dev version of scipy does not support (e.g. pandas, gneiss) so thAts also a consideration.
…-L
On Aug 27, 2020, at 2:44 PM, Josh L. Espinoza ***@***.***> wrote:
Is your feature request related to a problem? Please describe.
Absolutely. Compositional data analysis [CoDA] is large in fields such as bioinformatics, geology, and economics.
In statistics, compositional data are quantitative descriptions of the parts of some whole, conveying relative information. Mathematically, compositional data is represented by points on a simplex. Measurements involving probabilities, proportions, percentages, and ppm can all be thought of as compositional data.
https://en.wikipedia.org/wiki/Compositional_data
Describe the solution you'd like
To have a compositional section in scipy.stats that, at the very least, has common CoDA methods such as closure, center log-ratio, isometric log-ratio, etc. Currently some of the methods are implemented in scikit-bio but I feel that they are much more generalizable to more sciences.
There are also correlation-style pairwise operations that are robust to bias from compositionality. This figure sums up why this is important from Morton et al.
One of the most practical pairwise operations is the rho metric originally published in Lovell et al. 2015, adapted by Erb et al. 2016, and implemented in R by Quinn et al. 2018 in the propr R package. I've reimplemented key metrics such as rho, phi, and variance log-ratio in my compositional Python package that have been optimized to make use of vectorization in numpy. rho is a drop-in replacement for correlation where the values range from -1 to 1 and phi is the unscaled version of rho. variance log-ratio is akin to a distance measure I believe.
I would like for these to be integrated into the scipy ecosystem to be more accessible to not only bioinformaticians but geologist and other sciences that use compositional data. Currently, most of the implementations either use many dependencies, do not fully make use of numpy vectorization for speed, or are available only in R.
Describe alternatives you've considered
I've been using 3rd party packages (scikit-bio and gneiss) and developed my own (https://github.com/jolespin/compositional).
Additional context (e.g. screenshots)
This figure is also helpful in describing the rationale:
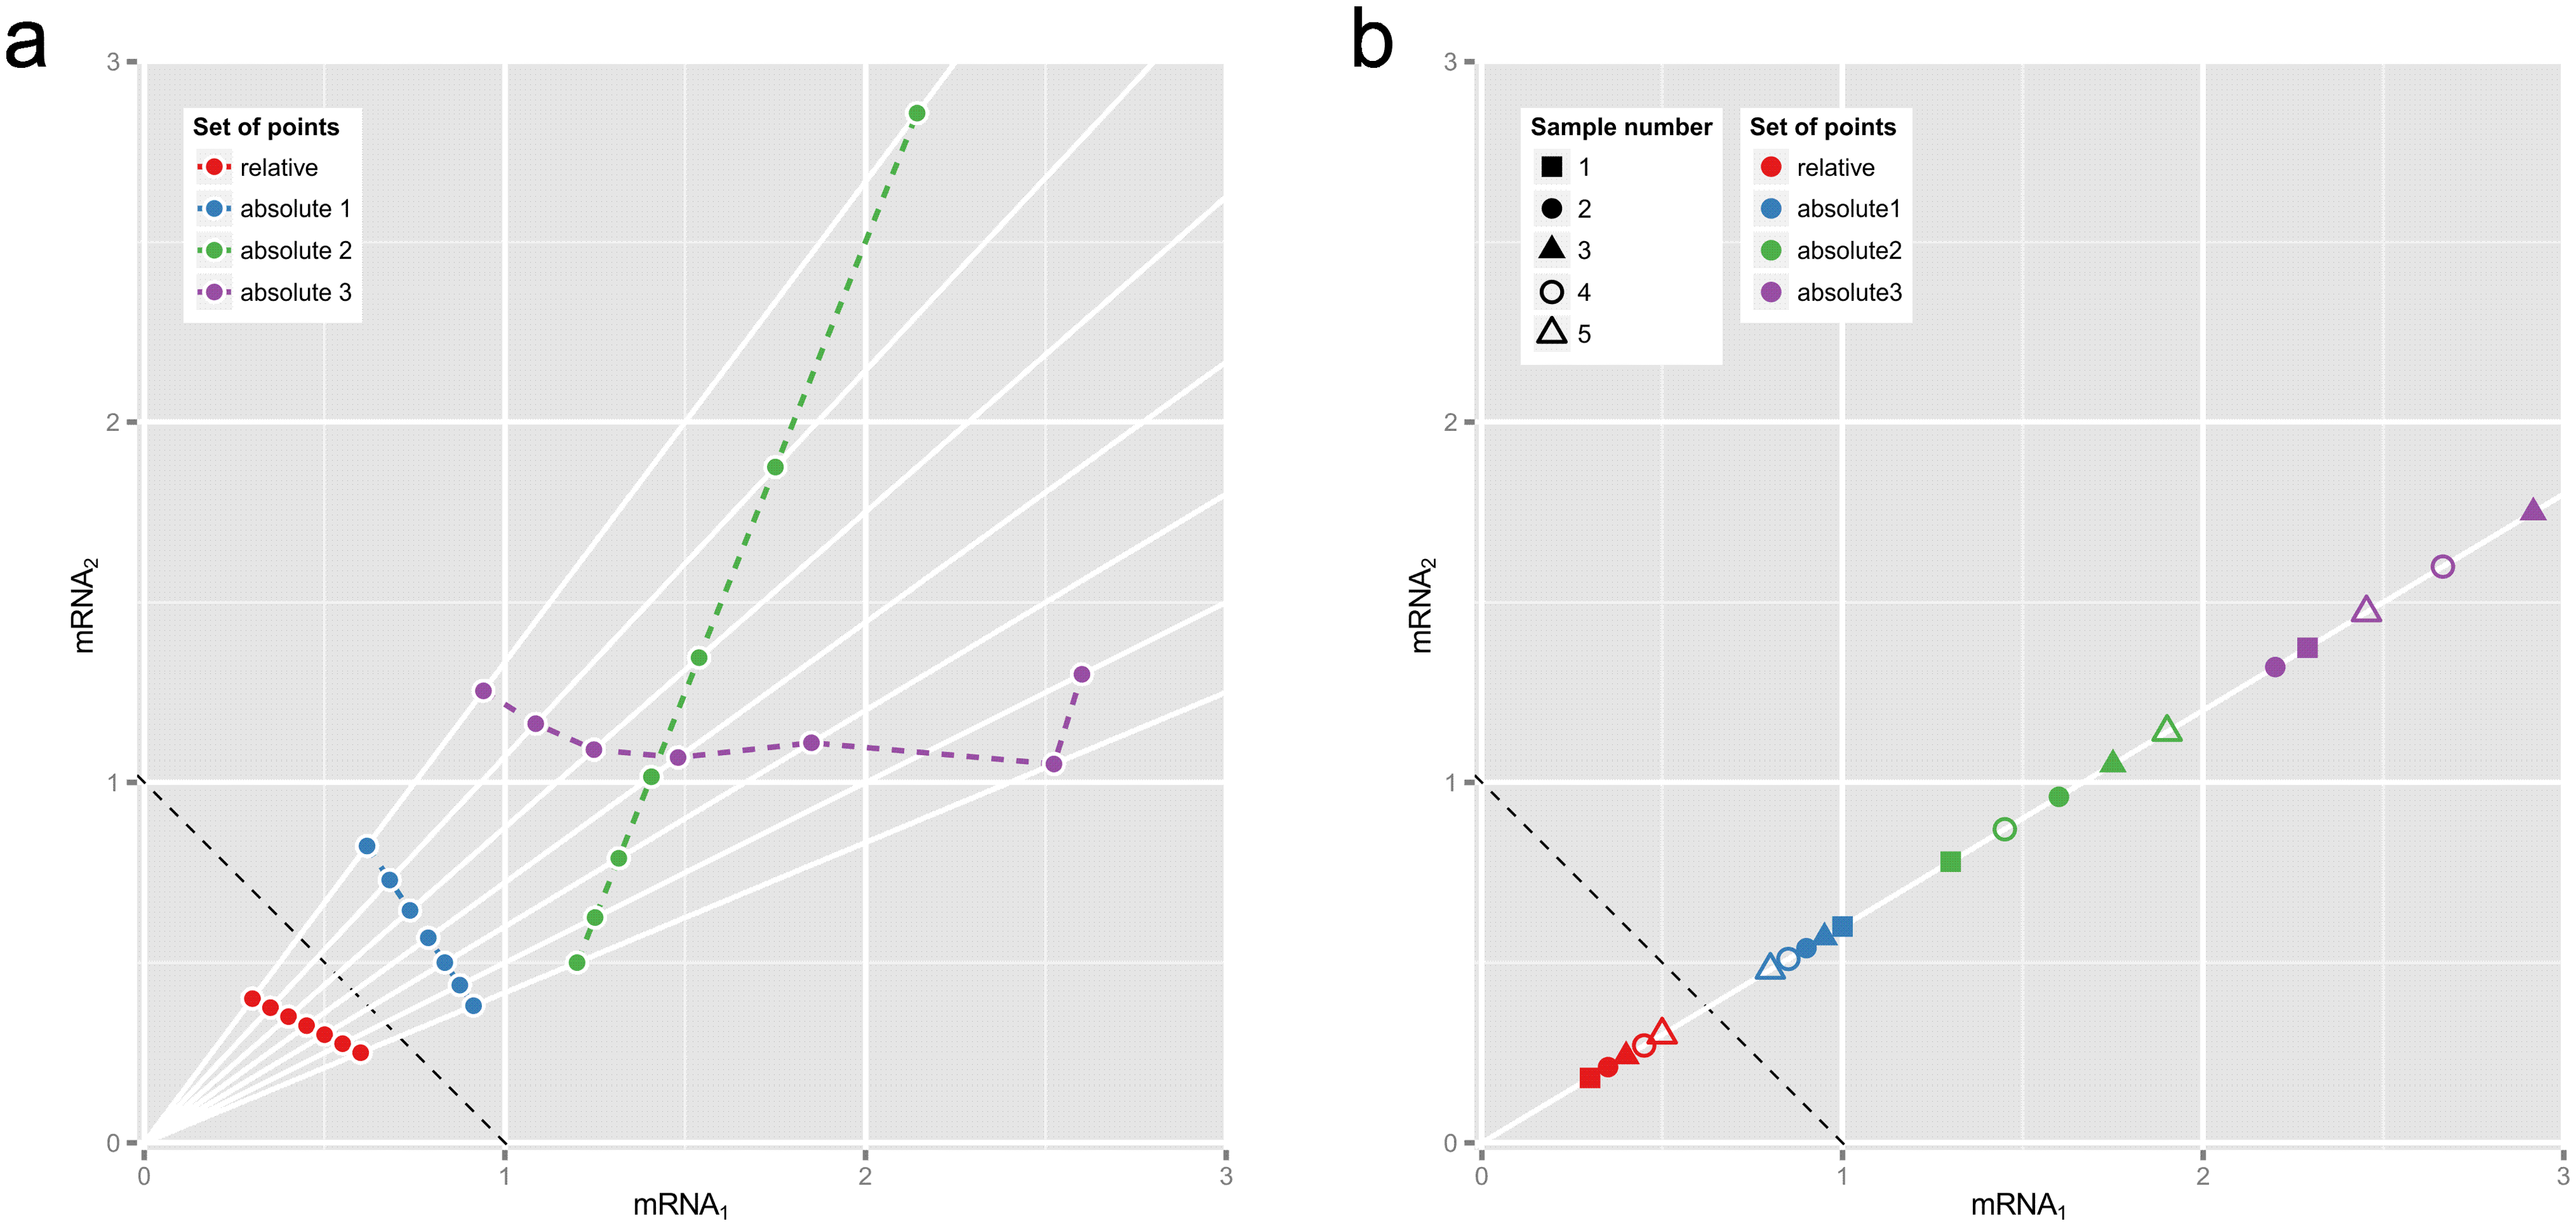
Fig 1. Why correlations between relative abundances tell us absolutely nothing.
These plots show two hypothetical mRNAs that are part of a larger total. (a) Seven pairs of relative abundances (mRNA1/total, mRNA2/total) are shown in red, representing the two mRNAs in seven different experimental conditions. The dotted reference line shows (mRNA1 + mRNA2)/total = 1.) Rays from origin through the red points show absolute abundances that could have given rise to these relative abundances, e.g., the blue, green or purple sets of points (whose Pearson correlations are −1, +1 and 0.0 respectively). (b) Relative abundances that are proportional must come from equivalent absolute abundances. Here the blue, green or purple sets of point pairs have the same proportionality as the pairs of relative abundances in red, though not necessarily the same order or dispersion.
https://journals.plos.org/ploscompbiol/article/figure/image?size=large&id=10.1371/journal.pcbi.1004075.g001
Key resources:
Gloor et al. 2017
Quinn et al. 2018
Lovell et al. 2020
Quinn et al. 2019
Lovell et al. 2015
Erb et al. 2016
Morton et al. 2016
Morton et al. 2019
—
You are receiving this because you are subscribed to this thread.
Reply to this email directly, view it on GitHub, or unsubscribe.
|
|
I'll look into the specifics as I know it must meet a lot of criteria. I've updated this post to include publications from other fields: The Here's a statement on generalizability from experts in the field:
http://www.compositionaldata.com/ Publications from other domains (not microbial ecology):
|
|
The methods I propose would be the following:
However, we would want to talk to the developers at I also propose the following pairwise metrics: I suggest that |
|
Do you have a link out to documentation requirements? I want to make sure I do this right. Once I get my code in a shareable form that meets SciPy criteria I will loop in the skbio group to see if they would like to contribute. |
|
Hi Josh,
Did you propose this on the scipy-dev email list?
I’d really prefer to get more than only my opinion before having you go through the effort you’re describing.
WRT to documentation, there is a general structure which you can see by looking through the source of say, stats.py module.
I can’t recall if we’ve made separate pages for doc standard. The old dev docs used to point to the numpy dev-docs so I’ll point you to those:
https://numpydoc.readthedocs.io/en/latest/format.html#docstring-standard
That page might seem a little abstract so please also look at an example or two in the stats module to get an idea.
…-L
On Sep 6, 2020, at 11:26 PM, Josh L. Espinoza ***@***.***> wrote:
Do you have a link out to documentation requirements? I want to make sure I do this right. Once I get my code in a shareable form that meets SciPy criteria I will loop in the skbio group to see if they would like to contribute.
—
You are receiving this because you commented.
Reply to this email directly, view it on GitHub, or unsubscribe.
|
|
I'll add my two scents as a user:
|
|
Coming back to this now that I've graduated (sorry it went stale). What's still needed to get VLR and RHO in scikit-bio? |
Looks like a clean package but I don't if some of the implementations are optimized. For example, the |
Is your feature request related to a problem? Please describe.
Absolutely. Compositional data analysis [CoDA] is large in fields such as bioinformatics, geology, and economics.
Describe the solution you'd like
To have a
compositionalsection inscipy.statsthat, at the very least, has common CoDA methods such as closure, center log-ratio, isometric log-ratio, etc. Currently some of the methods are implemented inscikit-biobut I feel that they are much more generalizable to more sciences.There are also correlation-style pairwise operations that are robust to bias from compositionality. This figure sums up why this is important from Morton et al.
One of the most practical pairwise operations is the
rhometric originally published in Lovell et al. 2015, adapted by Erb et al. 2016, and implemented in R by Quinn et al. 2018 in the propr R package. I've reimplemented key metrics such asrho,phi, andvariance log-ratioin mycompositionalPython package that have been optimized to make use of vectorization innumpy.rhois a drop-in replacement for correlation where the values range from -1 to 1 andphiis the unscaled version ofrho.variance log-ratiois akin to a distance measure I believe.I would like for these to be integrated into the
scipyecosystem to be more accessible to not only bioinformaticians but geologist and other sciences that use compositional data. Currently, most of the implementations either use many dependencies, do not fully make use of numpy vectorization for speed, or are available only in R.Describe alternatives you've considered
I've been using 3rd party packages (
scikit-bioandgneiss) and developed my own (https://github.com/jolespin/compositional).Additional context (e.g. screenshots)
This figure is also helpful in describing the rationale:
https://journals.plos.org/ploscompbiol/article/figure/image?size=large&id=10.1371/journal.pcbi.1004075.g001
Key resources:
The text was updated successfully, but these errors were encountered: