BUG: Levy stable #14994
Comments
|
Hi @lady-pandas. import numpy as np
from scipy.stats import levy_stable
import matplotlib.pyplot as plt
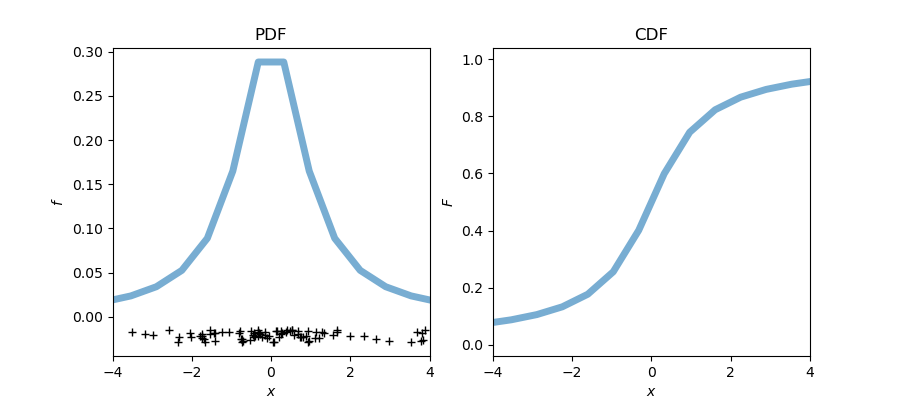
distribution = levy_stable(alpha=0.5, beta=0, loc=0, scale=1)
fig, axs = plt.subplots(nrows=1, ncols=2, sharex=True, figsize=(9, 4))
x = np.linspace(distribution.ppf(0.01), distribution.ppf(0.99), 100)
# PDF
pdf = distribution.pdf(x)
axs[0].plot(x, pdf, "-", lw=5, alpha=0.6)
# CDF
cdf = distribution.cdf(x)
axs[1].plot(x, cdf, "-", lw=5, alpha=0.6)
# Empirical PDF
sample = distribution.rvs(size=1000)
# discrete samples
delta = np.max(pdf) * 5e-2
axs[0].plot(sample[:100], -delta - delta * np.random.random(100), "+k")
axs[0].set(title="PDF", ylabel=r"$f$", xlabel=r"$x$", xlim=[-1000, 1000])
axs[1].set(title="CDF", ylabel=r"$F$", xlabel=r"$x$", xlim=[-1000, 1000])
plt.show()
|

|
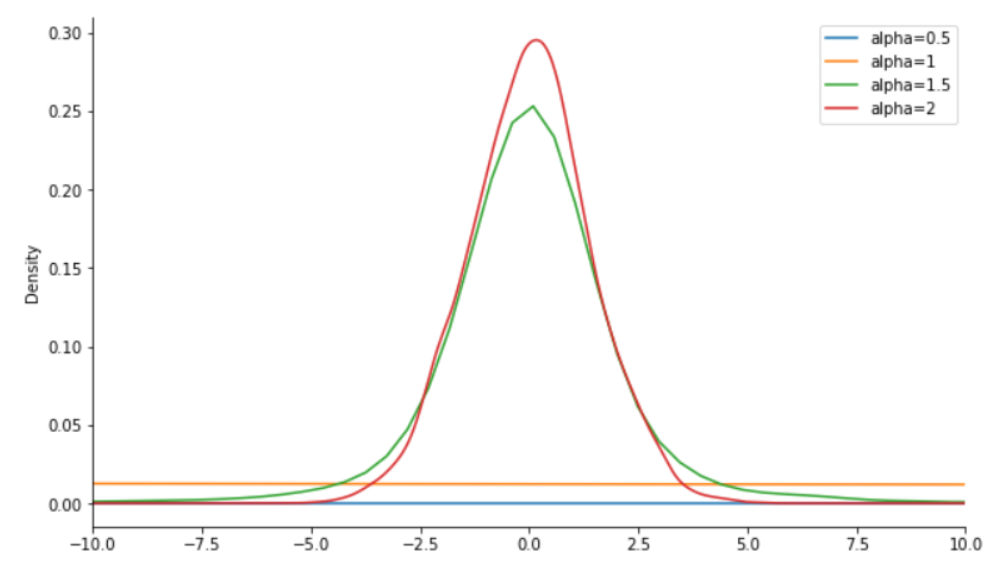
I have to disagree, of course I narrowed down the domain :) Here is how the output of scipy.stats looks like: And here is how it should look like: Best, |

|
Oh I see now, it's with Still for |
|
Actually there is some work in the way which I believe would fix this gh-9523. Among other things, there are explicit references to |
|
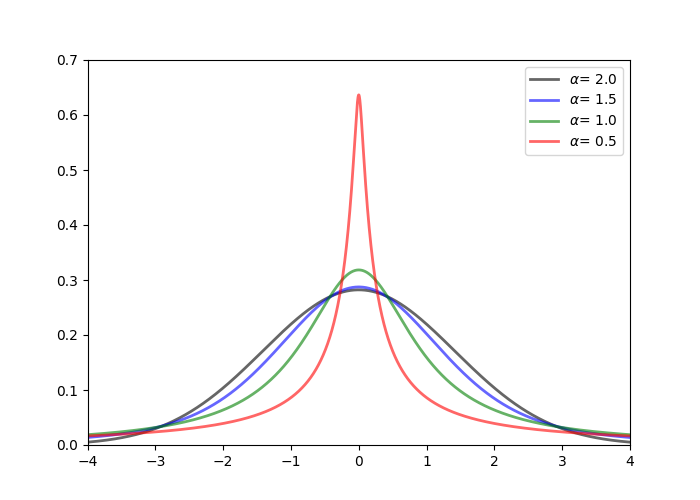
Hi @lady-pandas, gh-9523 has been merged. Thanks to the hard work of @bsdz and @ragibson I was able to reproduce the results from your plot with the following script. See the figure below. import numpy as np
from scipy.stats import levy_stable
import matplotlib.pyplot as plt
fig, ax = plt.subplots(nrows=1, ncols=1, sharex=True, figsize=(7, 5))
for alpha, color in zip(
[2.0, 1.5, 1.0, 0.5],
['black', 'blue', 'green', 'red'],
):
distribution = levy_stable(alpha=alpha, beta=0, loc=0, scale=1)
x = np.linspace(-4.0, 4.0, 10000)
pdf = distribution.pdf(x)
ax.plot(
x, pdf, "-", lw=2, alpha=0.6, color=color, label=f"$\\alpha$= {alpha}"
)
ax.set_xlim([-4.0, 4.0])
ax.set_ylim([0.0, 0.7])
ax.legend()
plt.show()
|
Describe your issue.
Behaviour of generated levy-stable distribution is not compliant with expected one (https://en.wikipedia.org/wiki/Stable_distribution)
Reproducing Code Example
Error message
SciPy/NumPy/Python version information
1.5.2 1.21.0 sys.version_info(major=3, minor=7, micro=9, releaselevel='final', serial=0)
The text was updated successfully, but these errors were encountered: