add data export option to right-click menu #58
Comments
|
Actually, maybe a pop-up menu to "select which plottable to export" would be nice, as it would let the user only output a single signal. That way output is always XY. Edit: I got this started (b73bb9d) and all plottable objects now have a |
|
Feel free to let me know if I can be of any help at any point.
|
|
May I suggest to avoid SaveCSV for every plottable, and just create a JSON or XML with all plottables. It would be much easier to serialize from a Plottable tree class to JSON or XML. Just add one more item in the right click contextmenu of the user control. A JSON telegram can then be parsed by the data-logging program or sent via MQTT to a broker. Parsing an XML or JSON vs CSV does not represent a significant overhead. |
|
This turned out to be pretty easy! I implemented SaveCSV (4a04ffc) and added demos to the cookbook: https://github.com/swharden/ScottPlot/tree/master/cookbook#save-scatter-data I'll figure out the best way to add it to the right-click menu, because it will probably require creation of a pop-up dialog (to select which of multiple plots to save). I'll keep it simple but leave room to add other data format exports later. |
|
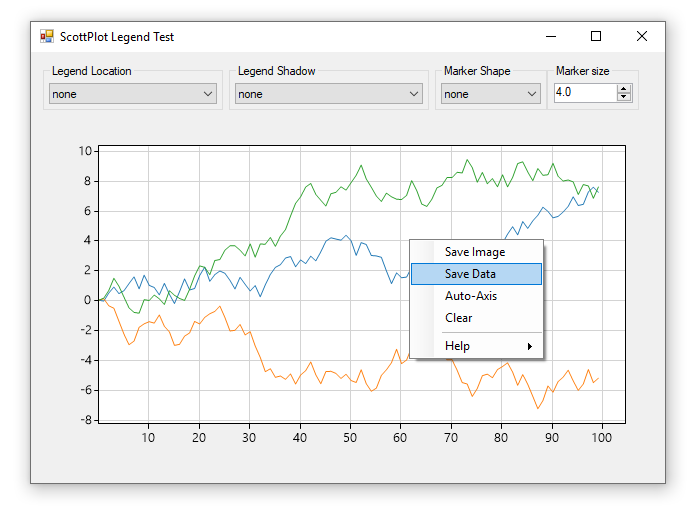
I added a "Save Data" button to the right-click menu. It only saves the first object plotted, and the menu item only lights up when the first object is savable as CSV (e.g., you can't save an axis line). It's a pretty light implementation, but we can add complexity if the need arises. The next step would be for a whole new dialog to pop up listing all the plottable objects, allowing the user select which plot to export, and allowing the user to select which format (XML, JSON, CSV), and things like precision and tab vs. comma separation. This seems like a pretty heavy addition, and if someone wants to work on that they can, but I'm happy to leave this where it is for now until we are ready to invite the additional complexity.
|
This feature would be useful for data-logging programs that display new data as it's measured.
This idea was initially raised by @bukkideme in #49
CSV output makes a lot of sense. It's easy to parse, and easy to load right into programs like Excel.
It gets a little complicated because a single plot may have several plottables, and they can have different X positions. Instead of XYYYY, the output probably needs to be XYXYXYXY.
The text was updated successfully, but these errors were encountered: