2 nodes stucked to stream data during bootstrap of new added node with replace #10814
Comments
|
@asias please investigate, let's revert the offending commit ASAP |
will do. |
Did we have two scylla process on the machine? In the log I saw both: What is the difference and why? |
|
Maybe we have --log-to-stdout and --log-to-syslog, and everything gets duplicated. |
|
I sure that there is single scylla running on node |
|
I tried to load the monitor data locally but it failed as: I used the monitor version from the tarball. |
|
Monitor is still alive if you need it |
|
@aleksbykov this is a replace operation which uses RBNO by default, so there will be no stream session only repair. |
|
@asias i saw log messages related to repair on new node (node) |
|
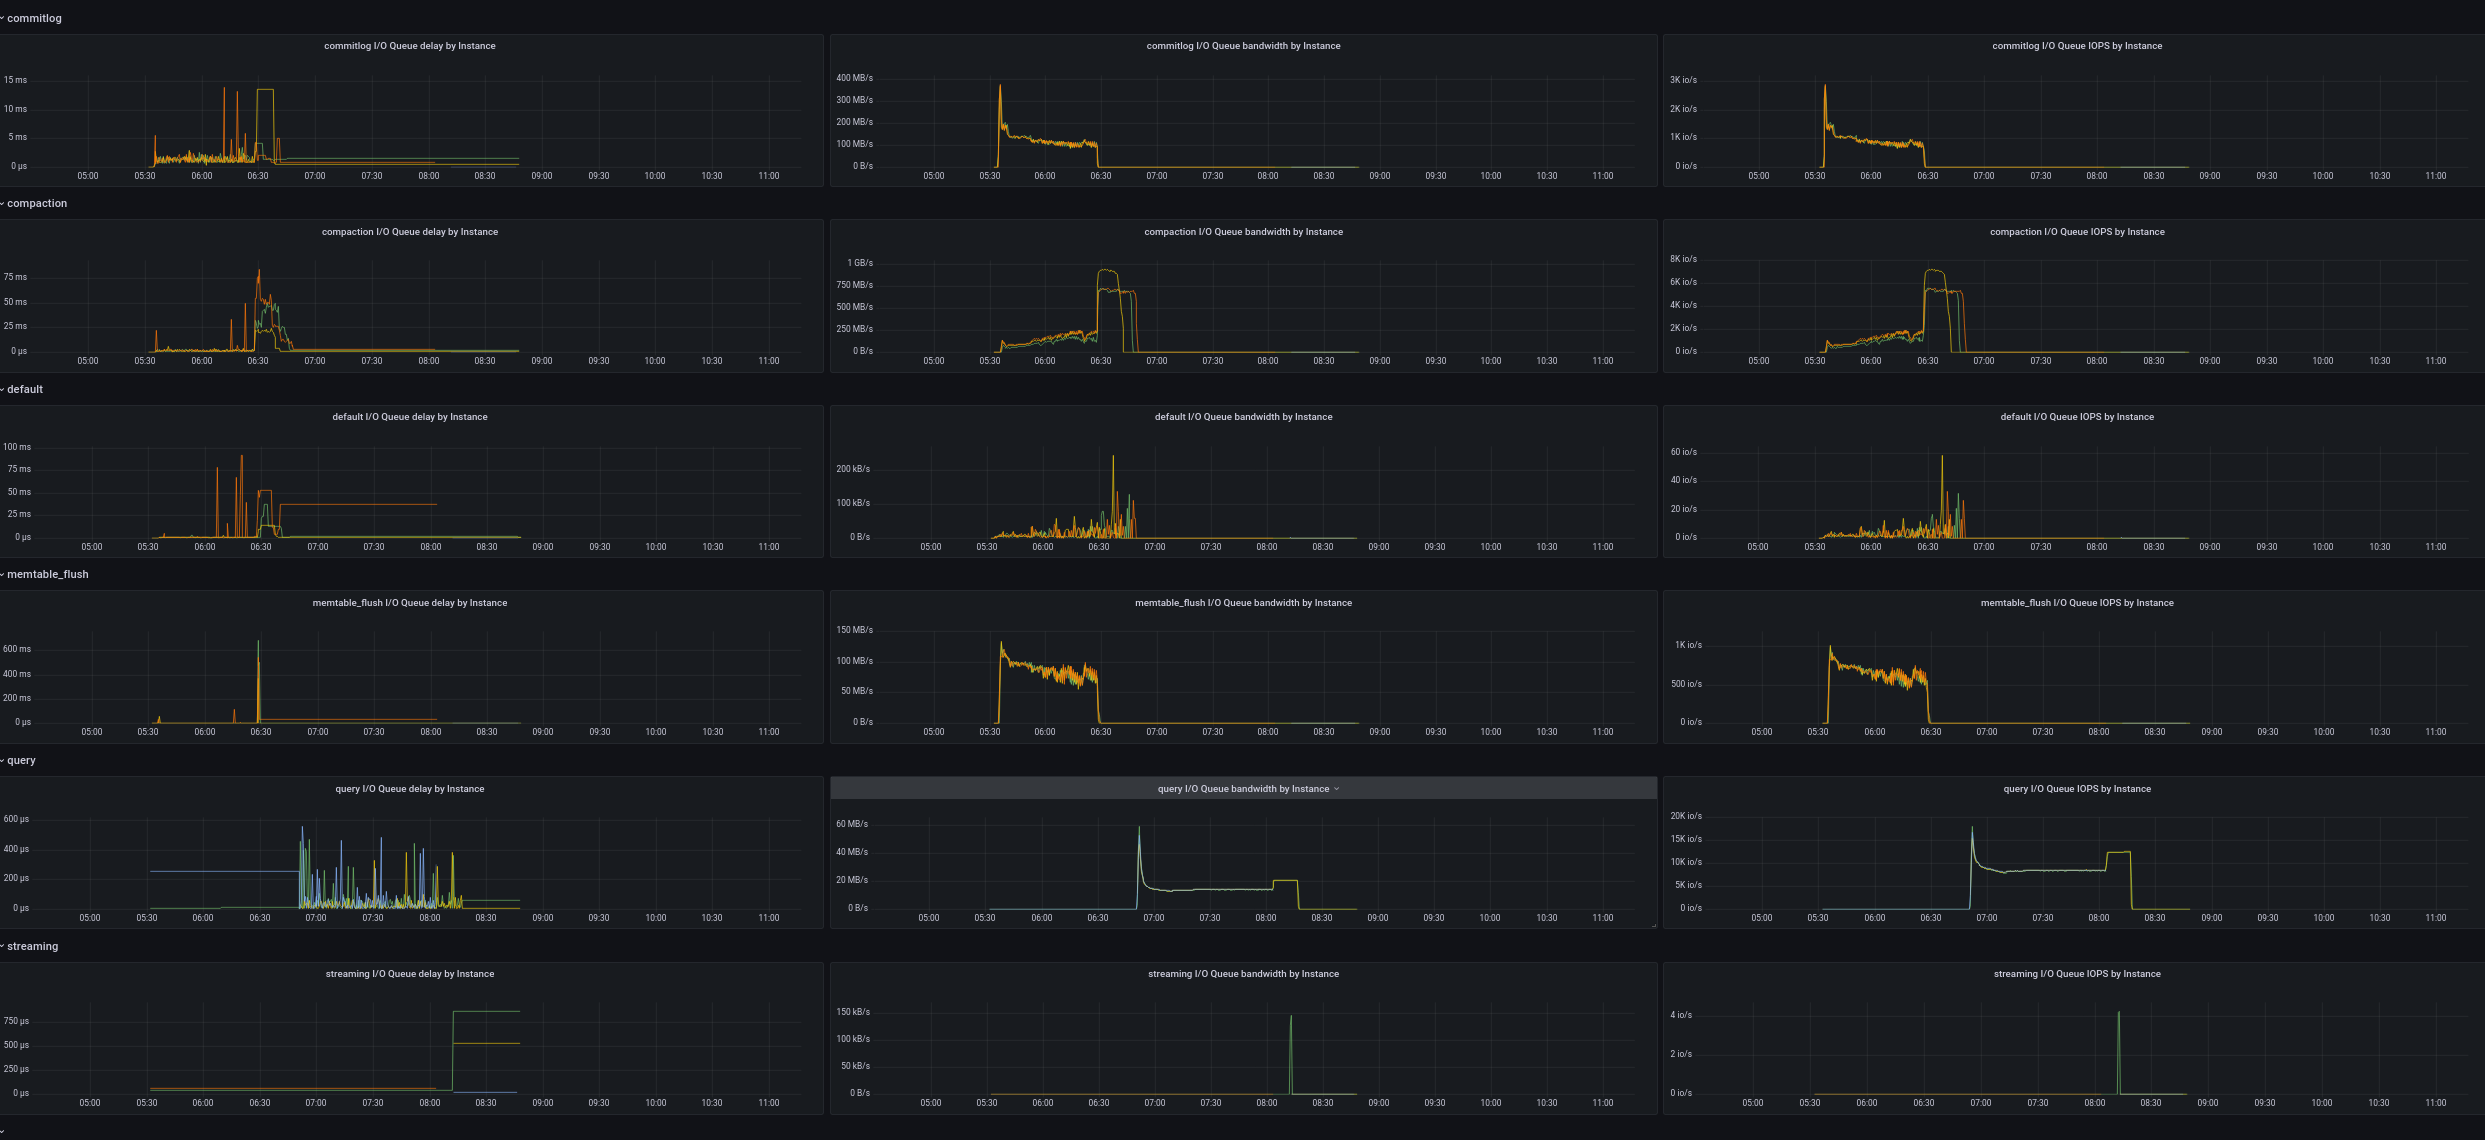
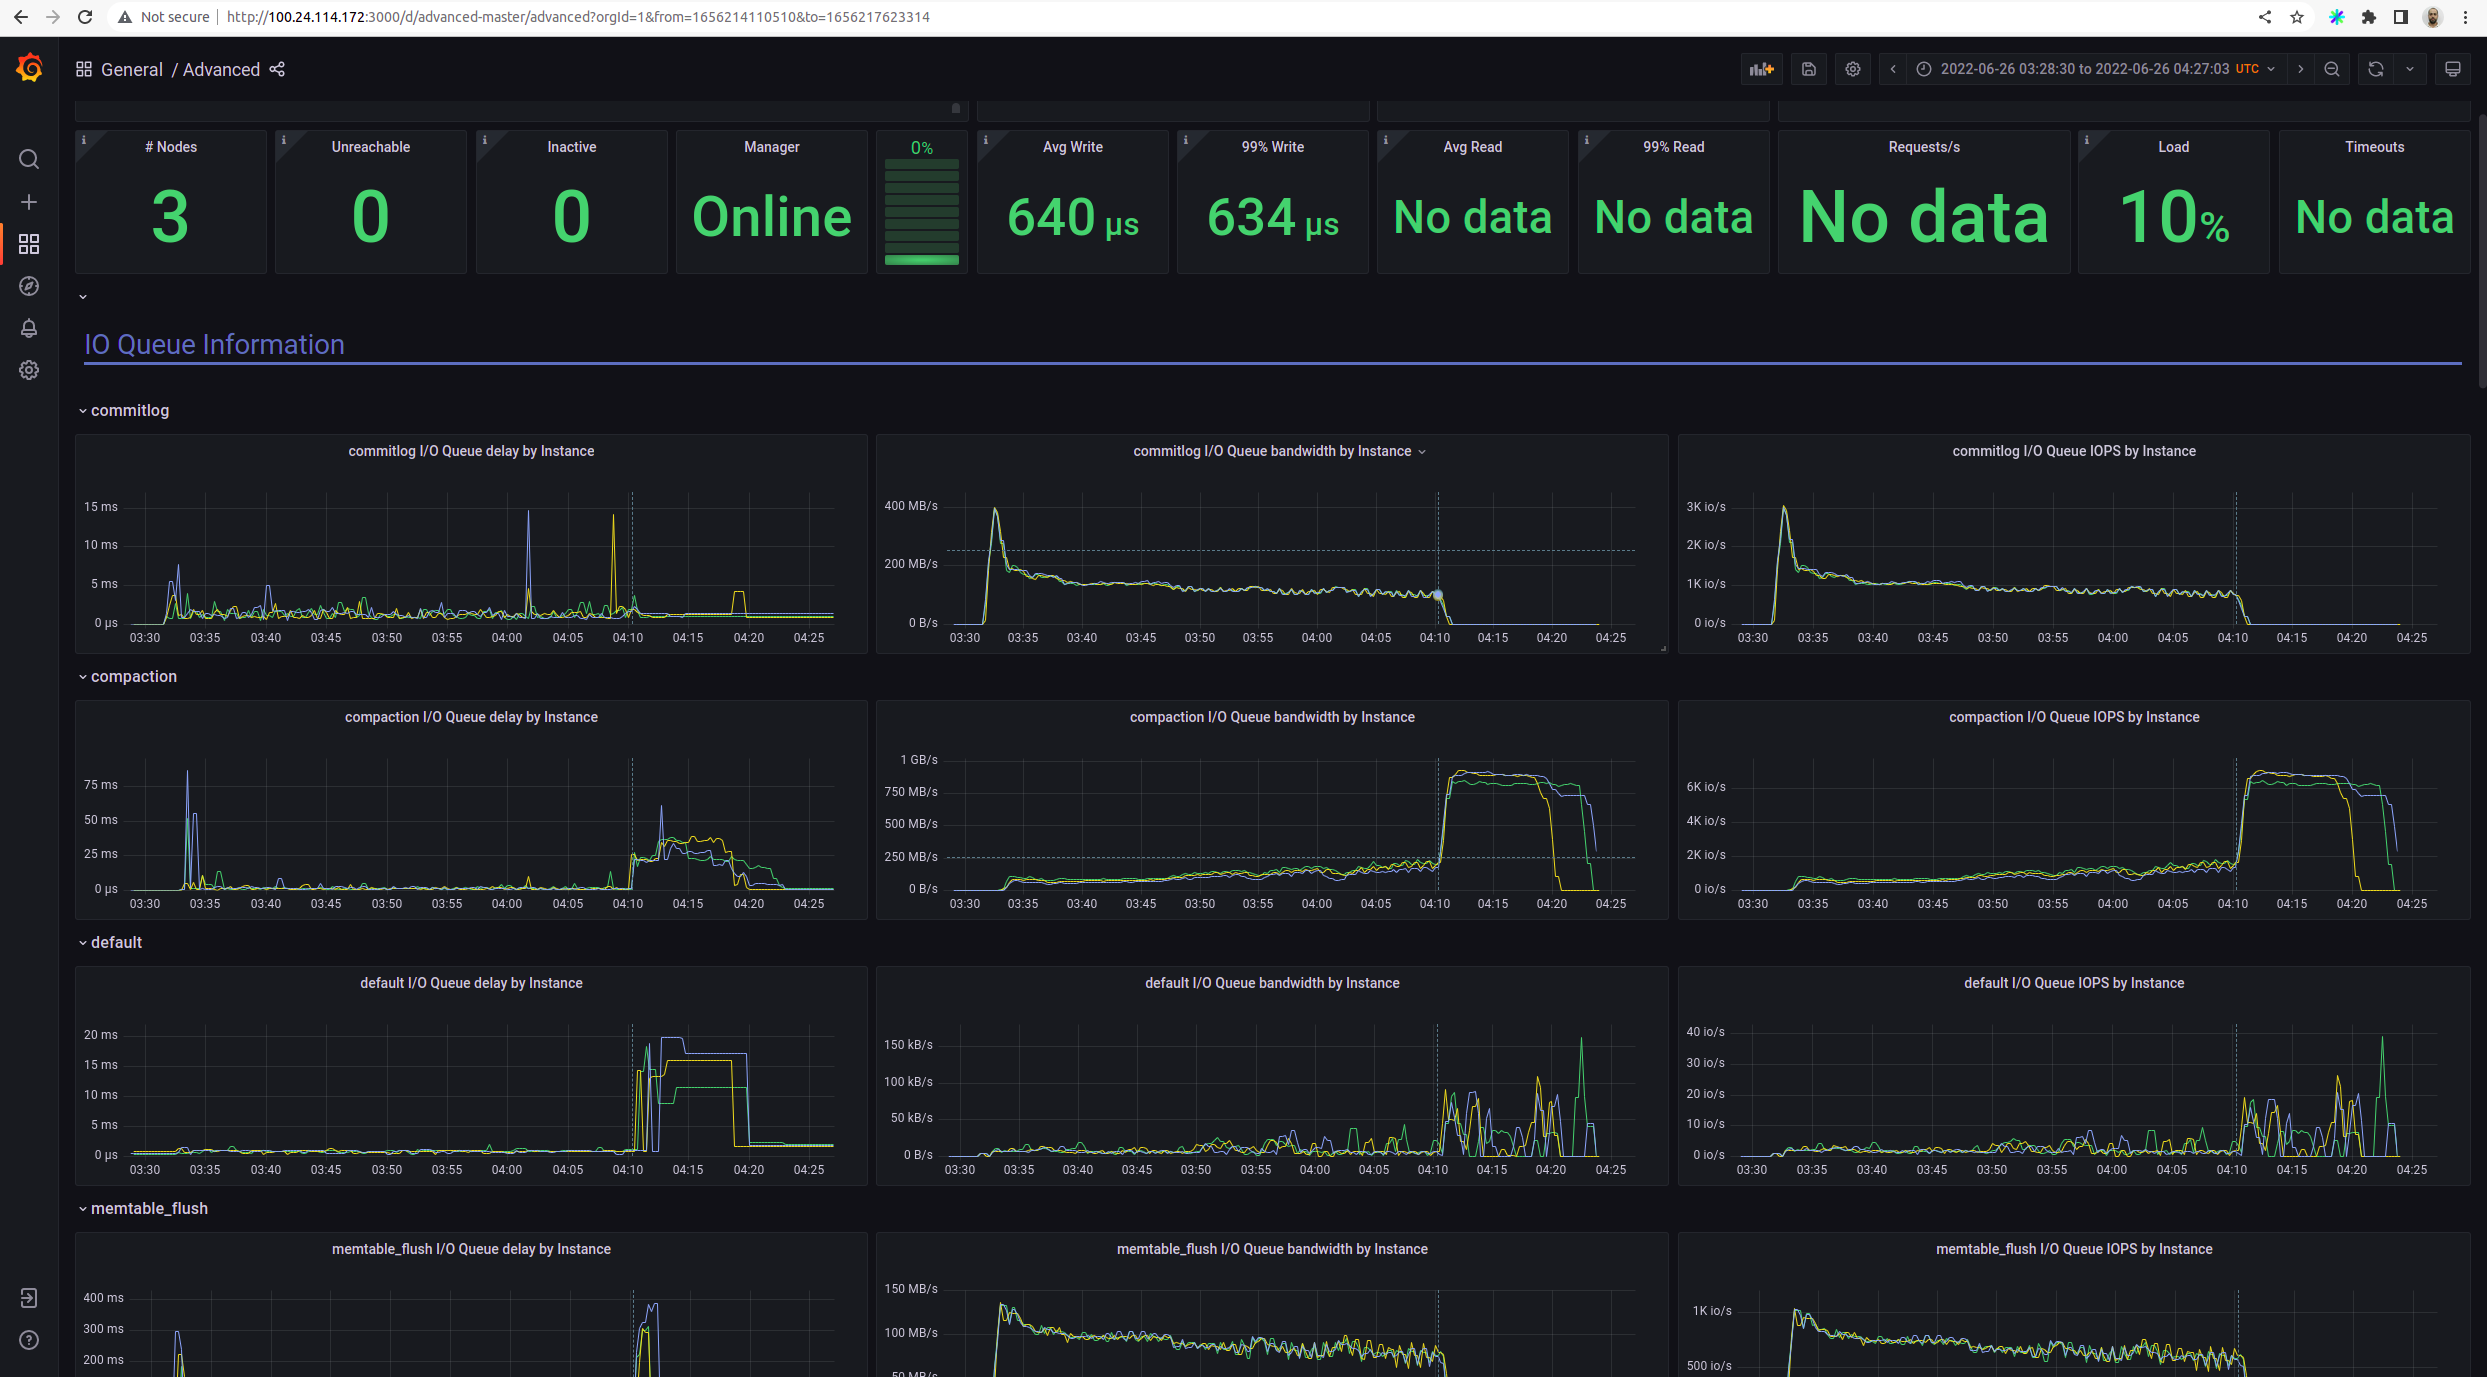
Looks like the cluster is already in a broken state even before replace after 07:00 Look the flat compaction / commit log io queue bandwidth. Also, repaird started but get almost zero io bandwidth from the streaming group. Is this related to the new io scheduler?
|

|
Streaming queue delay is zero, looks like no demand from that queue. |
|
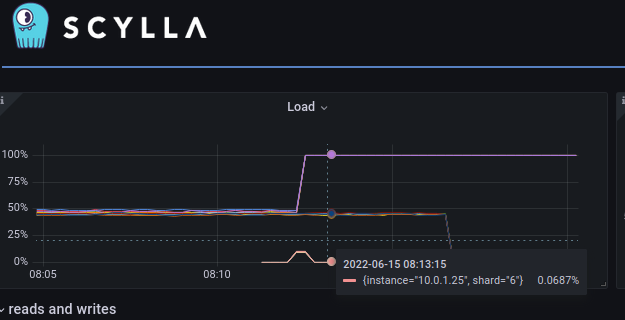
@amnonh Do we have any change in the monitor dashboard? Why did it only show one shard in the floating box? In the past, it shows all the shards at the pointed timestamp. |

|
node1 10.0.0.13
|

|
@asias here is another run when repair get stucked: db logs: https://cloudius-jenkins-test.s3.amazonaws.com/fb356fc1-abf7-4327-8602-305131c09805/20220617_092549/db-cluster-fb356fc1.tar.gz Replacing node4: has last meaningful messages: in this run the terminate and replace node is first nemesis which was run.So the cluster should be ok before it |
Strange. The detailed dashboard is missing.
|

There was a short repair for replace ops activity. Then it went to zero.
Both the replacing node (node4) and existing node (node1 below) had almost zero log after the 00:47. Looks like we have a dead lock similar to what we fixed recently (logger dead lock). node4 (replacing node) node1 |
|
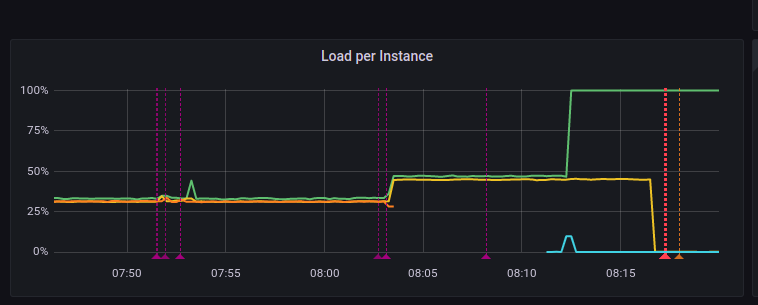
Utilization went to zero on all nodes around 01:00
|

|
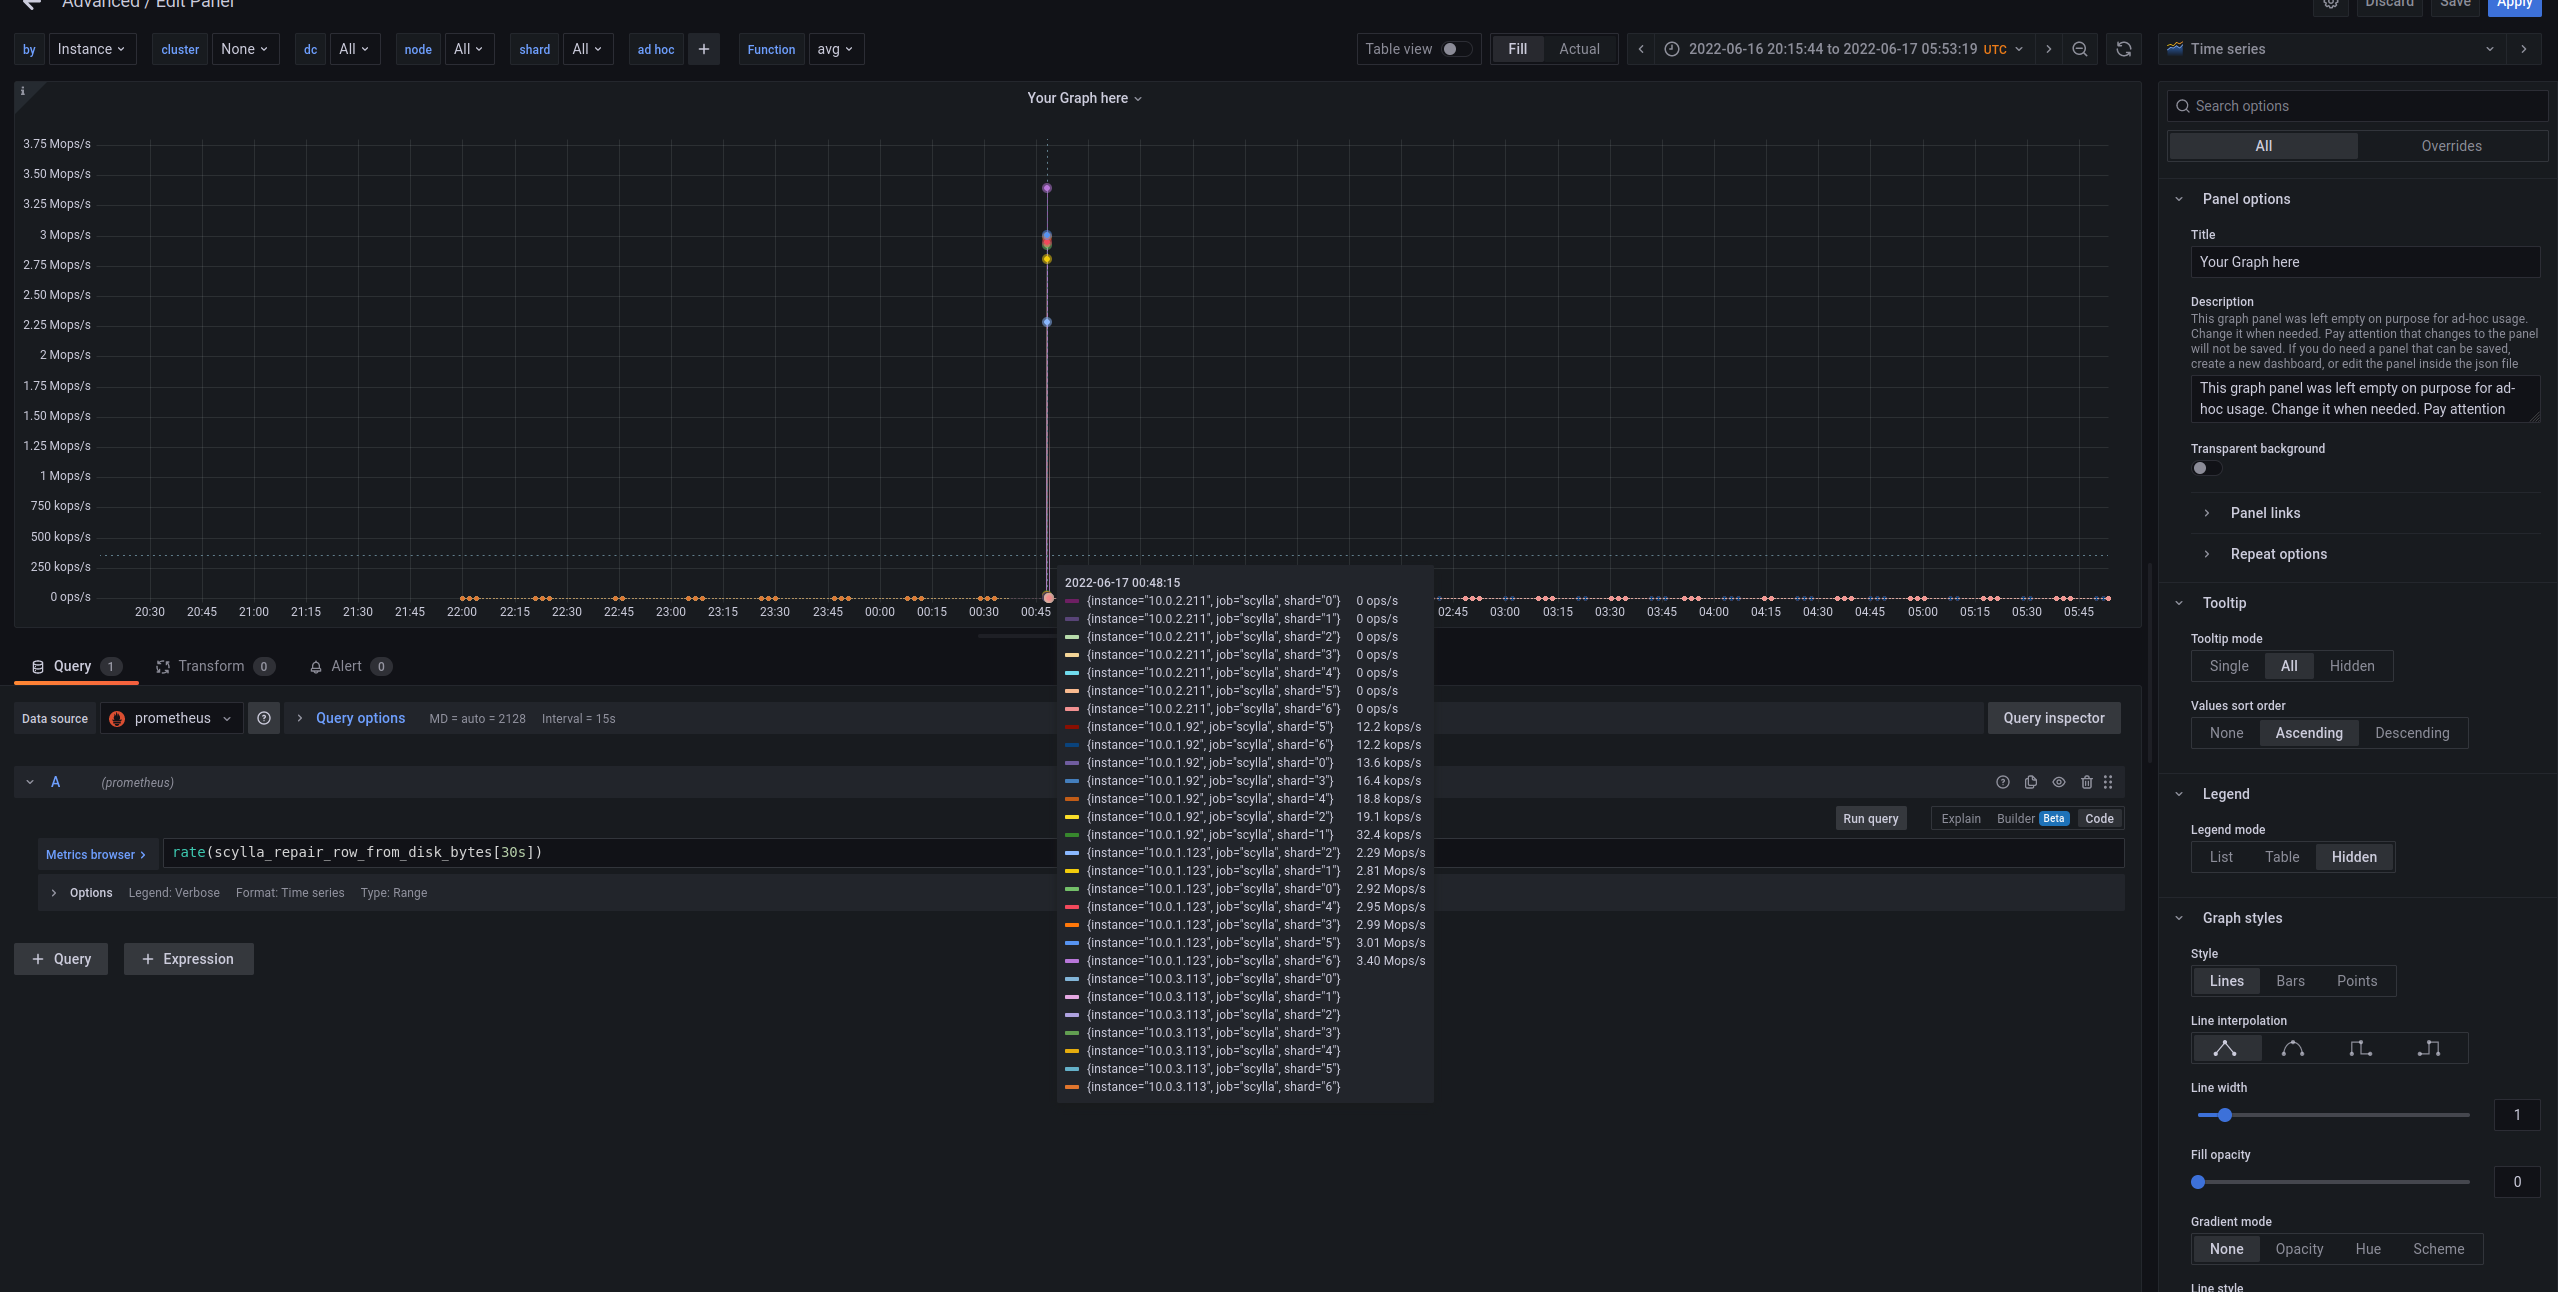
Both aio read and aio writes went to zero too after ~01:00
|

|
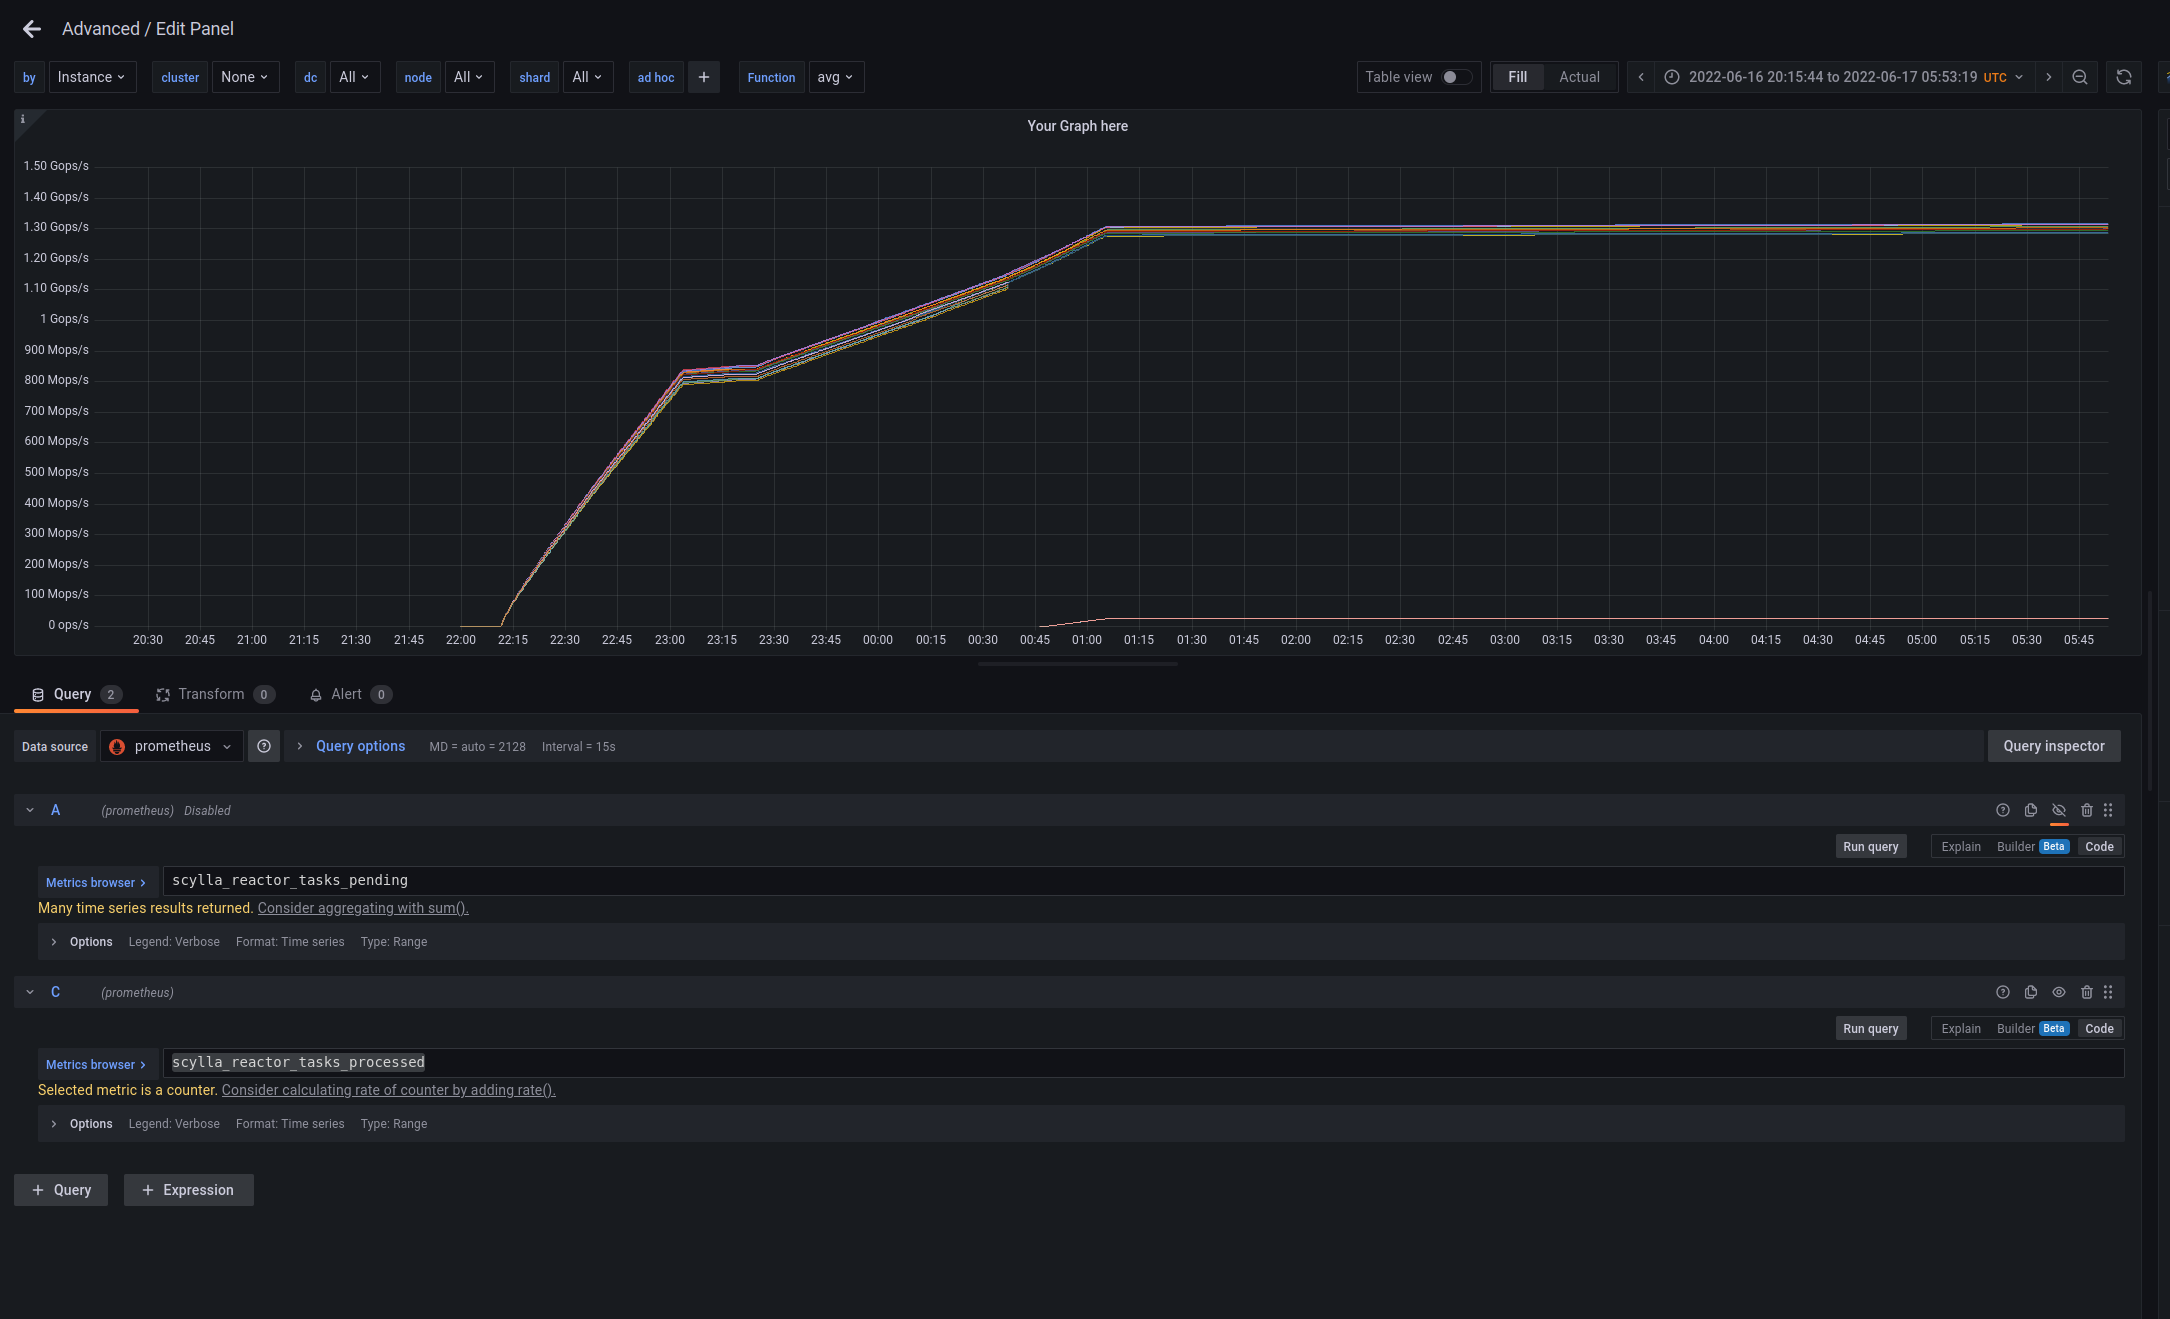
scylla_reactor_tasks_processed did not change after ~01:00 |
|
@aleksbykov will provide a reproducer job - and we will bisect in attempt to find the problematic commit |
|
Issue already reproduced with ami from 2022-05-31 after 3 hours 3 minutes. Here bootstrap looks stacked for node. CLuster is still alive: |
|
the officail job was passed with: |
|
Ok, so the suspected commit is one of these:
|
|
@slivne / @avikivity do you see any immediate suspect? |
|
e85bd37 is most suspect since it contains the most changes |
|
The following two merges look suspectful from e85bd37
|
When investigating stuck resharding problem #10743, I realized we have a problem in the producer, which reads data from input file. Now comes the similarity, resharding also uses streaming (maintenance) io group, so I wonder if it's hitting the same issue, as the effects are very similar to the ones described here. I suspected changes in I/O queue could be causing this. |
|
seastar update e85bd37 includes which is a suspect also for #10743 |
|
OK - so we will create builds before this and with this and validate this is the source. |
|
@bhalevy create two .deb with seastar bisect one prior to that change and one with it and lets see its the source. |
|
@roydahan @slivne I prepared the following dev packages: |
|
Possible root cause: |
|
seems like i'm seeing something similar, with a build from last week what happens in my case is that during prepare of perf with nemesis test (we run it with
for now i'm keeping the monitor alive, while i'm checking for other clues, also to understand if this is the same issue, or a new one: in any case, logs can be found here:
@roydahan , FYI |

|
and i'm seeing the same behavior, since its monitor is here: and the screenshot is here:
|
|
@fgelcer whats the current state - can we close the issue - AFAIK this was fixed |
|
Yes, the issue no longer exist since the offending commit was reverted. |
|
for the first in a very long time, the latency with nemesis job finished with green status:
|


|
just hope the culprit will contain the fix, and the issue is not exactly fixed, but it was only reverted from master |
Scylla version: 5.1.dev-0.20220607.605ee74c39b2 with build-id 0cfb2d9236f29831498982e4b3e9325b787ccb4c
Scylla version: 5.1.dev-0.20220612.e87ca733f0d3 with build-id 2fcb16ce2dcf313a6d86fce8631e18e3055ab359 starting ...
Instance: i3.2xlarge
Db nodes: 3
Job: https://jenkins.scylladb.com/view/Performance/job/scylla-master/job/scylla-master-perf-regression-latency-250gb-with-nemesis/208/execution/node/112/
job performance-latency with nemesis run sequence of nemesis. One of nemesis is Terminate and replace.
The nemsis terminate the random node in cluster and add new one with replace address.
During the test node logs are have a lot of warning messages:
known issue: #10159
2 tests: test_read and test_mixed use next c-s commands running from 4 loaders:
stress_cmd_r: "cassandra-stress read no-warmup cl=QUORUM duration=600m -schema 'replication(factor=3)' -port jmx=6868 -mode cql3 native -rate 'threads=50 throttle=4000/s' -col 'size=FIXED(128) n=FIXED(8)' -pop 'dist=gauss(1..250000000,125000000,12500000)' "stress_cmd_m: "cassandra-stress mixed no-warmup cl=QUORUM duration=600m -schema 'replication(factor=3)' -port jmx=6868 -mode cql3 native -rate 'threads=50 throttle=3500/s' -col 'size=FIXED(128) n=FIXED(8)' -pop 'dist=gauss(1..250000000,125000000,12500000)' "Both tests: test_read and test mixed are failed by same reasons. During nemesis
Terminate and replaceafter node 3 was terminated node1 and node2 reported a lot of next warnings:But after new node4 was added and bootstrap process was started on it:
But node1 and node2 are stucked to stream data. Latest messages:
According to monitor, at that moment node 2 use 100% of cpu
These cause c-s command report next critical errors and failed:
Logs:
db-cluster | https://cloudius-jenkins-test.s3.amazonaws.com/674f5418-6d07-4c51-833d-ff90a711ef9a/20220615_083047/db-cluster-674f5418.tar.gz |
monitor-set | https://cloudius-jenkins-test.s3.amazonaws.com/674f5418-6d07-4c51-833d-ff90a711ef9a/20220615_083047/monitor-set-674f5418.tar.gz |
loader-set | https://cloudius-jenkins-test.s3.amazonaws.com/674f5418-6d07-4c51-833d-ff90a711ef9a/20220615_083047/loader-set-674f5418.tar.gz |
sct-runner | https://cloudius-jenkins-test.s3.amazonaws.com/674f5418-6d07-4c51-833d-ff90a711ef9a/20220615_083047/sct-runner-674f5418.tar.gz |
Monitoring:
http://3.216.80.233:3000/d/alternator-master/scylla-master-perf-regression-latency-250gb-with-nemesis-scylla-per-server-metrics-nemesis-master?orgId=1&from=1655279177170&to=1655281199331&var-by=instance&var-cluster=&var-dc=All&var-node=All&var-shard=All&var-sct_tags=InfoEvent&var-sct_tags=DisruptionEvent
The text was updated successfully, but these errors were encountered: