A Salesforce Commerce Cloud (Demandware) Cartridge for Developers.
- Server Side Debugging in ISML, JS & DS Files
- Client Side Rendering of Debug Output in Dev Tools Console
- Interactive Drawer with Console for Debugging and Testing Live Code
- Safety Measures to prevent running in Production Environments
- No Site Preferences or Misc Imports Required
NOTE: The Debugging Console is not built for Native SFCC Messages, but specific to custom debuggers you add in your own code as outlined below.
- Install Cartridge
- Add
sfcc_dev_toolsto StorefrontCartridgesPath - Add the Dev Tools to your Storefront using either SFRA or Site Genesis instructions below
You do not need to do any extra setup for SFRA. Our cartridge takes advantage of the
app.template.afterFootertemplate hook baked into SFRA.
To render the Dev Tools on Site Genesis, stick this code snippet in an ISML template near the footer of your website as close to the closing
</body>tag as possible.
<isif condition="${dw.system.HookMgr.hasHook('sfcc.util.devtools')}">
    <isscript>
        dw.system.HookMgr.callHook('sfcc.util.devtools', 'render');
    </isscript>
</isif>PRO TIP: Make sure to use the
hasHookconditional logic shown in the examples if there is a chance your debug code could end up on another instance that might not have thesfcc_dev_toolscartridge installed.
If you are in an ISML file, you can use something like this.
<isif condition="${dw.system.HookMgr.hasHook('sfcc.util.devtools')}">
    <isscript>
    dw.system.HookMgr.callHook('sfcc.util.devtools', 'log', {
        someObject: someValue,
        anotherObject: anotherValue
    });
    </isscript>
</isif>if (dw.system.HookMgr.hasHook('sfcc.util.devtools')) {
dw.system.HookMgr.callHook('sfcc.util.devtools', 'log', {
someObject: someValue,
anotherObject: anotherValue
});
}We support the following Log Types:
debug,error,info,log&warn
dw.system.HookMgr.callHook('sfcc.util.devtools', 'debug', someObject);
dw.system.HookMgr.callHook('sfcc.util.devtools', 'error', someObject);
dw.system.HookMgr.callHook('sfcc.util.devtools', 'info', someObject);
dw.system.HookMgr.callHook('sfcc.util.devtools', 'log', someObject);
dw.system.HookMgr.callHook('sfcc.util.devtools', 'warn', someObject);
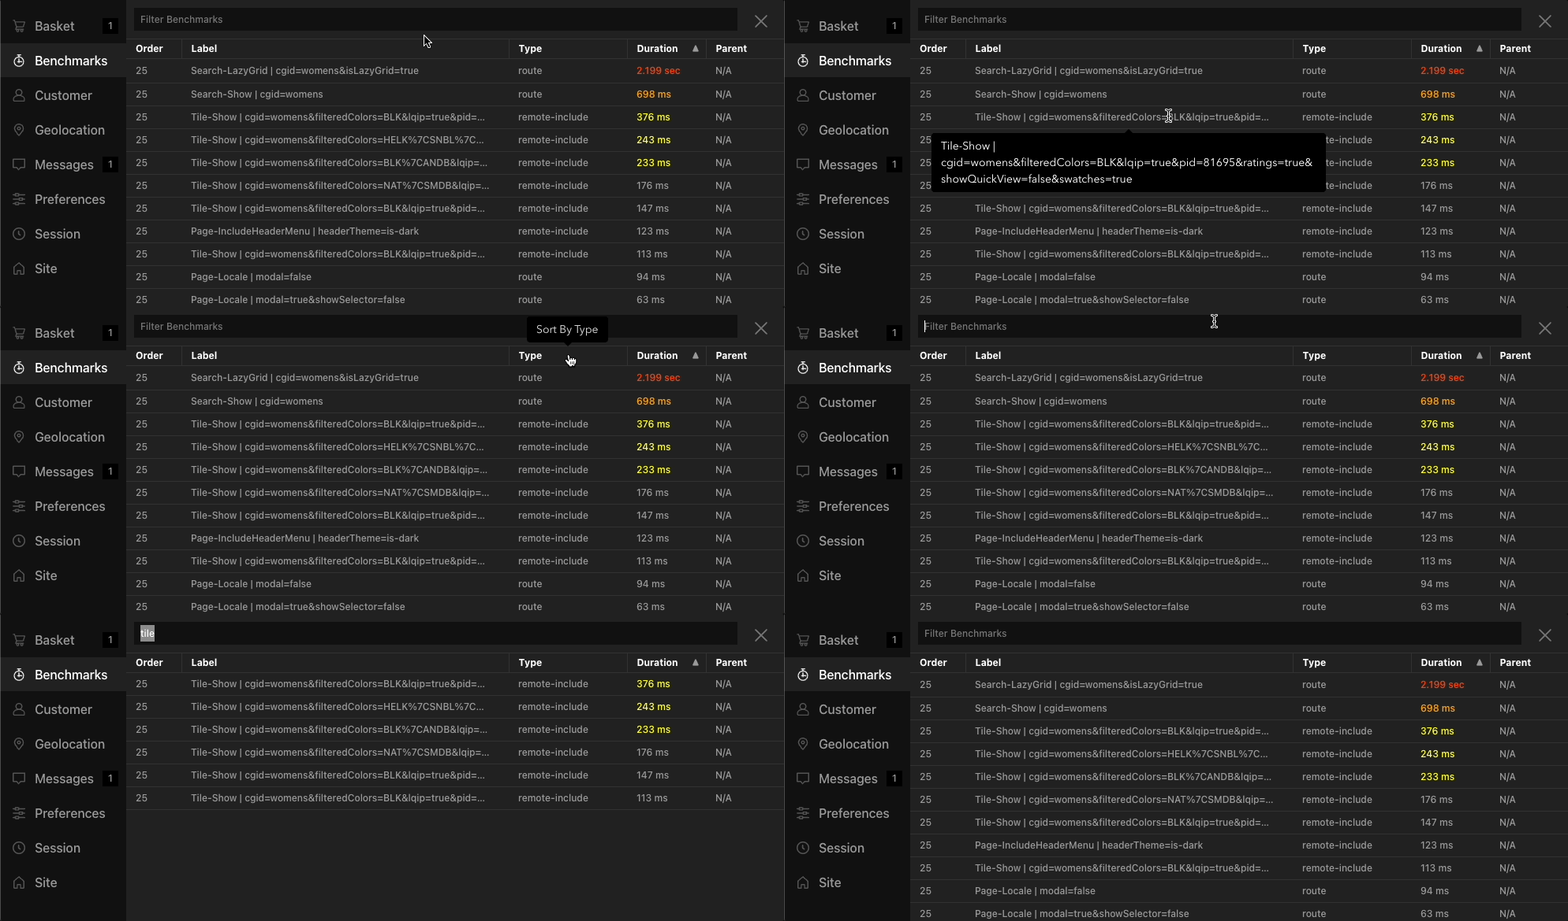
Benchmarks help calculate the Server-Side timing of custom events. By default, this cartridge adds timing for route and remote includes. You can easily add your own custom benchmarks using the following hooks:
To start timing a benchmark, place the following code at the very beginning of your custom server-side script ( change My Benchmark to whatever you want to call the benchmark ).
dw.system.HookMgr.callHook('sfcc.util.devtools', 'benchmark', 'start', 'My Benchmark');The stop timing a benchmark, just use the stop parameter and the same benchmark name.
dw.system.HookMgr.callHook('sfcc.util.devtools', 'benchmark', 'stop', 'My Benchmark');Alternatively, you can pass over an object instead of a String that contains the following properties:
-
name: Name used to Start & Stop Benchmark ( required ) -
parent: If you are nesting benchmarks, provide the Parent Benchmark name [ default:null] -
type: Optional property to define the type of benchmark, which can be any value [ default:'custom']
dw.system.HookMgr.callHook('sfcc.util.devtools', 'benchmark', 'start', {
    name: 'Nested Benchmark',
    parent: 'My Benchmark',
    type: 'custom-type'
});
Then you can stop the benchmark by referencing its name:
dw.system.HookMgr.callHook('sfcc.util.devtools', 'benchmark', 'stop', 'Nested Benchmark');IMPORTANT: The benchmark name should be unique in order to prevent starting & stopping existing benchmarks.
Access the Benchmark from the new Toolbar Menu Option.
Then your benchmarks will be listed in the new Benchmark Panel.


