This is an extention of the DRPPM Expression Analysis ShinY (EASY) Integration App which allows the user to integrate their data with the data of a large project database, for example we use the Cancer Cell Line Encyclopedia (CCLE) and a Lung Squamous Cell Carcinoma study from Clinical Proteomic Tumor Analysis Consortium (CPTAC). Through the integration of data sets, users may perform expression level differences and in-depth reciprocal Gene Set Enrichment Analysis (GSEA). This R Shiny app is very similar in features to the original Integration app, with the addition of a sample selection tab which allows the user to subset samples or a study of their choice. Based on this selection, the expression and meta data will be subset and imported in the back end to the app for further analysis and visualization. While this GitHub page can be cloned and ran locally there are current versions of the CCLE app and CPTAC app found at the links below.
CCLE: http://networkbiology.science/shiny/DRPPM_EASY_LargeProject_Integration_CCLE/
CPTAC_LSCC: http://networkbiology.science/shiny/DRPPM_EASY_LargeProject_Integration_LSCC_CPTAC/
- Download ZIP file from https://github.com/shawlab-moffitt/DRPPM-EASY-Database-Integration
- Unzip and load into directory as a project in R Studio
- Open the ‘App.R’ script and write in user input files and options as directed at the top of the script
- ‘App.R’ script begins with example files loaded in from the ExampleData folder
- Press ‘Run App’ button in R Studio to run in application or browser window and enjoy!
- The app script will install any missing packages that the user may not have locally
R- https://cran.r-project.org/src/base/R-4/R Studio- https://www.rstudio.com/products/rstudio/download/
| shiny_1.6.0 | shinythemes_1.2.0 | shinyjqui_0.4.0 | shinycssloaders_1.0.0 | tools_4.1.0 |
| dplyr_1.0.7 | tidyr_1.1.3 | readr_2.0.1 | tibble_3.1.3 | DT_0.18 |
| ggplot2_3.3.5 | plotly_4.9.4.1 | enrichplot_1.12.2 | pheatmap_1.0.12 | ggrepel_0.9.1 |
| enrichR_3.0 | limma_3.48.3 | clusterProfiler_4.0.5 | limma_3.48.3 | GSVA_1.40.1 |
| BiocManager_1.30.16 | reshape2_1.4.4 | ggpubr_0.4.0 |
- User In-App Data Input Files:
- Expression Matrix:
- Must be tab delimited with gene names as symbols located in the first column with subsequent columns consiting of the sample name as the header and expression data down the column
- The current App expects lowly expressed genes filtered out and normalized data either to FPKM or TMM
- Larger files might inflict memory issues for you local computer
- Meta File:
- Must be tab delimited with two columns. First column of sasmple names and second column as phenotype grouping of the samples
- Expression Matrix:
- Large Project Expression Matrix (.tsv/.txt):
- Must be tab delimited with gene names as symbols located in the first column with subsequent columns consiting of the sample name as the header and expression data down the column.
- Large Project Meta Data (.tsv/.txt):
- Three column, tab-delimited, format with columns in the order of Sample Name, Meta Group, Sample Type
- This is used to group the expression data into comparison groups for differential expression analysis
- Large Project Meta Selector Data (.tsv/.txt)(Optional):
- This is used when the expression data is able to be subset for analysis
- In the case of the CCLE example we can subset the expression data based on disease or lineage before grouping with the meta file
- This is a two column, tab-delimited, file with the first column being the meta groups (as seen in the second column of the main meta data) and the second column is either "Phenotype" or "Selector"
- "Selector" designates if the meta group is used to subset the expression data
- "Phenotype" designates if the meta group is used to group the expression data
- This is used when the expression data is able to be subset for analysis
- Large Project Name Map File (.tsv/.txt)(Optional):
- This is a two-column, tab delimited file with the first column consisting of the sample names used in the expression and meta data and a second column consisting of a possible alternative/extended name or more information on that sample.
- This can be usefull when sample names might be acronyms of a longer name or there is more information the user may want to allocate to that sample.
- MSigDB Gene Set Names:
- These gene set files were gathered from the Molecular Signatures Database (MSigDB) as separate collections and processed through R to generate a master gene set file with catagorical labels to use for GSEA and ssGSEA analysis.
- This is used mainly for the UI for gmt category selection.
- MSigDB Gene Set RData List:
- The RData gene set list is a more refined format of the gene set table.
- This is a named list with over 32,000 gene sets from MSigDB paired with the genes they consist of.
- This list is used for the back end analysis.
Below shows the only section of the script that needs to be updated, currently written for setting up the CCLE Analysis App. The user may enter the project name, the meta file, the meta selector file, the expression matrix file, and a name map file. For the optional files (meta selector and name map) you may leave the contents empty and it will run without them. Once these files are added the app may be run as is.
####----Project Name----####
ProjName <- 'CCLE'
####----File Names----####
##--Database Files--##
#Meta
db_meta_file <- '~/R/DRPPM-EASY-Database-Integration-main/CCLE_data/CCLE_meta_melt_nosub.zip'
#Meta Selector File
db_meta_selec_file <- '~/R/DRPPM-EASY-Database-Integration-main/CCLE_data/CCLE_meta_selector_nosub.tsv'
#Expression Data
db_expr_file <- '~/R/DRPPM-EASY-Database-Integration-main/CCLE_data/CCLE_expr_trim_NewName.zip'
#Name Map File
db_namemap_file <- '~/R/DRPPM-EASY-Database-Integration-main/CCLE_data/CCLE_NameMap.tsv'
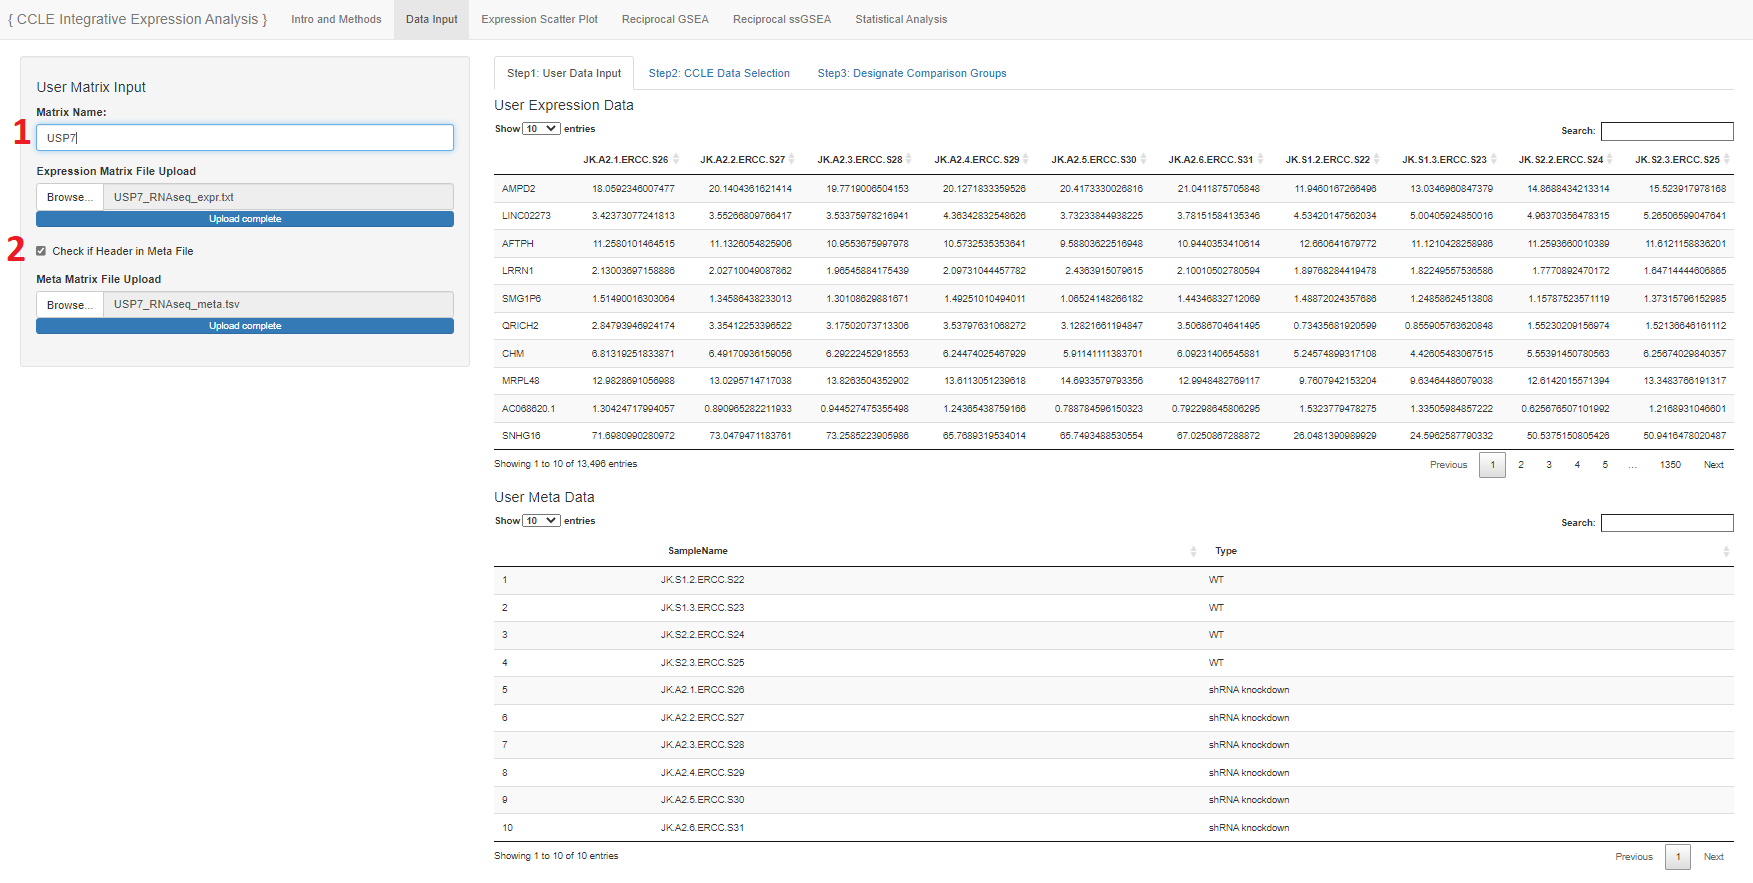
- Write in a name to identify your data
- User upload of expression matrix and meta file
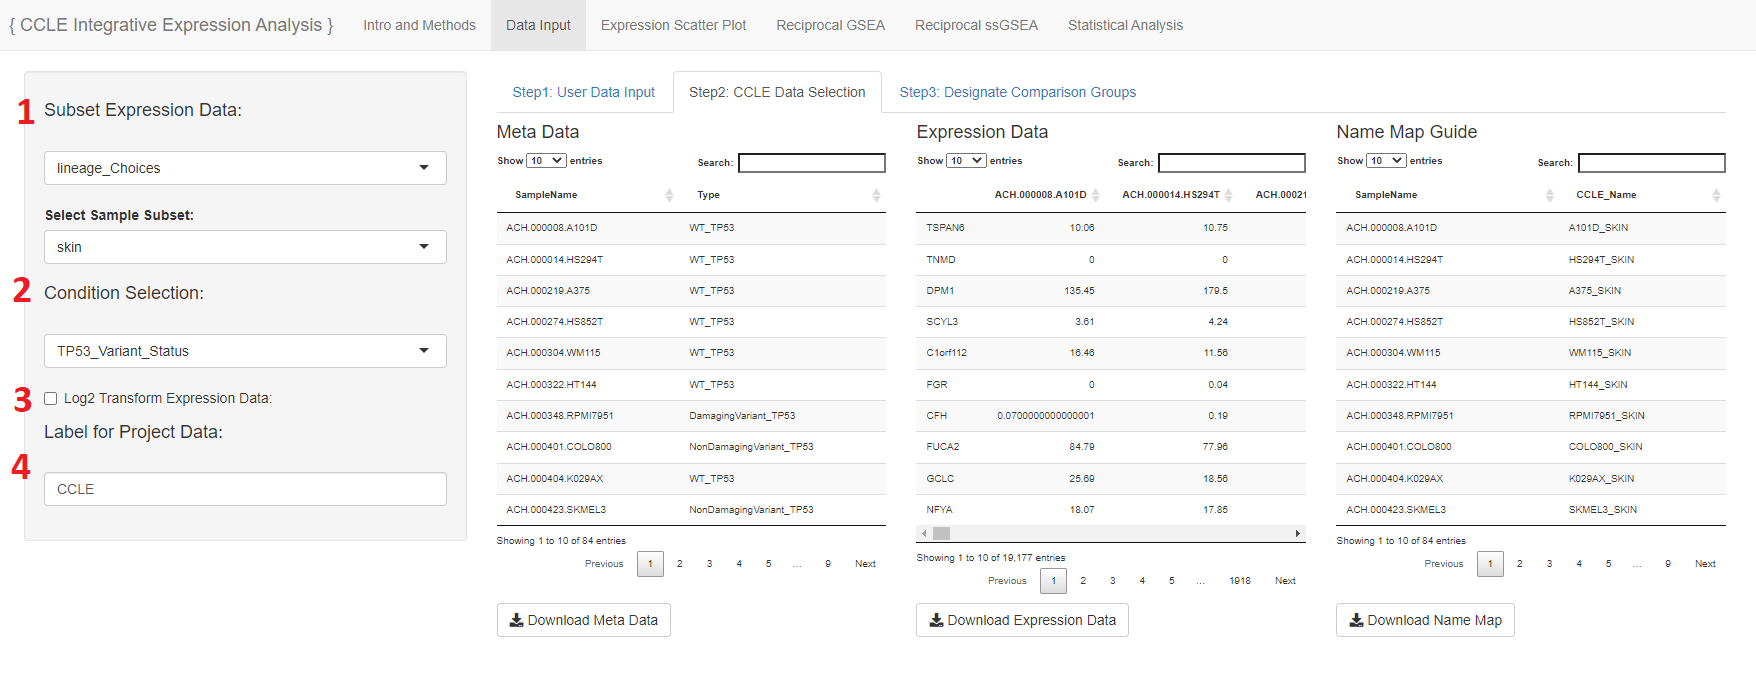
- This section to subset expression data will only show if the user includes a meta selector file that is able to subset the expression data based on a variable
- In the case of the CCLE example the user may select to subset the expression data based on lineage or disease type
- The condition selection designated which meta group to group the expression data with
- The user may choose to log2 transform the expression data
- The label is automatically filled with the Project Name given in the script but is able to be adjusted here
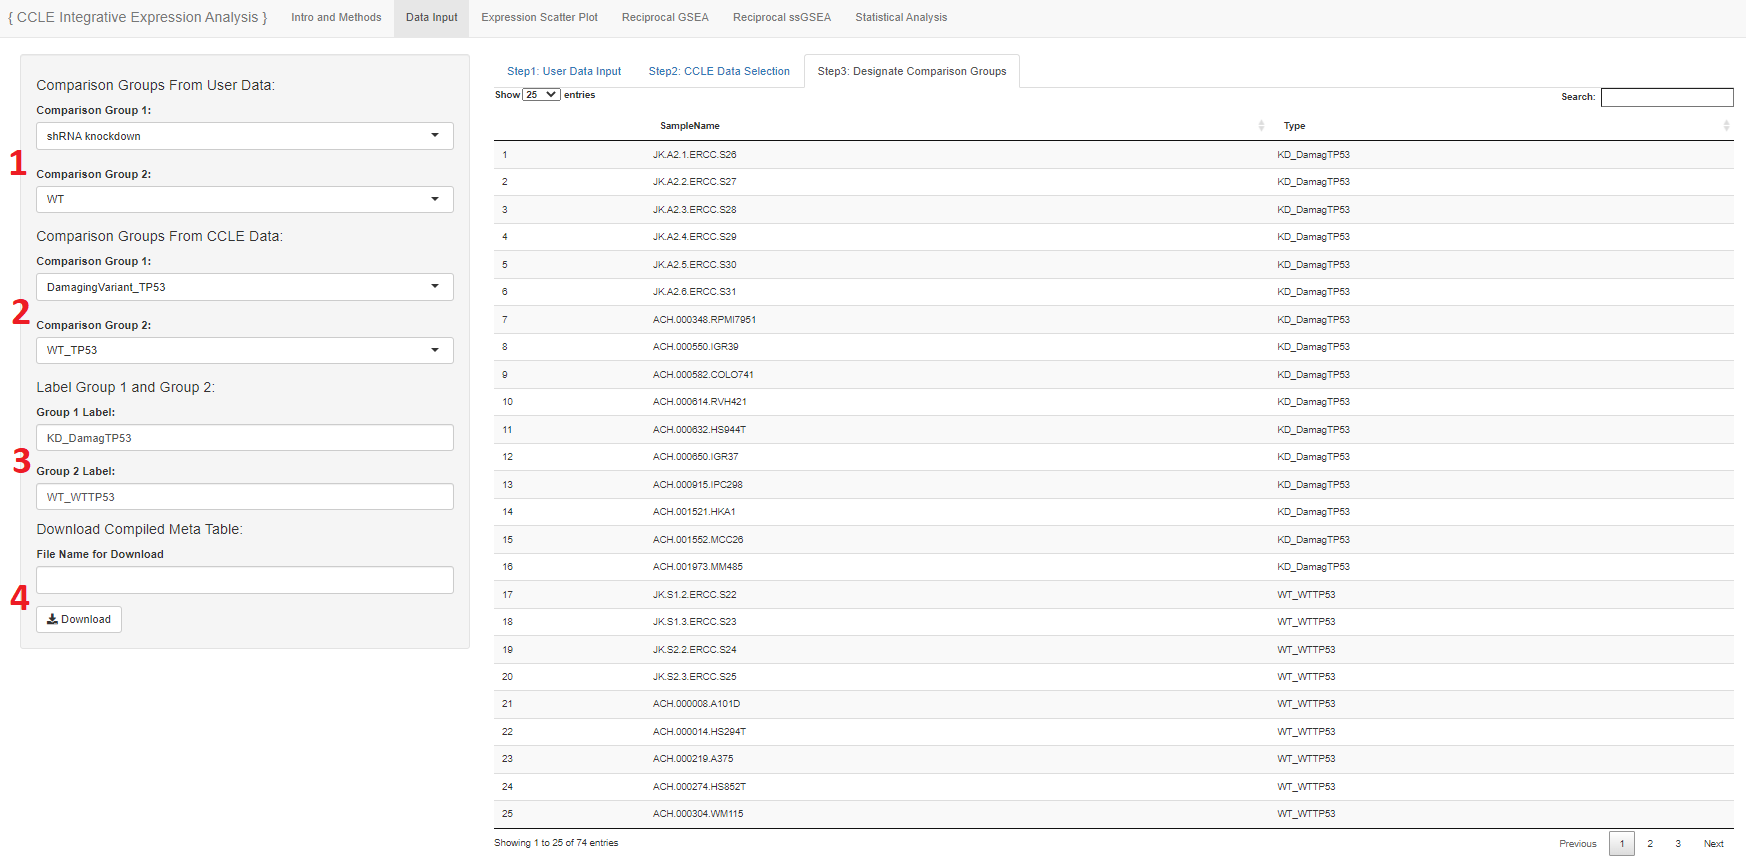
- Meta group 1 and 2 of the user data may be designated here
- Meta group 1 and 2 of the project data may be designated here
- The samples of group 1 from the user and project data will be grouped together and the samples of group 2 from the user and project data will be grouped together
- These new groups 1 and 2 will be used for the downstream analysis
- The new groups can be labeled here
- The new meta table that is generated and shown may be names and downloaded for further use
The corresponding tabs are idenctical to the tabs in the original DRPPM EASY Integration app where more information on those features can be found here.