Sumukh Kumble
The objective of this project was to develop a web dashboard that provides the users with information pertaining to the overall health and welfare of the population in all the regions of the United States. Various parameters were assessed and compiled into a dataset which reveals the average income, access to healthcare, smoking and obesity rates. Furthermore, information on the median age of each state as well as poverty rates were also provided. In addition to the dataset that was provided for the project, various other data sets relating to all US states were retrieved from Kaggle, cleaned and incorporated. These sets provided information on pollution rankings, gross domestic product, population and prison population, which are available for viewing on the web dashboard.
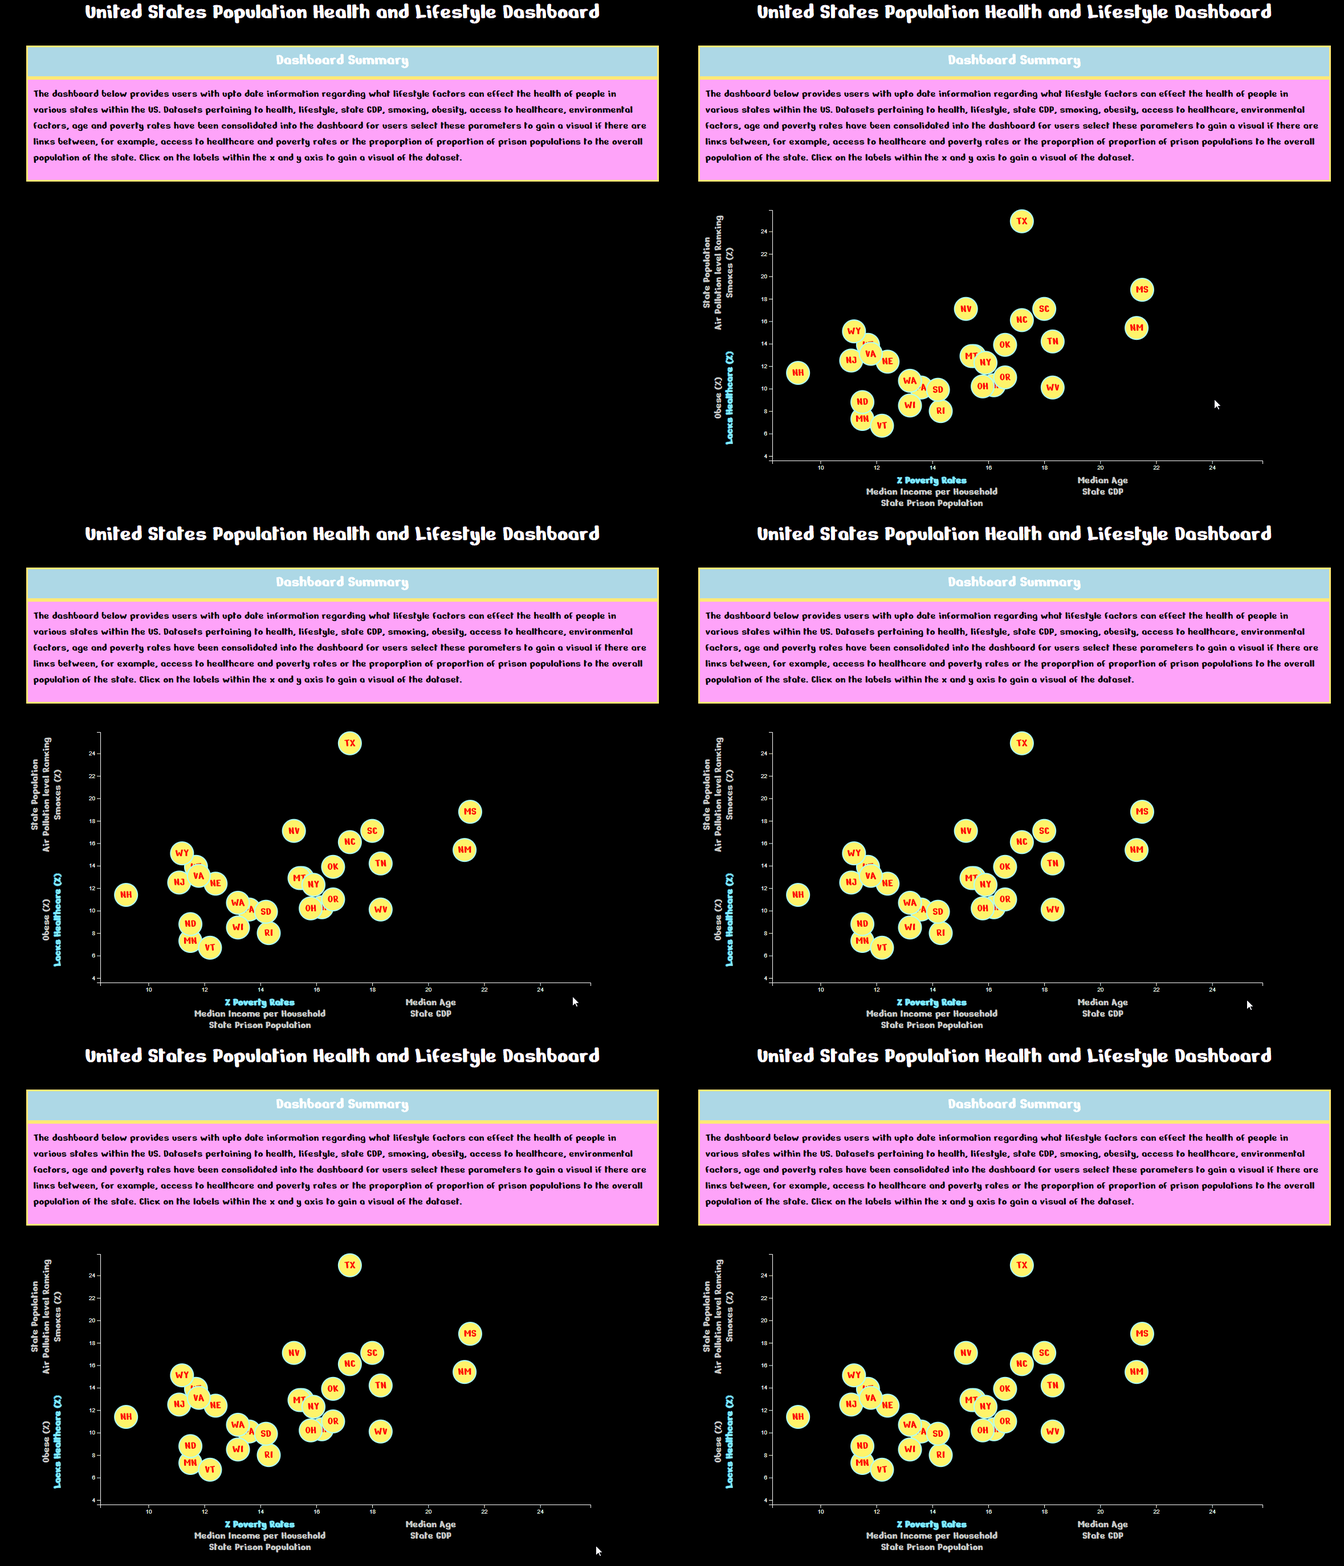
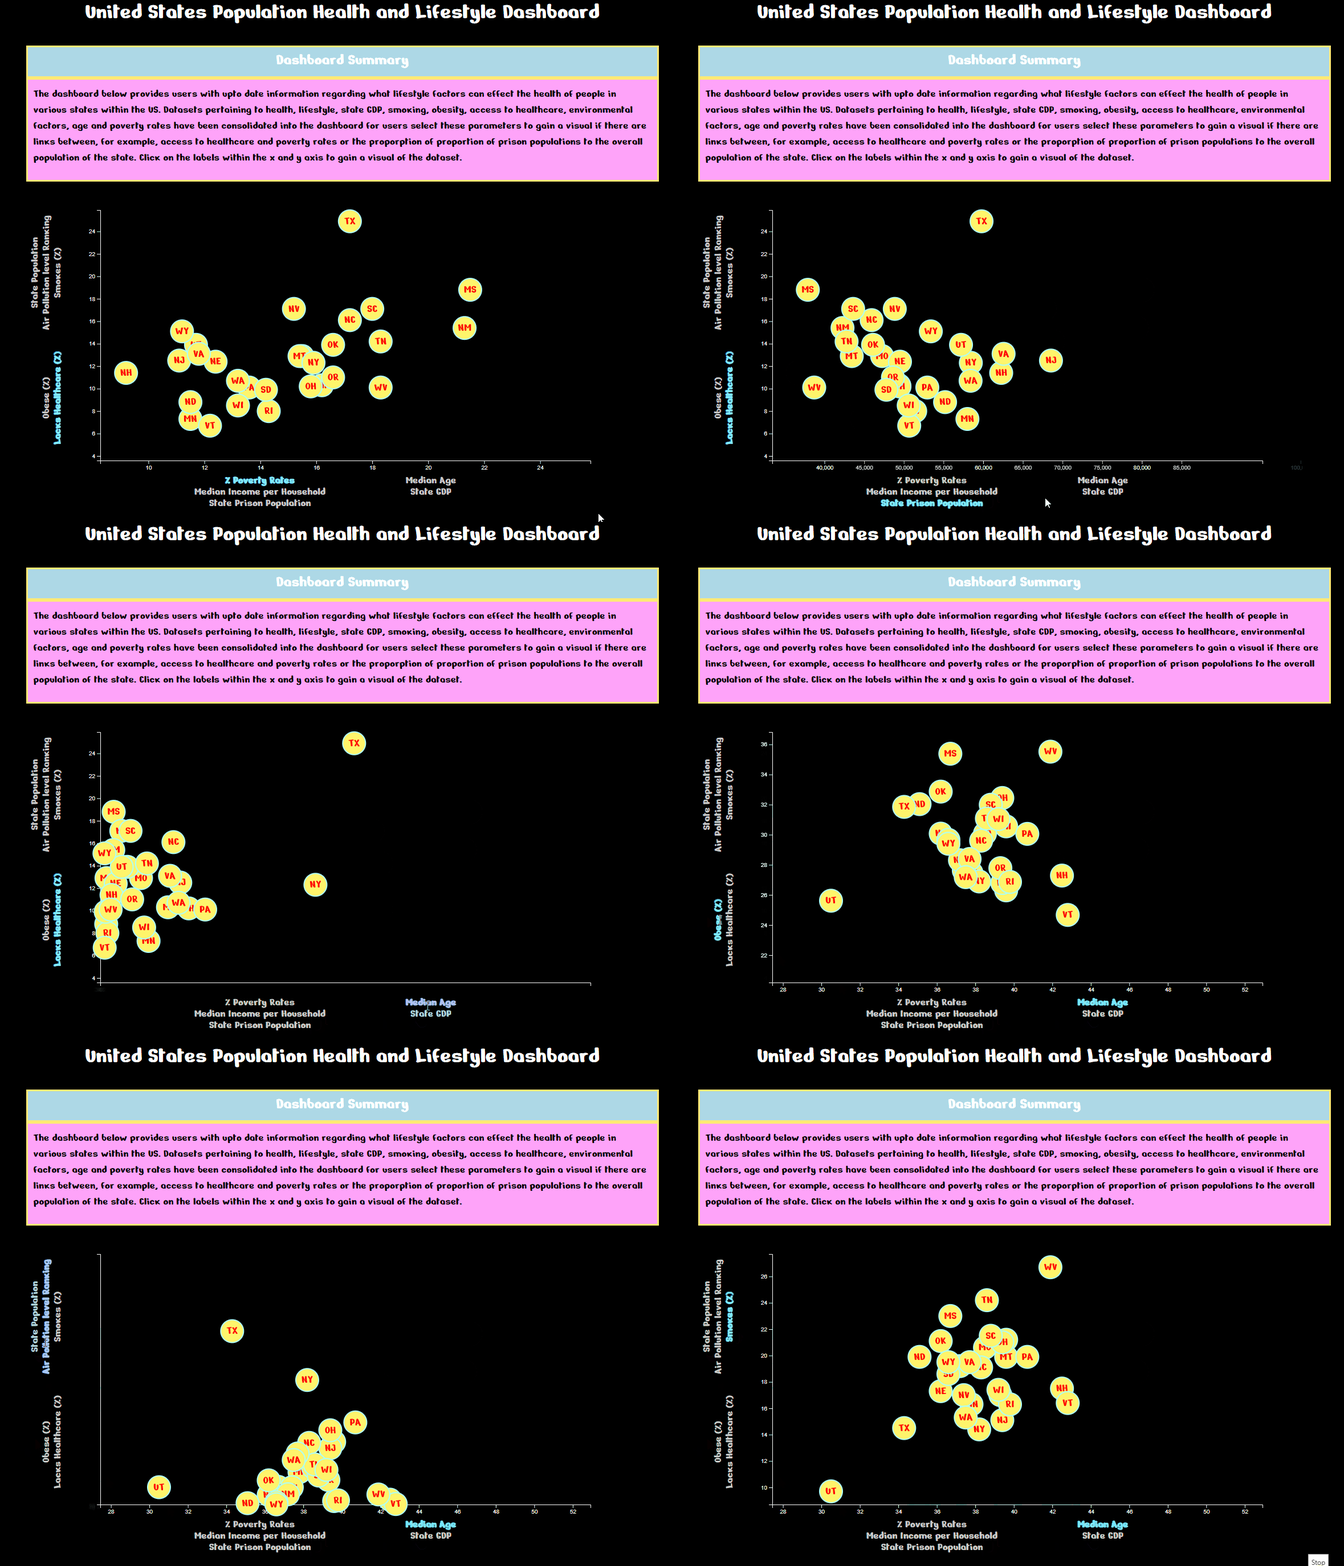
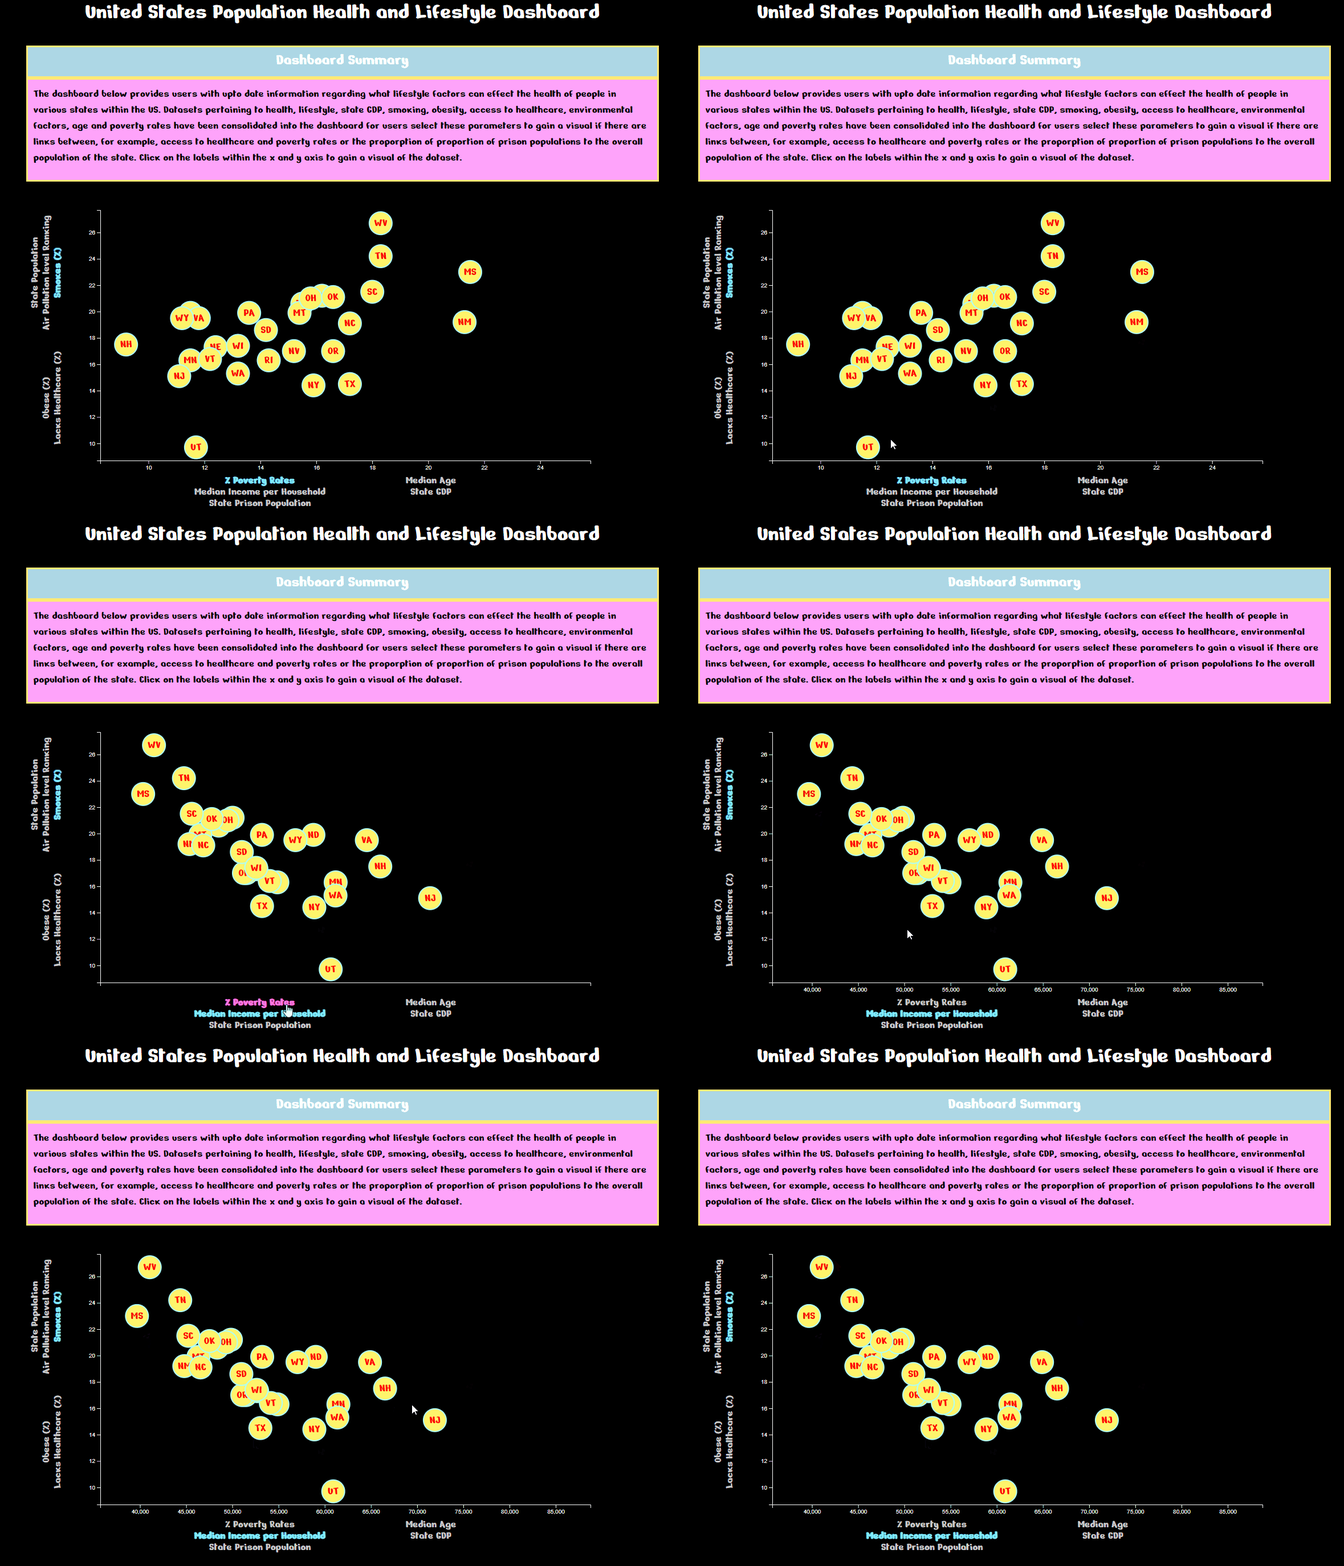
Utilising html, JavaScript (D3 dependencies) as well as CSS, an interactive web dashboard was created where users can visualise the relationship between the aforementioned parameters pertaining to each region of the United States. A snapshot of what is available and the interface has been provided below:
Interactive Graph
Figure 1: Users have the option of viewing the relationship between different parameters by clicking on the label on the x and y axis.
Figure 2: Users can also view additional data by hovering the mouse over the specific data points within the graph.


