how to extract the most important feature names ? #632
Comments
|
The array returned by |
|
I understand that clarifyingMy issue, is about getting the names and their shap values of features, instead of visualizing them. exampleTake the demo in shap.summary_plot(shap_values, X, plot_type="bar")
However, I am wondering, is there any way to get the name of features ordered by importance: # is there any function working like get_feature_importance? Or how to implement it?
shap.get_feature_importance(shap_values, X) == np.array(['LSTAT', 'RM', 'CRIM', ... 'CHAS']) Or even better, output the numeric values of each feature: # is there any function working like get_feature_importance_2? Or how to implement it?
shap.get_feature_importance_2(shap_values, X) == {
'LSTAT': 2.6,
'RM': 1.7,
...,
'CHAS': 0.0
}Thank you so much. |

|
Ah. Well the numbers for the bar chart are just |
|
I usually do this to get feature importance. vals= np.abs(shap_values).mean(0)
feature_importance = pd.DataFrame(list(zip(X_train.columns,vals)),columns=['col_name','feature_importance_vals'])
feature_importance.sort_values(by=['feature_importance_vals'],ascending=False,inplace=True)
feature_importance.head() |
I think the shap_values format has changed. import numpy as np
vals= np.abs(shap_values).mean(0)
feature_importance = pd.DataFrame(list(zip(features.columns, sum(vals))), columns=['col_name','feature_importance_vals'])
feature_importance.sort_values(by=['feature_importance_vals'], ascending=False,inplace=True)
feature_importance.head() |
|
I think it would be useful to have this as a "feature_importance()" method, which I will look at adding as a pull request if anyone agrees? On a different note, but related to this topic... I have only read summary information on "shap" and from my understanding, the shap_values are related to the individual observations (not at the global level) as such, I wondered how to use for an obscure cross validation situation I have... I would like to find feature importances based on the training data of all the folds during CV (fully stratified folds, so no danger of missing variables/values in a particular fold etc). I wondered if I should:
|
|
if the feature importance does not adds upto one ? is it incorrect? |
For anyone seeing this more recently, even if you are doing a binary classification problem, the returned To reflect that in the code snippet above, I had to specifically select the positive class in my case in order to land on correct shap values: import numpy as np
vals= np.abs(shap_values[1]).mean(0) |
|
For anyone who are looking for a solution in Shap version 0.38.1, I can reproduce the shap importance plot order by taking the absolute value of the proposed solution of @clappis. "features" is the list of features, you can use validation.columns instead.
|
|
For Shap version 0.39 : def global_shap_importance(model, X):
""" Return a dataframe containing the features sorted by Shap importance
Parameters
----------
model : The tree-based model
X : pd.Dataframe
training set/test set/the whole dataset ... (without the label)
Returns
-------
pd.Dataframe
A dataframe containing the features sorted by Shap importance
"""
explainer = shap.Explainer(model)
shap_values = explainer(X)
cohorts = {"": shap_values}
cohort_labels = list(cohorts.keys())
cohort_exps = list(cohorts.values())
for i in range(len(cohort_exps)):
if len(cohort_exps[i].shape) == 2:
cohort_exps[i] = cohort_exps[i].abs.mean(0)
features = cohort_exps[0].data
feature_names = cohort_exps[0].feature_names
values = np.array([cohort_exps[i].values for i in range(len(cohort_exps))])
feature_importance = pd.DataFrame(
list(zip(feature_names, sum(values))), columns=['features', 'importance'])
feature_importance.sort_values(
by=['importance'], ascending=False, inplace=True)
return feature_importance |
|
shap==0.39.0 In my case the above code didn't work, but gave and idea what to do. I had an xgboost model and did: explainer = shap.Explainer(model) shap_values.shape => (5, 4000, 30) (5 instances, 4000 features, 30 classes) vals = shap_values.values And finally some numbers looking like feature importances popped out. |
|
Hey, I have a very similar question. I am interested in exporting the data used to create the shap.dependence_plot("rank(0)", shap_values, X_train) diagrams. Anyone could help me with that? I basically wanne save them in an excel sheet, to plot them bymyself. thx |
|
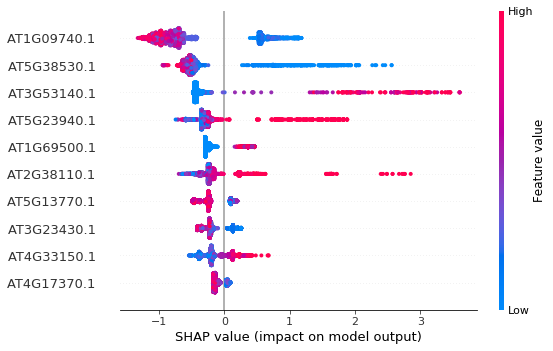
How do we get a list of the most important features for a particular class in a multiclassification problem? My question is: Using the array corresponding to each class (eg: For class 0, using array shap_values[0] ), how can I get a list of most important features for that particular class? TLDR: Basically, I want to save the features shown on the y-axis (AT1G09740.1, etc) from the summary plot in a txt file. How do I do that?
|
I think I figured out the answer. This is what I did for Class 0: |
Now it wants vals = np.abs(shap_values.values).mean(0)
feature_importance = pd.DataFrame(list(zip(feature_names, vals)), columns=['col_name','feature_importance_vals'])
feature_importance.sort_values(by=['feature_importance_vals'], ascending=False, inplace=True)
feature_importance.head() |
|
` X, y = shap.datasets.boston() explainer = shap.Explainer(model) feature_names = list(X.columns.values) ` |
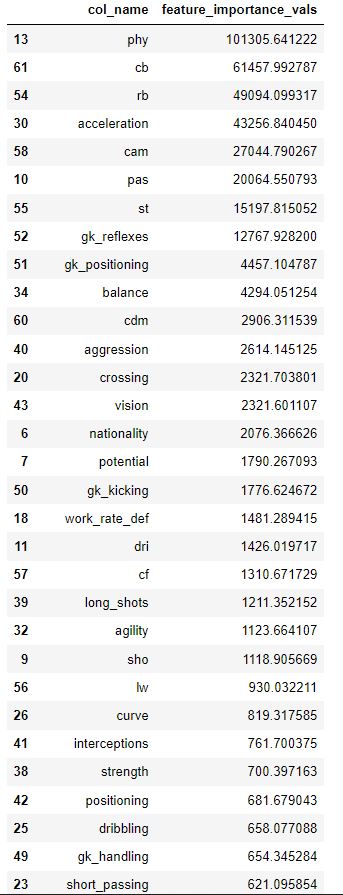
However the order of "feature_importance" data frame is different from the order of feature in corresponding summary plot right? For example here's the summary_plot of FIFA data: However after I leveraged the code above to calculate feature importance in the FIFA data, I got a feature importance data frame like: The order of each feature is quite different. So Could you please tell me which one is correct order to show the feature importance? |

This function works like a charm! Thanks! |
|
feature_importance = pd.DataFrame(list(zip(feature_names, np.abs(shap_values)[0].mean(0))), columns=['feature_name', 'feature_importance_vals']) Before, you are putting np.abs(shap_values[0]).mean(0)), and this is no correct because you would be selecting the first row and doing the mean. The correct way is: np.abs(shap_values)[0]. |
|
Version 0.40.0: Verified the same as summary bar plot |
|
If anyone is still wondering, after sorting through the code for a bit, I realized the solution is incredibly simple (This is with XGBoost. For LightGBM, Confirmed the order is the same as the summary_plot. |
|
I am very curious why there is no example as to how to extract the feature importance of lagged shap values (shape (22, 2, 9)) returned by a DeepExplainer. Any method i tried did not return the same order and impact as for example summary plot did. I would appreciate a solution for my issue as i am stuck to summarize feature importance for my thesis |
|
I had to use |
|
How can i see the detailed description of features? Which function to use? school object |
|
@slundberg I'm curious as to why this is not already implemented as a feature. Any particular reason, or difficulty you foresee? Or there just hasn't been anyone who creates the PR? Thank you |
|
I had exactly the same issue today and found a fairly easy way to get the top n features by shap value: then just pick off your top n features from the head of the df_feature_importance dataframe. I'm not a python expert, so I have no doubt there's a more elegant way of doing this, but it solves the issue. |
With this code we have importance in Series |
Did you find any solution? Please tell me |
|
@slundberg, have something like UPD: |
We can visualize the feature importance by calling
summary_plot, however it only outputs the plot, not any text.Is there any way to output the feature names sorted by their importance defined by
shape_values?Something like:
Thanks.
The text was updated successfully, but these errors were encountered: