Falcon for large edge includes (developing/applying IO strategy) #40
Comments
|
I think you should try it first and then see if memory usage/strings allocation is an issue. We've already done some optimisation in this area (minimising string allocations). Once you've figured out specific code paths that are causing junk to be allocated, it could be raised as an issue. Regarding splicing from input to output, it's not protocol agnostic especially w.r.t. HTTP/2. That being said, maybe there is room for a HTTP/1 specific code path which suits your requirements. NIO4R byte buffer hasn't been too useful in practice, but maybe we could make that work better if we know specifically what parts aren't up to scratch. |
|
👍 Thanks, we will do some stress testing. |
|
Did you make any progress on this? |
|
We did. We ran falcon with 6 worker processes, putting it behind nginx on one of our production instances (where puma used to run instead). We had to switch to a TCP socket from a unix socket that Puma uses for that. I also had to implement a backstop for the async backpressure issue which would otherwise destroy us, something like this def wait_for_queue_throughput(output_body, max_queue_items_pending, task)
# Ok, this is a Volkswagen, but bear with me. When we are running
# inside the test suite, our reactor will finish _first_, and _then_ will our
# Writable body be read in full. This means that we are going to be
# throttling the writes but on the other end nobody is really reading much.
# That, in turn, means that the test will fail as the response will not
# going to be written in full. There, I said it. This is volkswagen.
return if 'test' == ENV['RACK_ENV']
# and then see whether we can do anything
max_waited_s = 15
backpressure_sleep_s = 0.1
waited_for_s = 0.0
while output_body.pending_count > max_queue_items_pending
LOGGER.debug { "Slow client - putting task to sleep" }
waited_for_s += backpressure_sleep_s
if waited_for_s > max_waited_s
LOGGER.info { "Slow client, closing" }
raise "Slow client, disconnecting them"
end
# There should be a way to awake this task when this WritableBody has been read from on the other end
task.sleep(backpressure_sleep_s)
end
# Let other tasks take things off the queue inside the Body::Writable
task.yield
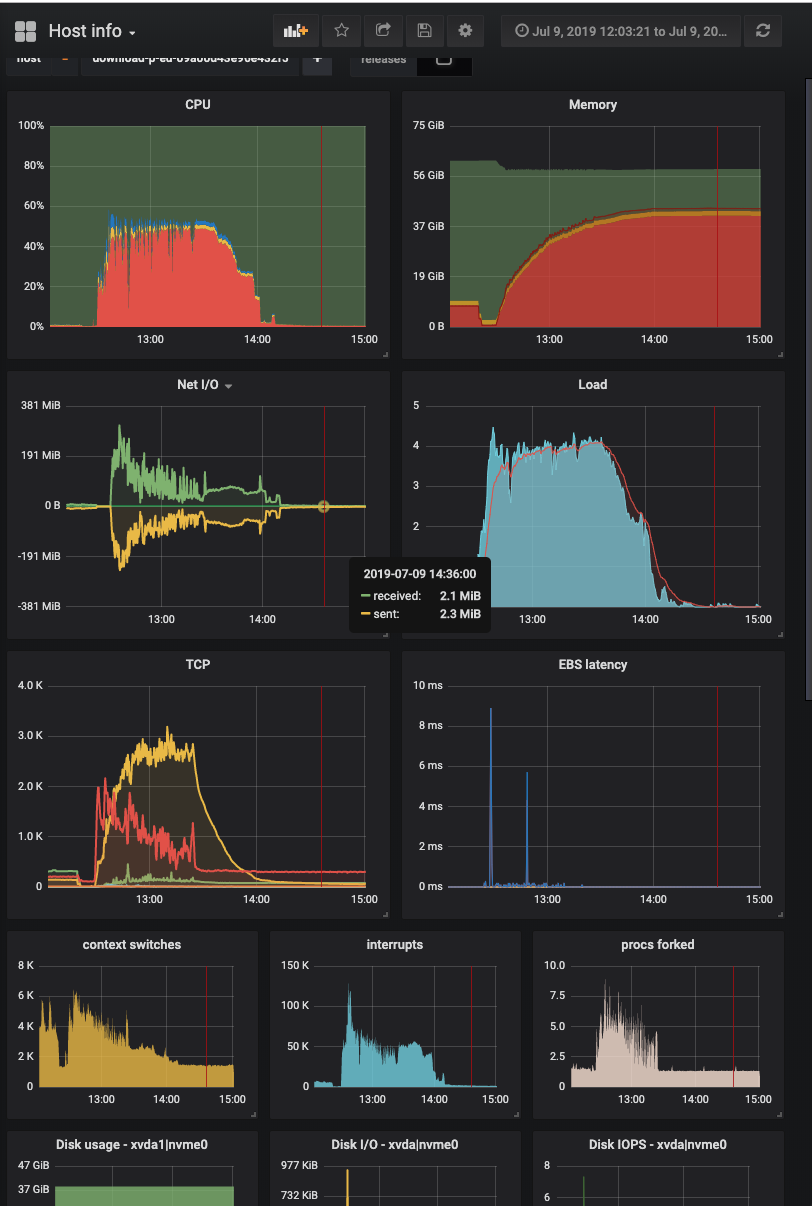
endTo do this I had to expose the queue item count on the We limited the server to the same number of clients allowed to connect as our current implementation (600) and here is what happened:
I think you were right that we needed to test this first, as the mem situation seems to be fine, we are not leaking much - at least not in a few hours we ran the test, so hats off to your buffer size choices and how you managed to reuse a string there ❤️ What we did observe:
I am intending to force nginx to do a connection: close and the webhook dispatch has been replaced by asynchttp now, so we are going for another round of tests in January. I think we will also reduce the number of processes. But it does seem I do need a lower-level IO strategy for this. I am almost contemplating injecting an Async reactor into Puma on a separate thread so that we can "ship off" hijacked sockets to it. Would welcome any advice ;-) |

|
That is really useful feedback. We have Falcon does all parsing within Ruby land so it's going to be slower than a server which implements it in C. But for many applications, the overhead is not so big. Leaking connections seems odd. If you can make a small repro with only Falcon I'd be interested to see it because we also check for leaking sockets. The Falcon test suite is pretty small though. There are a handful of options. One thing which might benefit you, is the planned work for a C backend for falcon to optimise the request/response cycle on the server side. This will be an optional paid upgrade. Additionally, if you are interested, I have an open source library which is well proven for handling large numbers of request and large amounts of data. We can shape this into a custom web server for your exact requirements and I guarantee you will achieve within a few % of the theoretical throughput of the hardware/vm. |
|
Do you mind explaining the path you are taking through Falcon for serving content. Are you using HTTP/1.1? What are you using for the upstream request? |
|
I will implement back pressure within the queue too - I'll try to make it in the next release. Your implementation might not be optimal. |
|
We are using HTTP/1.1 from falcon to nginx, and HTTP/1.1 from nginx to CloudFront which is our fronting CDN. HTTP/2 is not in the picture for us at the moment. To clarify: nginx is "downstream" for falcon, CloudFront is "downstream" for nginx. Our "upstreams" (servers our Ruby app is making requests to) are S3 for the data we proxy through and a couple of small requests to our internal systems for metadata, also over HTTP/1.0. These do not egress our VPC and are tiny compared to the amount of data "put through" from S3 to downstream.
These are interesting propositions. I did look at the business support model for falcon but I don't think we are ready to commit to it at this stage. First we have a pretty variable workload and though we can predict how many proxy servers we are going to run by way of capacity planning, having what is effectively a support contract for that number of servers might be not very considerate at this stage. It might also happen that we are going to replan to use a different runtime and then can drastically reduce the number of servers since we are going to be able to saturate their NICs to the maximum. Second is we obviously need to see the requisite performance materialise. So at the moment I think contributing to the ecosystem with explorations, tests and eventual patches might be a better option, but I might be mistaken ofc.
I am interested. There is a bit of a concern for me that probably building an entirely custom proprietary webserver might be a bad idea from the point of view of my colleagues since they also will have to support it and debug it should things go south. Let's chat ;-)
Yes, please ❤️ The best I could find is opportunistically sleep the task for some time, I am certain it could be woken up sooner if the task is somehow coupled to the nio4r monitor. P.S. I do believe that we could achieve this throughput if it were possible to get access to the nio4r socket objects from within falcon already tho. |
|
socketry/async-http#6 is now fixed. It has documentation which might help you. |
|
Awesome! |
If you can think of a better way to do this I am open to ideas. |
Realistically, the only way to do something like this would be a partial hijack. That's not supported in Falcon at the moment. But maybe it's possible. Only full hijack is supported, and it's Rack compatible so it returns the raw underlying IO, extracted from the reactor: falcon/lib/falcon/adapters/rack.rb Lines 133 to 142 in d19f4d0 Maybe there is a better way to do this, or even just expose the IO directly in |
|
Can you explain your ideal slow client disconnecting policy? e.g. less than x bytes/s for y minutes? or something else? |
|
The ideal would be that if bytes per second for a client is below N bytes per second over N seconds I would kick the client out. However, I can in a way "abstract this up" because my chunk size ends up pretty much always being the default nonblocking read chunk size async-http provides, so I can extrapolate the from that and disconnect clients if there is no movement in the queue for that much time - which is the abstraction I found so far. I do have an object that keeps tabs on how much data got sent over the last N seconds and I can use that object as well, but let's try to contemplate the queue length indicator one for a minute. With the implementation I had there was some measurement because the task would resume in a polling fashion, after some time. With the new
I did try a simplistic experiment like this: it 'reactifies' do
reactor = Async::Reactor.new
20.times do |i|
reactor.run do |task|
set_timer = task.reactor.after(0.1) { $stderr.puts "task #{i} blows up" }
set_timer.cancel if i != 3
$stderr.puts "Hello from task #{i}"
task.yield
end
end
endThat does work, the task 3 does print data. But if I raise an exception from the Basically I need "some" way to forcibly terminate a task if there is no movement on the queue for that much time. Or some way to poll an object for a decision on whether the client should be disconnected or not - IMO if we poll for it once per second or even less often the impact on the reactor wont be immense. I might be overthinking it tho... |
|
This is something I’ve thought about for a while. If you call I think the answer is no. Especially not by default. There should be some logical timeout, or at least a way to specify it explicitly per socket per operation. Does the OS provide a timeout? If I make a read operation with no data will it still be waiting 100 years later? A minimum throughput is a similar issue. We have to be careful to design a system that is actually robust against slow clients, ideally not allocating resources in a way which makes it trivial to DoS a service/system. Mitigatins at the queue level doesn’t prevent malicious users because there are other non-queue related areas of the protocol which can cause resource exhaustion. So what I’d like to see is a wrapper around the socket or the stream buffer which handles this for the entire system. Ideally we can specify a policy eg minimum bit rates and timeouts, and have it work across the entire system. |
|
Yep, being able to set a timeout for each |
|
Having investigated a bit, would this work? Specifically, will it "override" a Condition? TimeoutOnWrite = Struct.new(:async_task, :writable, :timeout_s) do
def write(data)
async_task.timeout(timeout_s) { writable.write(data) }
end
end
body = Async::HTTP::Body::Writable.new(content_length, queue: Async::LimitedQueue.new(8))
Async::Reactor.run do |task|
body_with_timeout = TimeoutOnWrite.new(task, body, 3) # timeout on write in 3 seconds?..
# ...many times over, repeatedly etc
body_with_timeout.write(data_from_upstream) |
|
Unfortunately it's not sufficient. It needs to be in the buffering/socket layer. |
|
Yep, tried that implementation and though the timeout does fire it brings down the reactor (and the entire falcon process as well!) I will revert to my less-than-ideal polling implementation for now. |
|
You need to handle the timeout. Something like begin
task.timeout do
socket.write(...)
end
rescue
body.close
end |
|
If that's the route you want to go down, even just temporarily, you should probably make a body wrapper with this behaviour. But as I said it's not a fully general solution. |
|
Happy 2019 @ioquatix and other socketry contributors! We have deployed our falcon-based service as a canary and observing the results. Meanwhile I am trying to figure out where the limits are regarding the number of clients and how easy is it for falcon not to saturate the CPU but to "stuff the pipe". To that end I've implemented 3 simple "stuffer" webservers that generate one chunk of random data, and then repeatedly send it over the wire to achieve a given content-length. To eliminate the network issues from the equation I tested over loopback for now. The results are interesting. Go with Falcon with async-io Puma with partial hijack and blocking The code is in the repo here: https://github.com/julik/stuffer Unless I have really missed something, there is a roughly 3x overhead to these async bodies. Which sort of brings back my original question - is there a way, with the existing async-io model, for me to use the sockets directly and yield them back to the reactor if they would block? Or have a minimum size wrapper for this which would work with something like |
|
Without digging into it too much (dude I'm on holiday at the beach), I did a quick test of your code vs using then Here is your current implementation: Here is using |
Man I envy you we are freezing here in the northern hemisphere 🥶 Enjoy your holidays ;-) I will do some experiments with the limited queue just need to find a stopgap measure for it so that I wont have socket starvation on the reading end (connect to us, read 1 block, not read anything for a loooong time all the wile keeping the writing task asleep). |
|
I think a timeout at the socket level makes sense for almost all protocols. I don't even know if the timeout allows to be reset but something like this would be nice: Task.timeout(60) do |timeout|
body.each do |chunk|
@stream.write(chunk)
timeout.reset
end
endI wonder if Ultimately the implementation might be better at a lower level. I'll think about it. |
|
@julik I'm playing around with some timeout/throughput concerns.
I'm thinking that socket timeouts for async operations belong directly in the socket wrapper and apply to all operations. I also think there are higher level concerns about what constitutes a bad client... but not sure how generally these can be applied or if they should be protocol specific. I know that slow clients as part of a DoS might continue to consume 1 byte per second. But does that really matter? If you put a low-throughput logic to disconnect sockets, DoS clients can just consume above that water mark. So, can such an approach really protect against malicious clients, or are we just trying to disconnect users who have broken the request upstream somehow (i.e. stopped reading response). |
|
The other question is, should we have a timeout by default? It seems a bit silly to me that sockets can block code indefinitely. |
|
TL;DR:
Yes.
Yes, or provide a way to do so (hook into NIO)
At the minimum - two flags on the falcon executable that would set minimum throughput barriers for reading and writing. They could be default-"off" but you do need them. All good questions. It is ofc to be debated whether it is possible to protect against both slow loris and slow read attacks completely. You could say that it is impossible, just as it is very hard to protect from a high-volume attack. But just like bike locks I think making the attacks less convenient to carry out is a good step to take. Another reason why I think this is especially relevant for Falcon is that from what I understand Falcon is aiming to be the webserver, without a fronting downstream proxy like nginx - which in today's setups generally does a good job of dealing with these attack types. But falcon is also supposed to do SSL termination from what I understand (because HTTP/2 and all), and in general it seems it is aiming to become the server for a machine providing a Ruby web application. So IMO setting at least _basic_limits to protect people from slow HTTP attacks is in scope for falcon yes. How it should be configurable I don't know but I would say a certain number of bytes must flow through the pipe per second over that many seconds (window average). If this transfer rate is not maintained then the client should be forcibly disconnected. This applies to both reading the HTTP request (slow loris attack) and writing the response (slow read attack). So if you ask me IMO yes, you do need a timeout by default at least when you are not explicitly in websocket mode where a connection might be sleeping for minutes on end. I am not aware of attacks with "slow connect" but probably there are some 🤷♀️ I believe puma does not have slow loris protection but it reads the request using its own IO reactor, so it probably relies on the "we can handle many many clients" property of IO reactors for this. For writing Puma is susceptible to slow read as one response consumes a thread. It is probably less severe for falcon due to the intrinsic fact that falcon is one big IO reactor but the max fd limit on the server does become a concern. That is the "transport" end of the problem, for which there probably should be configurable timeouts on the webserver level (maybe even config options for falcon itself). In terms of IO - yes, I do believe you want to have configurable timeouts for all reads and writes simply because if you do not have them, say, in your HTTP client, it means you can only make requests to trusted HTTP servers as you need to make an assumption that the endpoint will not "hang you up" indefinitely. It is less of a problem with HTTP endpoints being "adversarial" (it can be if you do web scraping for example, it is a concern!), it can be a problem with endpoints being badly coded. For example there is an SSE endpoint in LaunchDarkly which is currently used via async-http. It is designed to send a "ping" message every now and then to keep the connection alive - and it is all good as long as this option works. but what if it just gives you an EAGAIN once and does not come up in the NIO reactor monitor list for 2 hours after? The calling code currently has to manage this and arrange reconnects if I'm not mistaken. Maybe it is even a feature that belongs in NIO. For our uses without async-io we opted for configuring libCURL with certain timeouts we know are sane for our uses, and we use both the connect timeouts and the throughput gate (the endpoint must furnish that many bytes within that much time otherwise we bail out). Regarding the service I am testing falcon on - it is more of an issue protecting from homegrown hand-rolled download managers that open a connection for a
I don't know. I do feel that if there is, intrinsically, a pair of objects servicing a particular client (task + writable) there should be a way to exercise at least "some" push control over the reading client socket - to use these objects to "kick" the client out. If these objects wait on a condition variable for the client to have done something in the first place (if it is always reactive) then this becomes pretty hard to do. With the current setup what bothers me the most is that I don't know whether falcon will time out a socket in a slow read situation, and if it will - where do I configure the timeout. Cause I sure do need that feature (or I need to investigate the bizarrio nginx documentation to figure out all the options that will, at the same time, protect me from these attacks and not buffer too much response along the way). |
|
For later - here is how many of these "enforce throughput" exceptions we have noticed since we started running the test code (last Thursday):
I am going to try to integrate this with the limit queue by putting a few around conditionals on the |

|
I've released I'm not sure where is the best place to set This should catch connections that simply stop responding. It won't catch connections that are maliciously slow though. For that, we need more advanced throughput calculations. @julik thanks so much for all your detailed feedback, it's really really awesome. |
|
Nope, what is returned from the Rack middleware - the code under test - then gets captured by If I do this the effect is then the same as just using a small LimitQueue - my tests block and hang. |
|
But I think I can live with the VW-workaround using a larger queue size for the tests for now at least. |
|
Try adding
|
|
Do you think 0x1FFFF makes sense for a default stream buffer size? I'm just trying to think of something that is going to allow the network to be saturated without using lots of MB per stream. |
|
Actually, it turns out to be the window size for the entire connection, as well as per stream, with HTTP/2. Well, I'm still not sure, but clearly setting it to 2GB was wrong :p |
|
I've released async-http v0.46.3 which includes HTTP/2 back-pressure streaming. That should fix the issues you had with S3 using SSL (HTTP/2 probably negotiated). The defaults I chose for both HTTP/2 client and server is 1MB chunk size and 16MB maximum flow control window. Provided you keep on consuming the data you should never hit this limit, but if you make a connection to S3 using HTTP/2, and don't read the response body, it won't update the flow control window now, and that will stop S3 from sending more data. Regarding everything else, for sending the data to the client, there are two options:
Using an appropriate queue size probably solves the other problems you were having. Otherwise, flow control won't help, given the HTTP/2 frame size limits, a queue of 1024 chunks could store a GB of data. |
|
There was a small bug in v0.9.0 so I've released v0.9.1 of Also, here is how you should use rack-test with asynchronous response bodies: https://github.com/socketry/async-http/blob/master/spec/rack/test_spec.rb |
|
Thanks, this looks like a useful suggestion. I do encounter issues though with this testing approach. For example, it seems that the context inclusion adds assertions that verify socket presence which the test has no business touching: as well as These are very cryptic (one array of file descriptors is compared to... another array of file descriptors? what does it mean? does the context assume only the Async-managed IOs in the system may remain opened or referenced anywhere?) Also some test fail, even though I know for a fact that they pass - so it seems the assertions fire earlier than they should (once the reactor has completed). For instance we have a test that ensures that if the upstream closes the connection before we could read the entire response, we perform a subsequent request and are then able to retrieve the remaining data in that request. That test fails if I include the context, and passes if I remove the context.
Awesome - so if I update async-http will it fix the overfetching with HTTP plain, HTTP/2 or both?
If we want to service, say, 1200 clients on one box (not unheard of when we have high load windows) this amounts to 19GB of memory per client - if every client holds a connection to S3. This is... available on the box but seems really excessive.
That is not an option since we do response splicing. The suggestion to read chunks is what we do now effectively.
What is the simplest way to size this based on a given number of clients I want to service and the amount of RAM on the box, given the fact that every client only fetches from 1 source upstream at the same time, and that most clients are likely to be slow-ish? |
|
Just on the first point, it means your tests are leaking file descriptors. |
HTTP/1 was already okay, it was HTTP/2 that had some problems. But I don't know if it was affecting you or not. I just checked, and it doesn't seem like S3 supports HTTP/2. So this might not have been an issue for you, but it was a problem and it's fixed now. Back-pressure is very important to ensure buffering works effectively.
You'll need to share some repros.
1200 clients is pretty small to be honest. You should be able to easily serve that with the defaults. If you are doing significant processing, it will depend on the total data rate. You can probably support several fast clients vs many slow clients, etc. Each CPU core should be able to serve up to ~100,000 clients, depending on the processing overhead. HTTP/1 means that each connection requires two file descriptors - i.e. the outgoing connection to S3 and the incoming connection from the client. So, just double check you have enough file descriptors per process. In my testing, async-io can accept between 1000-2000 connections per second per process as a rough guide.
We could probably implement a dynamically sized queue based on the flow. Pending that implementation, just ensure your queue is set to 2-4 chunks. Everything else will scale up relative to available CPU. Probably your biggest issue so far was using a limited queue with size 1024. |
|
The smaller the queue, the less memory used per client. It might not even be stupid to try a queue with size = 1. |
|
Okay, I'm going to update async-http, set a small queue length and prepare for a new round of testing. |
|
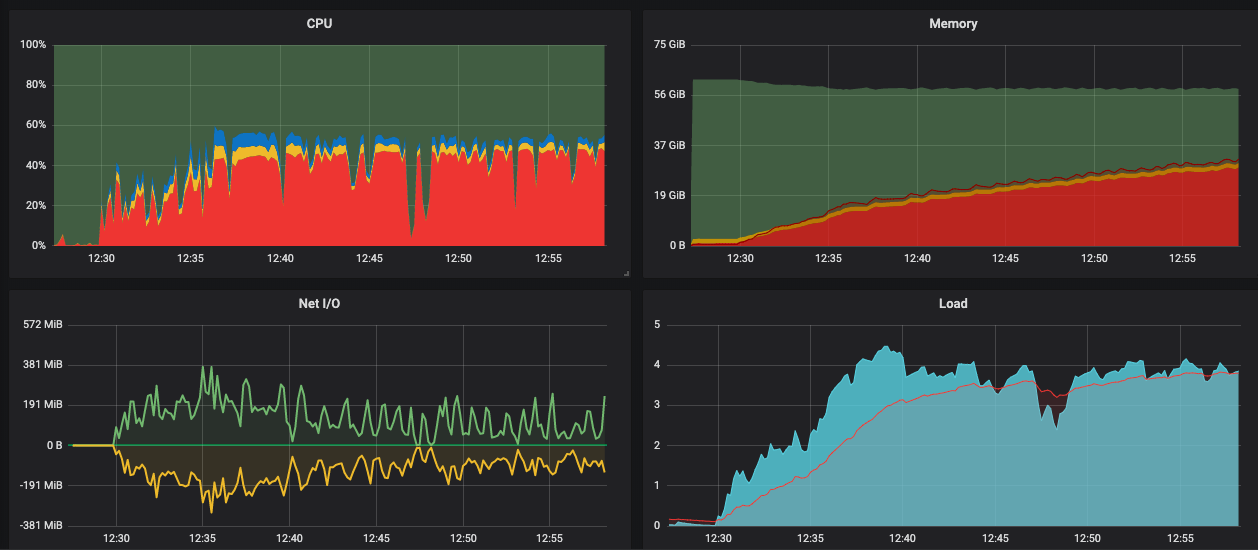
This is becoming the longest issue in the known history of GH. But I'm super happy we are making progress. So I updated async-http and made another round of tests. This is the perf profile of the server during testing:
This is still with plain HTTP URLs, no SSL at play. I have adjusted the LimitQueue length to 4 in production. What is remarkable:
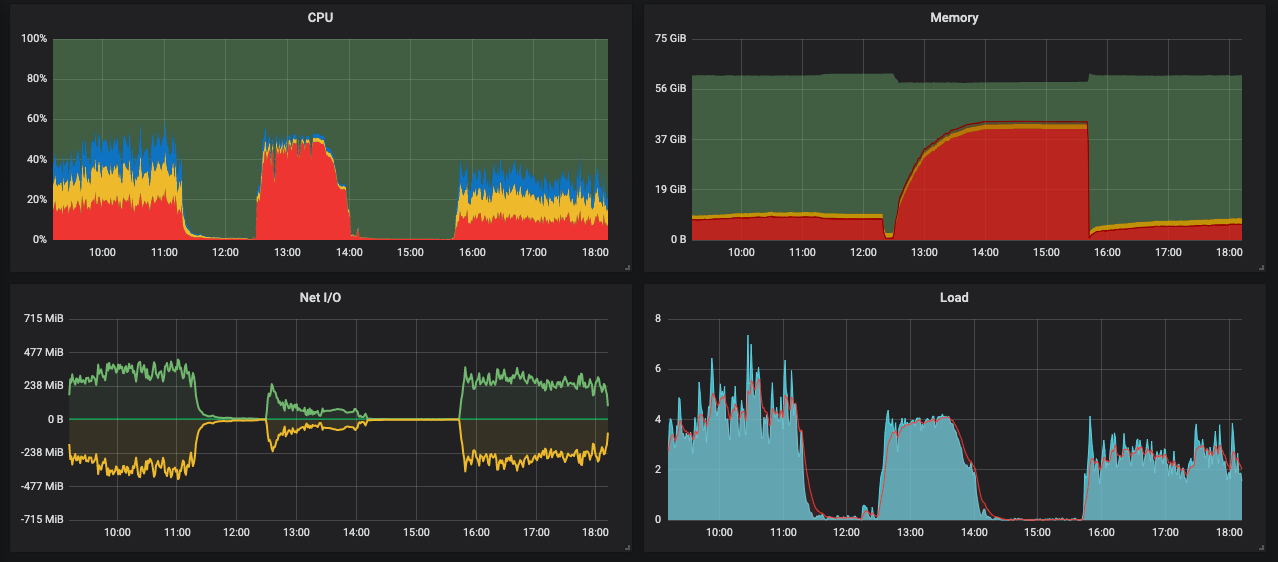
The throughput I could get from it is disappointing however. On Puma, on these servers, we get up to 400MB/s both ways. Here is the same graph surrounded with our usual periods of running Puma:
So Falcon starts at our usual throughput that I would expect, and then the throughput decays to substantially lower values. Here is that moment on the graphs:
It does indeed peg the cores, and that is fine, but I do expect the throughput to go higher. Also the memory consumption is quite extreme. What I do suspect:
|
|
Thanks for the update it's super helpful, and I'm glad we are making progress. You are right the memory usage does seem high. I found there was an issue with how HTTP/1 fixed response body and async-io buffering was interacting. I added some specs for throughput testing, and while more work is required, I did get some promising results for a simple server/client running in the same process using TCP sockets: This is on a fairly crappy MacBook Pro, so I suspect you can get more on a chunky server. Can you also confirm one thing for me, what is the content type of the response body? Because falcon will opportunistically compress it using deflate if it looks like a good candidate for compression. |
|
One more question, to help me know what we are aiming for - what is the maximum theoretical throughput? I'm assuming you have at least 10 GbE, or do you have bonded GbE? Or something else? |
|
Sweeping IO size, reading 4GB of data, given a specific chunk size: Then, power of 2 going up further: Obviously such a result is much more nuanced depending on a whole ton of factors, but at least it's interesting to see that: page aligned buffers work much better and anything beyond 128KB seems pointless. |
|
Using Using HTTP/2.0 performance is kind of to be expected since there is a ton of data framing required. Maybe it can be optimised in pure Ruby. More than likely, some kind of |
|
If you want to reduce the size of the stream buffer, you can specify |
|
I've added throughput specs to I've released these changes in |
|
So, I've been trying to get a handle on what the expected throughput should look like. In my current benchmarks on Travis (not exactly representative, I know), transferring 120KB, However, this isn't really representative of your situation. So, I changed the test a bit to see how it performs, increasing the body size to 1000 chunks of 12KB. Because I didn't consider this use case before, I never investigate it. Falcon is 2/3 the throughput of Puma in this micro-benchmark. I believe it's possible to improve on this, but I'm not sure if it's going to make any practical difference in real-world scenarios. So, I pass this back to you, can you please update latest |
|
Regarding memory per client, you could expect a maximum of |
|
64-65K seems best as on Linux this is the size of the fd buffer for non-blocking IO. I think your numbers hint at it being the optimum as well, because then your reads are aligned with the tick-tock nature of the socket buffer in the OS.
What is the queue depth in this case? Number of responses currently being served, number of connected clients which are past
I believe 400MB to 500MB per second is the maximum. Neither of the two - it is an EC2 instance which is serving out to the internet (via CloudFront, so CloudFront pulls from the instance), so it is roughly give or take half of a 10GbE. This matches numbers in https://cloudonaut.io/ec2-network-performance-cheat-sheet/ which show 4.97Gb baseline for our instance type. Have you tested falcon on 2 machines connected via metal 10GbE by any chance? What I am looking for is that I can let many more clients use the server with their speed being reduced, which is the issue we are facing with Puma at high load - there are lots of slow clients, and we would like to be able to accommodate them without the server melting.
I believe we force the content type of the output to The actual file types we serve are highly varied, and we also support
Certainly! Making changes now. |
If the cap is on the total throughput achievable regardless of the number of clients then this would be an issue, since to have the performance we have now we then would have to scale up the fleet by 33% - and it is already quite large. If the cap is for one client then it should be fine as you would be hard pressed to find a downloader who could saturate 5Gb of the lane in one swoop. |
|
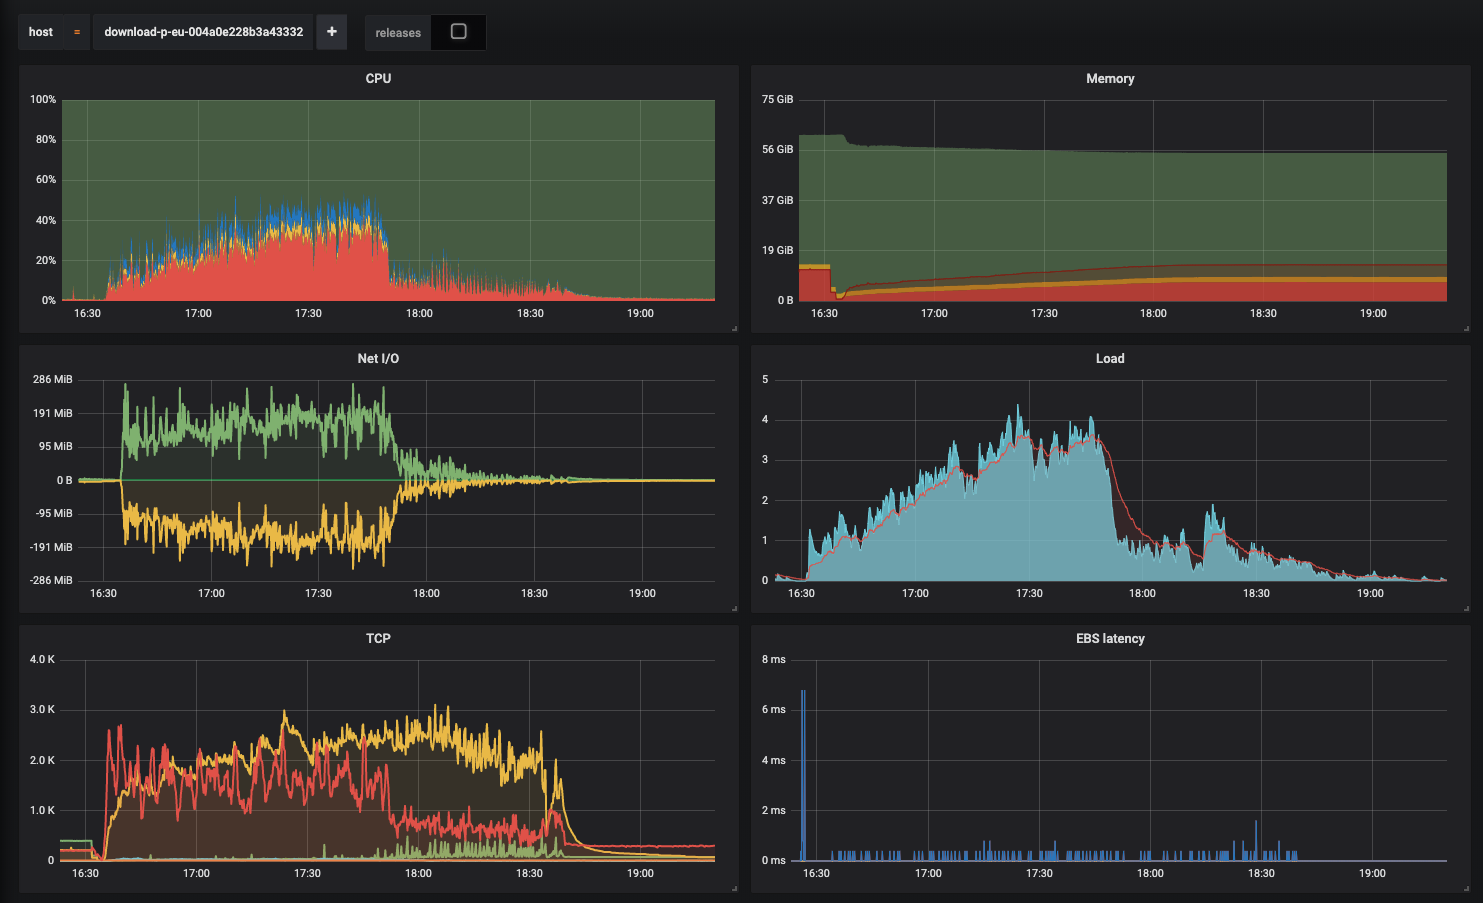
Yess! So far it seems to be reaching Puma levels, and adjusting the buffer size and updating async-http did do something magical. The RAM use is growing slowly but not nearly as explosively as before. I will let it run for a few hours I think and see where we end up.
|

|
At the rightmost point of the graph it is handling ~390 clients. |
|
Ok, the joy was short lived. It worked for a while and then... it suffocated itself it seems. The log was filled with ReadTimeout errors (see the code I've mailed you for where this gets raised). So while the memory use was fine, it looks like something is going on with multiplexing HTTP clients. At the time the values drop it was receiving normal traffic. The throughput dropped near-instantly (from normal to 3-4MB per second), CPU load as well.
Around 18:40 I started draining the server. I think I am sold on Falcon but I need a dumber HTTP client that integrates with it. Very basic: 1 socket per client outbound, reopen socket on EOF/timeout/EPIPE. No HTTP2, no compression, no multiplexing. How do I make one or which one can I use? Should I just yield a socket from the task? |
|
Async::HTTP is not complicated and is delivering on most of what you want. You could use individual connects to avoid the pool but then you don’t get any benefits of connection reuse which are quite decent in practice. Sounds like just a few more issues to nail. I’ll check the logged errors. |
Can you send me the log details and related code? |
|
@ioquatix Given the last flurry of updates to the libraries - should I do another round of tests? |
|
@julik that would be awesome! |
Thank you for exploring async in Ruby! We are currently looking at raising our throughput on our download servers (if you are curious there is a presentation about it here https://speakerdeck.com/julik/streaming-large-files-with-ruby - specifically see slide 16
This is repeated multiple times to "splice" response bodies together and works really well except that one response served this way consumes an entire thread. Async and fibers seem to be a good way to approach this problem, and nio4r also seems to be a great option because I can leverage the
ByteBufferimplementation and the IO reactor. But this is where the question obviously arises. In our scheme we have at the moment (see above) there are two elements which are crucial - that we download upstream data into a file buffer (in reality it is on a RAM filesystem) which is not in the Ruby heap. We then tell the kernel to write that file into the socket that services our client on the Puma side, and again no bytes enter the Ruby heap. In practice it means that we have next to no allocation overhead during streaming, regardless of the size of the workload / number of upstream requests we need to perform. nio4r supports this usage pattern if you use raw sockets and a ByteBuffer, from what I understood in the docs something like thisThis would allow reuse of the ByteBuffer and while not as efficient as
sendfile()- it would becomeread(infd, buf, size); write(outfd, buf, size)it would still allow us to accomplish what we need (not introducing these heaps of data into the Ruby string heap).I have taken a peek at the
beers.rbexample and what I could envision is something like this if I reproduce it:The problem that we have is that this will work well when the data transfer is relatively low-volume (chats, websockets etc.). But for us it will immediately blow up the Ruby heap with strings, since
Async::HTTP::Body::Writablefrom what I can see is basically a "messagebox" (channel) for Strings. Mem use will be probably similar to what you could achieve with Rack's#eachon a streaming body yielding Strings (we tried, it is immense and the application doesn't fit in RAM very quickly). What I want to do instead is pass the lowest-level possible objects to the reactor and tell it "Dear reactor, please use this fixed buffer to copy N bytes from this fd to that fd, and if there is an EAGAIN yield and try again later". But if both my "upstream" response body and my writable server response body are messgeboxes for Strings this option doesn't actually exist right?Strictly speaking - yes, I am looking for an alternative to a non-blocking
splice(). I can have plain (no-SSL) upstreams if that makes the job easier, I can also omit the "buffer to file first" if the rest of the setup works well. Everything in the setup is strictly HTTP1.1 at this point and the previous implementation even used HTTP1.0 for simplicity's sake.So the question is, I guess - is this kind of workload a fit for falcon? Is it a good fit for nio4r? I do have the feeling that orchestrating these large-volume IO ops with Ruby should be perfectly feasible but when I examine examples and involved collaborator modules all I see are Strings, Strings, Strings... (primarily async/http). Is there some kind of wrapper around the nio4r ByteBuffer maybe that I could use as the async response body instead maybe?..
Maybe somehow get access to the actual output socket Falcon sets up (a-la Rack hijack) and perform non-blocking IO on that socket manually via nio4r?
I believe this is intimately related to #7 among others.
Edit: or if there is something I could use to no-string-copy from the async-http client body to the writable body of my HTTP response that could work too 🤔
The text was updated successfully, but these errors were encountered: