


A plotter for multiple different data source (e.g. tensorboard, csv), directly within your terminal. This is useful when you are training your neural network on a remote server, and you just want to quickly peek at the training curve without launching a tensorboard instance and mess with forwarding ports.
You can install the package published in PyPI with
$ pip install terminal-plot
# or install with matplotlib backend dependency
$ pip install terminal-plot[matplotlib-backend]

# or install with an isolated environment
# $ pipx install terminal-plot[matplotlib-backend]You can use argcomplete to enable autocomplete for this script. For example, you can use the following for the fish shell:
register-python-argcomplete --shell fish termplot > ~/.config/fish/completions/termplot.fish$ termplot FOLDER/FILEFor example,
$ termplot ~/my_amazing_nn/runswhere runs is the folder that tensorboard had created.
Or, using csv as a data source:
$ termplot ~/my_stats/output.csv --csv
# use the -x flag to select which stat will be used as x-axis
# $ termplot ~/my_stats/output.csv --csv -x time
Or, using matplotlib as a plotting backend:
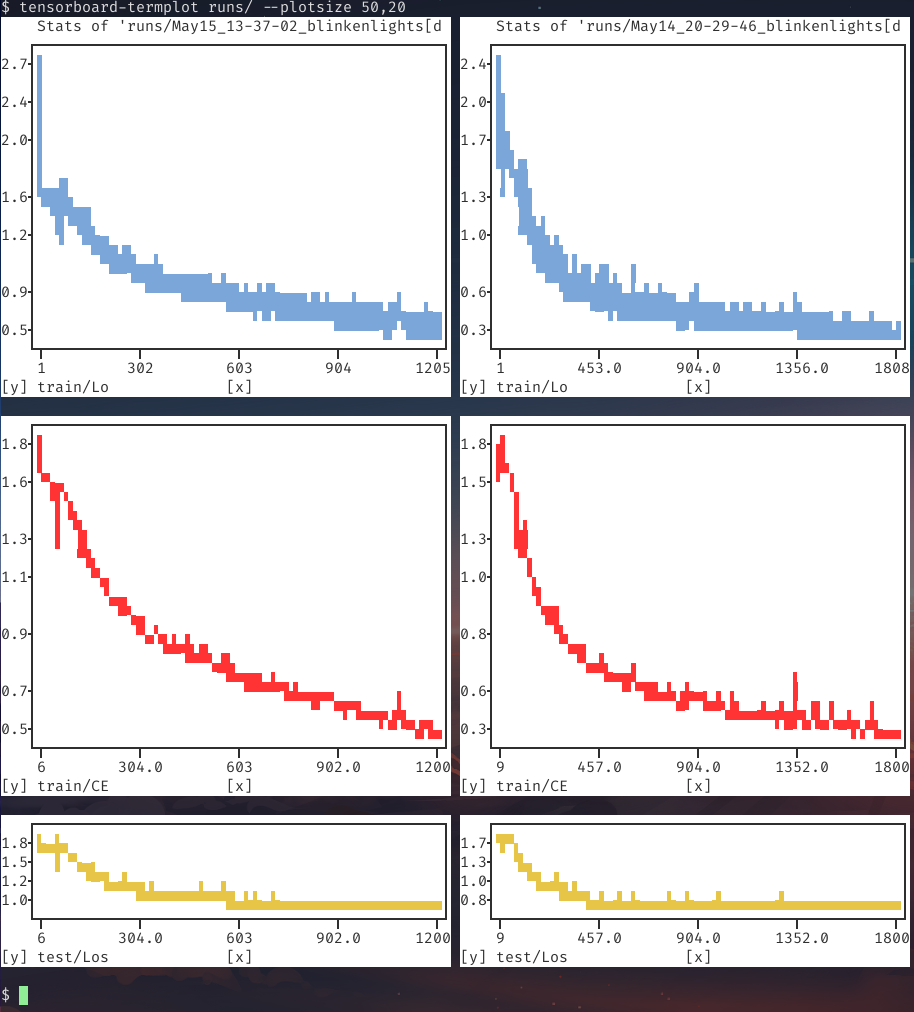
$ termplot ~/my_stats/output.csv --csv -mRunning the executable on a tensorboard output folder:
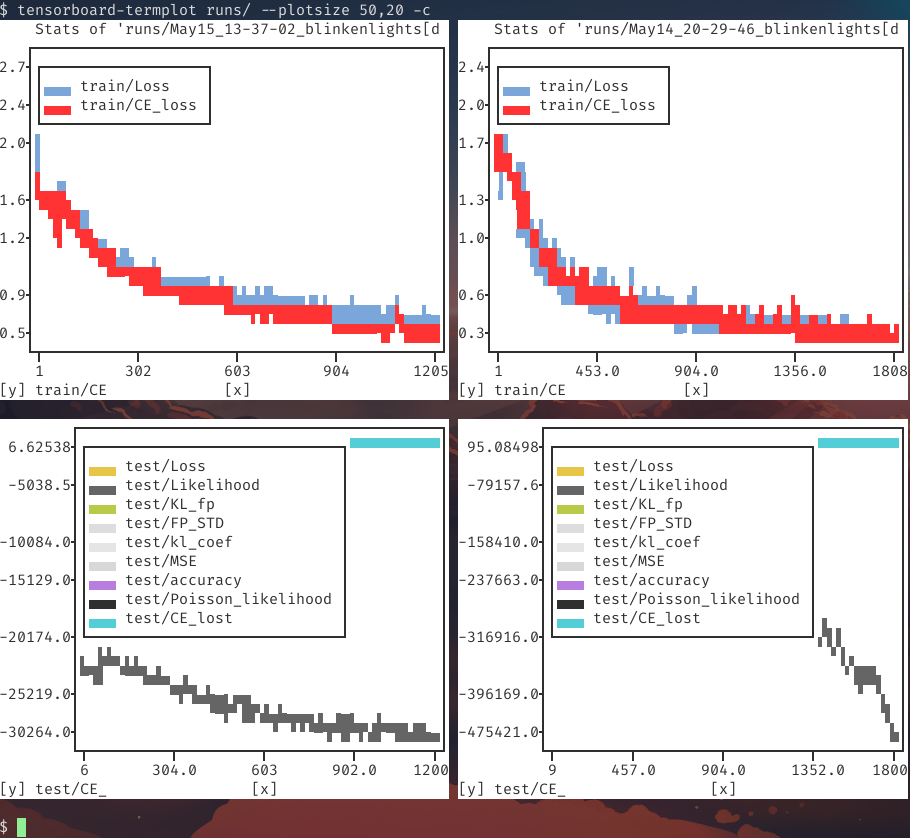
Or with the consolidated flag -c/--consolidate to combine multiple stats with a common prefix (most stats in the bottom figure had empty values):
$ termplot --help
usage: termplot [-h] [--version] [--debug]
                [--backend {plotext,matplotlib,matplotlib-terminal}]
                [--data-source {tensorboard,csv}] [-m] [--csv] [--latest]
                [--plotsize WIDTH,HEIGHT] [-c] [--as-scatter]
                [--canvas-color CANVAS_COLOR] [--axes-color AXES_COLOR]
                [--ticks-color TICKS_COLOR] [--grid] [--colorless] [-d]
                [--no-iter-color] [--force-label] [-f] [-n secs]
                [-w keyword [keyword ...]] [-b keyword [keyword ...]]
                [-x XAXIS_TYPE] [--xlog [row,col ...]] [--ylog [row,col ...]]
                [--xsymlog [row,col ...]] [--ysymlog [row,col ...]]
                [--xlim row,col=min,max [row,col=min,max ...]]
                [--ylim row,col=min,max [row,col=min,max ...]]
                [--as-raw-bytes] [-s [0-1]] [--smooth-poly-order poly-order]
                [--terminal-width TERMINAL_WIDTH]
                [--terminal-height TERMINAL_HEIGHT]
                FOLDER

positional arguments:
  FOLDER                Source folder or file

optional arguments:
  -h, --help            show this help message and exit
  --version             show program's version number and exit
  --debug
  --backend {plotext,matplotlib,matplotlib-terminal}
                        Set the plotting backend
  --data-source {tensorboard,csv}
                        Set the plotting data source
  -m, --matplotlib      Alias of --backend matplotlib
  --csv                 Alias of --data-source csv
  --latest, -l          Monitor the given folder, and always plot the latest
                        modified. The given argument must be a folder if this
                        flag is set.
  --plotsize WIDTH,HEIGHT
                        Manually set the size of each subplot, e.g., 50,20.
  -c, --consolidate     Consolidate based on prefix. If -cc is given,
                        everything will consolidated regardless of prefix
  --as-scatter          Plot as scatter (instead of line plot)
  --canvas-color CANVAS_COLOR
                        set the color of the plot canvas (the area where the
                        data is plotted)
  --axes-color AXES_COLOR
                        sets the background color of all the labels
                        surrounding the actual plot, i.e. the axes, axes
                        labels and ticks, title and legend, if present
  --ticks-color TICKS_COLOR
                        sets the (full-ground) color of the axes ticks and of
                        the grid lines.
  --grid                Show grid.
  --colorless           Remove color.
  -d, --dark-theme      A collection of flags. If set, it is equivalent to
                        setting canvas-color and axes-color to black, and
                        setting ticks-color to red. Can be overwritten
                        individually.
  --no-iter-color       Stop iterating through different colors per plot.
  --force-label         Force showing label even for plot with one series.
  -f, --follow          Run in a loop to update display periodic.
  -n secs, --interval secs
                        seconds to wait between updates
  -w keyword [keyword ...], --whitelist keyword [keyword ...]
                        Keyword that the stat must contain for it to be
                        plotted, case sensitive.
  -b keyword [keyword ...], --blacklist keyword [keyword ...]
                        Keyword that the stat must not contain for it to be
                        plotted, case sensitive.
  -x XAXIS_TYPE, --xaxis-type XAXIS_TYPE
                        Set value type to be used for x-axis. Tensorboard only
                        supports 'step' or 'time' as x-axis.
  --xlog [row,col ...]  Set the list of subplots to use log scale in x-axis
  --ylog [row,col ...]  Set the list of subplots to use log scale in y-axis
  --xsymlog [row,col ...]
                        Set the list of subplots to use symlog scale in x-axis
  --ysymlog [row,col ...]
                        Set the list of subplots to use symlog scale in y-axis
  --xlim row,col=min,max [row,col=min,max ...]
                        Set the list of xlim for the specified subplot.
  --ylim row,col=min,max [row,col=min,max ...]
                        Set the list of ylim for the specified subplot.
  --as-raw-bytes        Writes the raw image bytes to stdout.
  -s [0-1], --smooth [0-1]
                        A value from 0 to 1 as a smoothing factor.
  --smooth-poly-order poly-order
                        Polynomial order for the savgol smoothing algorithm.
  --terminal-width TERMINAL_WIDTH
                        Manually set the terminal width.
  --terminal-height TERMINAL_HEIGHT
                        Manually set the terminal height.