UX designers value user feedback highest. The user's word is the gold standard. But we often overlook the greatest source of user feedback: social media. In ignoring the 'collective knowledge' of their user group and by not being able to listen to their UI complaints online, UX designers miss out on important insights.
Using machine learning for social media analysis, we mine existing user feedback (user reviews, tweets, etc) about a product available on social media sites like Twitter, Facebook, Instagram to recommend UX/UI design changes. This gives the UX designer continuous and direct feedback from their actual users, and our analysis recommends changes to the design.
We use the below framework to measure our product's UX from online reviews posted to social media.
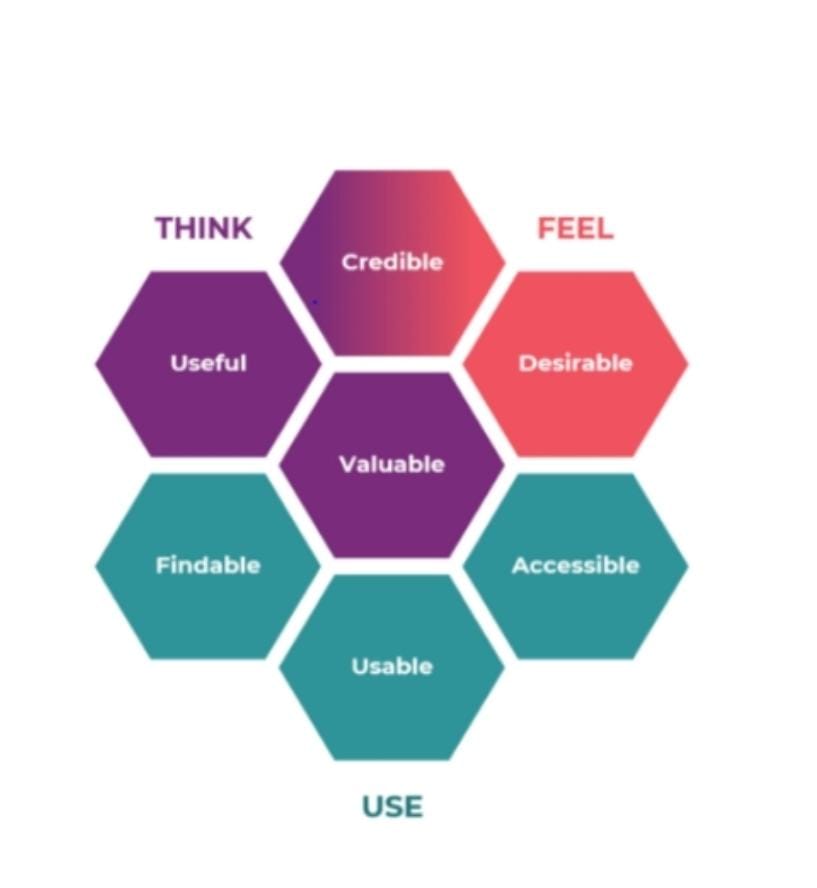
| UX Framework Attribute | Words to look out for in user feedback |
|---|---|
| Useful | Understandable, Consistent, Error, Approachable, ... |
| Desirable | Appropriate, Efficient, Truthful, Engaging, ... |
| Accessible | Disability, Visibility, Read Aloud, Difficult, ... |
| Secure | Permission, Location, Data, Confidence, Reliable, ... |
| Usability | Consistent, Completion, Informing, Navigation, ... |
The users' feedback has been sourced from Twitter & App store reviews for this prototype, but can be sourced from any social media or app platform we want. The text data from the tweets contain words that can trigger one of the seven prongs of our UX framework. By mapping the text data of the tweet to our framework, we can evaluate the UX of the product.
We use multiple analysis techniques from natural language processing (NLP) and supervised machine learning to do analysis on user tweets. Some of these techniques include:
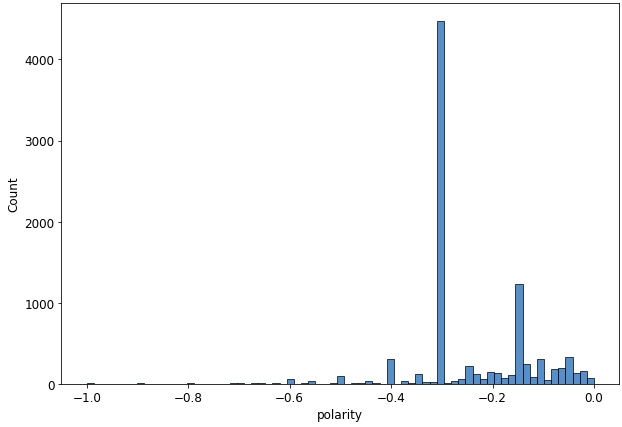
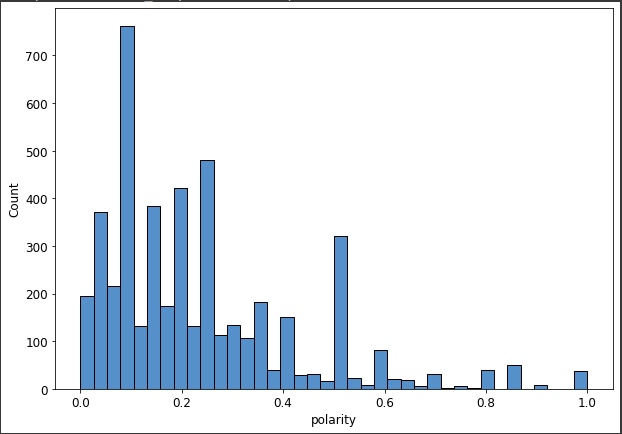
Gain a measure of user satisfaction from the tweet by algorithmically measuring how positive or negative the sentiment of the tweet is.
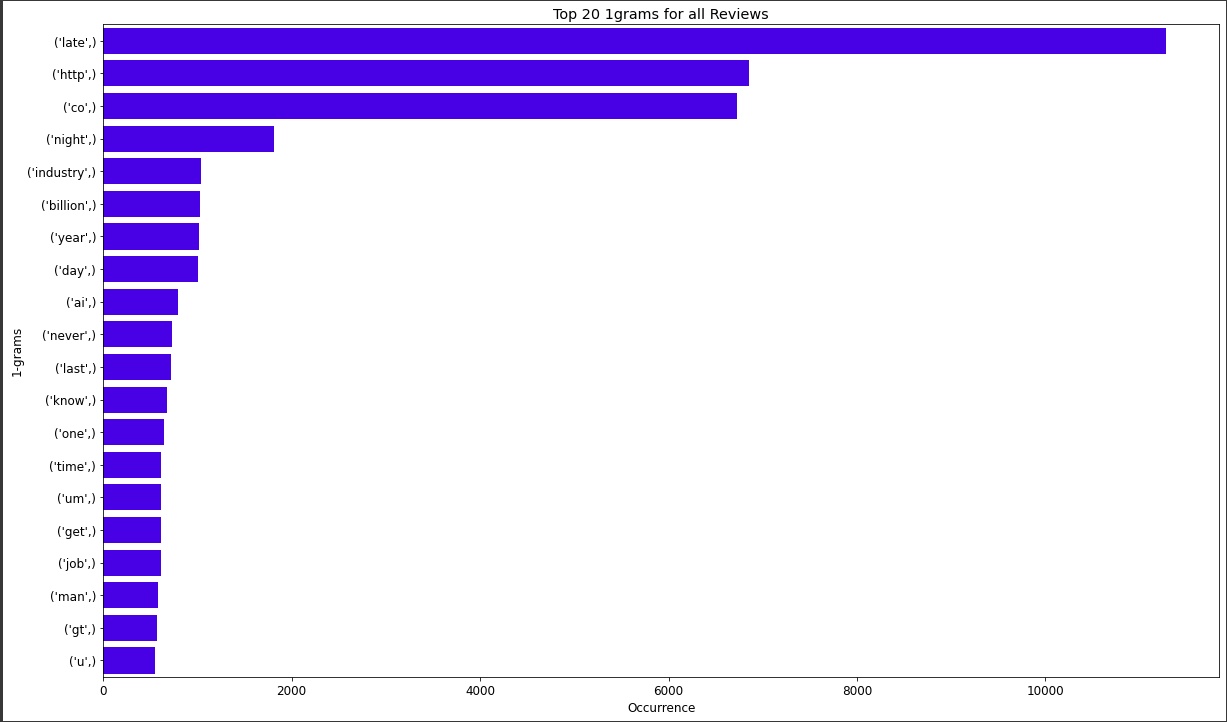
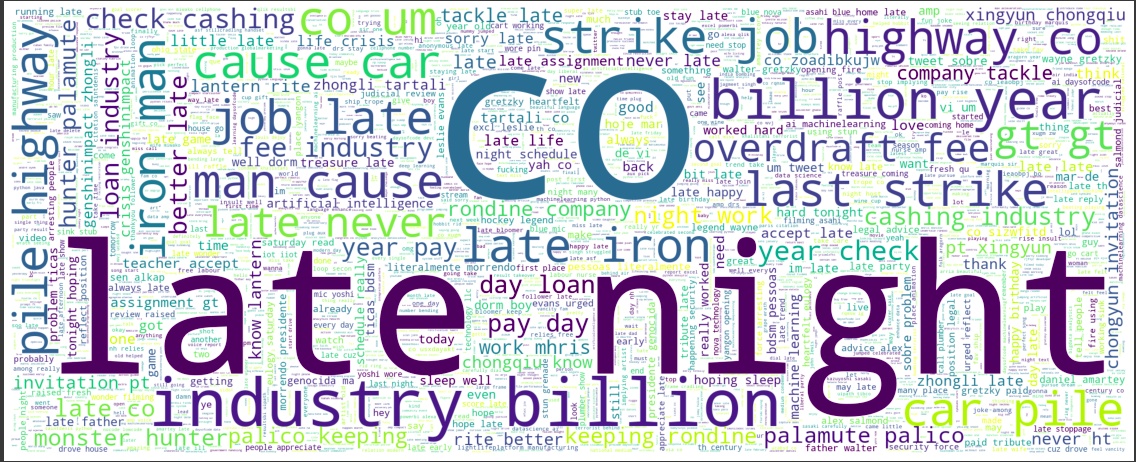
Tokenization and frequency analysis of text data from tweets and user reviews.
Use the 7-prong framework to determine the quality of the UX, from user feedback.
Prioritze which design bugs to fix first by visualizing frequency of particular complaints in user feedback.
Collect Tweets: Collected using calls to the Twitter API in listen_tweets.py. Sample data has also been provided.
- Jupyter notebook & Colab
- Data analysis: pandas, numpy
- Data visualization: seaboarn, matplotlib
- Natural Language Processing: nltk, textblob, wordcloud
- Twitter API
- MongoDB
- Adobe XD
- Daksha Dixit
- Simran Singh
- Arnav Ajay
- Arjun Bahuguna