Skip to content
New issue

Have a question about this project? Sign up for a free GitHub account to open an issue and contact its maintainers and the community.

By clicking “Sign up for GitHub”, you agree to our terms of service and privacy statement. We’ll occasionally send you account related emails.

Already on GitHub? Sign in to your account

Enhance classify.py script to build predictive models for classifying measurements #227

Open
MBARIMike opened this issue Dec 23, 2015 · 7 comments

Comments

@MBARIMike
Copy link
Contributor

This issue is a follow-on to Issue #49 and gets to the heart of performing Machine Learning on data stored in STOQS. There are comments in the createClassifier() method of https://github.com/stoqs/stoqs/blob/master/stoqs/contrib/analysis/classify.py that give pointers on what work needs to be done. Watch the video at https://www.youtube.com/watch?v=4ONBVNm3isI to learn the techniques that can be followed for creating classifiers and doing cross validation.

The key contribution of this issue is to implement general purpose predictive classification capability for any measurements in STOQS. The classify.py script provides a starting place for the implementation and Jupyter Notebooks should be used to demonstrate its use.

@MBARIMike
Copy link
Contributor Author

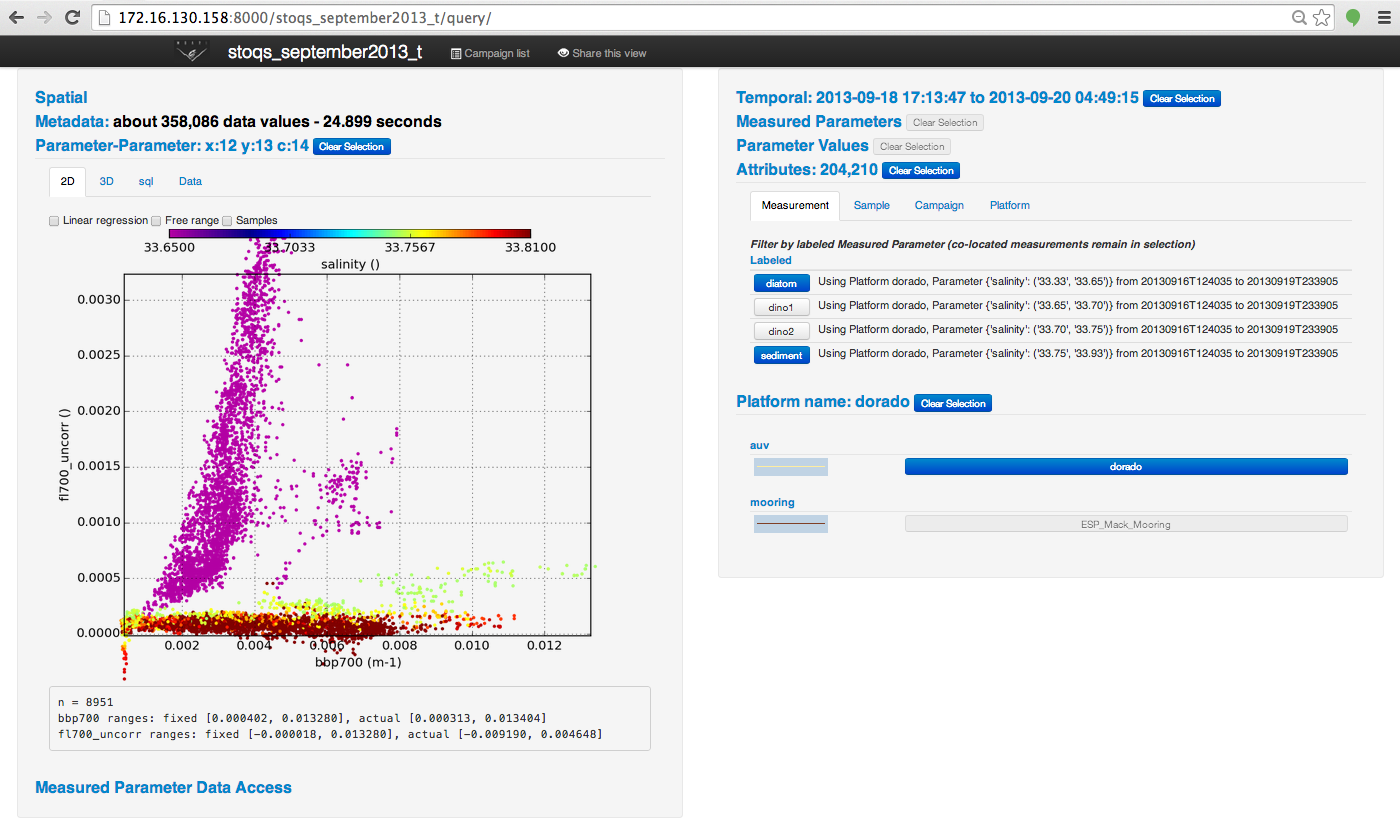
Dorado data from the stoqs_september2013 campaign have chlorophyll/backscatter data that are easily labeled as shown in this figure:

Labeled Data

For more background read Using STOQS (The spatial temporal oceanographic query system) to manage, visualize, and understand AUV, glider, and mooring data, especially section V, which is excerpted here:

V. UNDERSTANDING DATA
Today’s oceanographic campaigns produce tens of millions
of diverse measurements; this volume of data is too great for
individual users to understand, even with the effective user
interface that STOQS provides. Though it sounds fanciful, we
expect to soon ”teach” STOQS software to ”understand” the
data for us. By this we mean that algorithms can be developed
to recognize patterns, classify data, inform us of features, and
make predictions. Doing this sort of work is called machine
learning. To enable machine learning we recently modified the
STOQS schema to support labeling (or tagging) of data. This
is accomplished by inserting records in the MeasuredParameterResource
and SampledParameterResource tables as shown
in Fig. 14.
Storing labeled data in STOQS allows us to use all of its visualization
capabilities to explore the results of the algorithms.
For example, data similar to that shown in Fig. 13 have been
labeled with names of diatom, dino1, dino2, and sediment.
These names are exposed through the UI as selectable items
that may be applied as a filter on the data selection, allowing
for easy spatial-temporal exploration of labeled data within
the UI. Development of machine learning algorithms and data
exploration go hand-in-hand – STOQS has the capabilities we
need to accomplish this task.
The STOQS platform is under continued development. Machine
learning approaches to assess relational patterns within
and among multi-platform physical, chemical, and biological
data already in hand is our primary focus. For example,
implementation of additional data labeling within STOQS will
empower machine learning methods to identify and associate
specific combinations of optical (e.g., backscatter, transmissometry)
or other measurements with biological signals from
specific groups of organisms detected in representative water
samples (e.g., phytoplankton or zooplankton taxonomic
groups). With further development, it may be possible to identify
groups of organisms based solely on their specific physical
and/or chemical signatures that are more easily measured by
in situ electronic sensors.

@MBARIMike
Copy link
Contributor Author

Here is another resource to explore for performing classification in Python. With this you can actually execute the cells on the web without configuring your own STOQS development environment. You will need a Kaggle account, but that is easy to set up.

@MBARIMike
Copy link
Contributor Author

Once a model is developed and cross-validated form the Dorado data shown above it can be applied to other chlorophyll/backscatter data from the other vehicles that surveyed Monterey Bay during this same campaign. Here is an animated GIF of those data:

http://odss.mbari.org/data/canon/2013_Sep/Products/AUV_Gliders/stoqs_september2013_Fl_vs._bb__red_.gif

With these data classified we can then construct a picture of the spatial and temporal distribution of various kinds of plankton.

@MBARIMike
Copy link
Contributor Author

Welcome @devonrusconi and @vitoupen to the STOQS project! Here is another resource for learning about classification using scikit-learn:

https://github.com/rhiever/Data-Analysis-and-Machine-Learning-Projects/blob/master/example-data-science-notebook/Example%20Machine%20Learning%20Notebook.ipynb

@MBARIMike
Copy link
Contributor Author

Comparing classifiers plot added to Jupyter Notebook at https://github.com/MBARIMike/stoqs/blob/capstone2016/stoqs/contrib/notebooks/classify_data.ipynb

@MBARIMike
Copy link
Contributor Author

The Capstone 2016 contribution PR is a step toward the implementation of a general purpose predictive classification capability. This issue will remain open awaiting contributions toward this goal.

@MBARIMike
Copy link
Contributor Author

For background on using measurement data as proxies for identifying plankton please see this paper:

https://www.sciencedirect.com/science/article/pii/S0079661118300478?via%3Dihub

Sign up for free to join this conversation on GitHub. Already have an account? Sign in to comment
Projects
None yet
Development

No branches or pull requests

2 participants