Responsive Charts slightly bigger than container #225
Comments
|
I'm having the same problem...
|

|
I found the problem, I think https://github.com/swimlane/ngx-charts/blob/master/src/common/base-chart.component.ts#L90 The code above tries to get the dimensions from the parent node of the component. If I wrap the bar chart in a div with no paddings the error disappears. Or if I change the code above to simply get the dimensions from the hostElem then it works. But it might introduce other problems? |
|
Yes, the chart measures the dimensions of the parent container and sets its size to match them. If there is padding, it will be out of position. @leon proposed a good solution for now - wrapping the chart in a div without padding. I will investigate whether getting the dimensions from hostElem breaks anything, but for now please use what @leon suggested. Thanks for reporting. |
|
What might happen if we get the size of the component from itself is that the component could grow with one render, then it measures itself and grows a bit more, and before you know it the chart has outgrown the whole universe ;) This could be remedied by setting |
|
@marjan-georgiev just wondering if there was any update on this.
I was bit by this issue just now, the hostElem solution works on v6.1.0. |
|
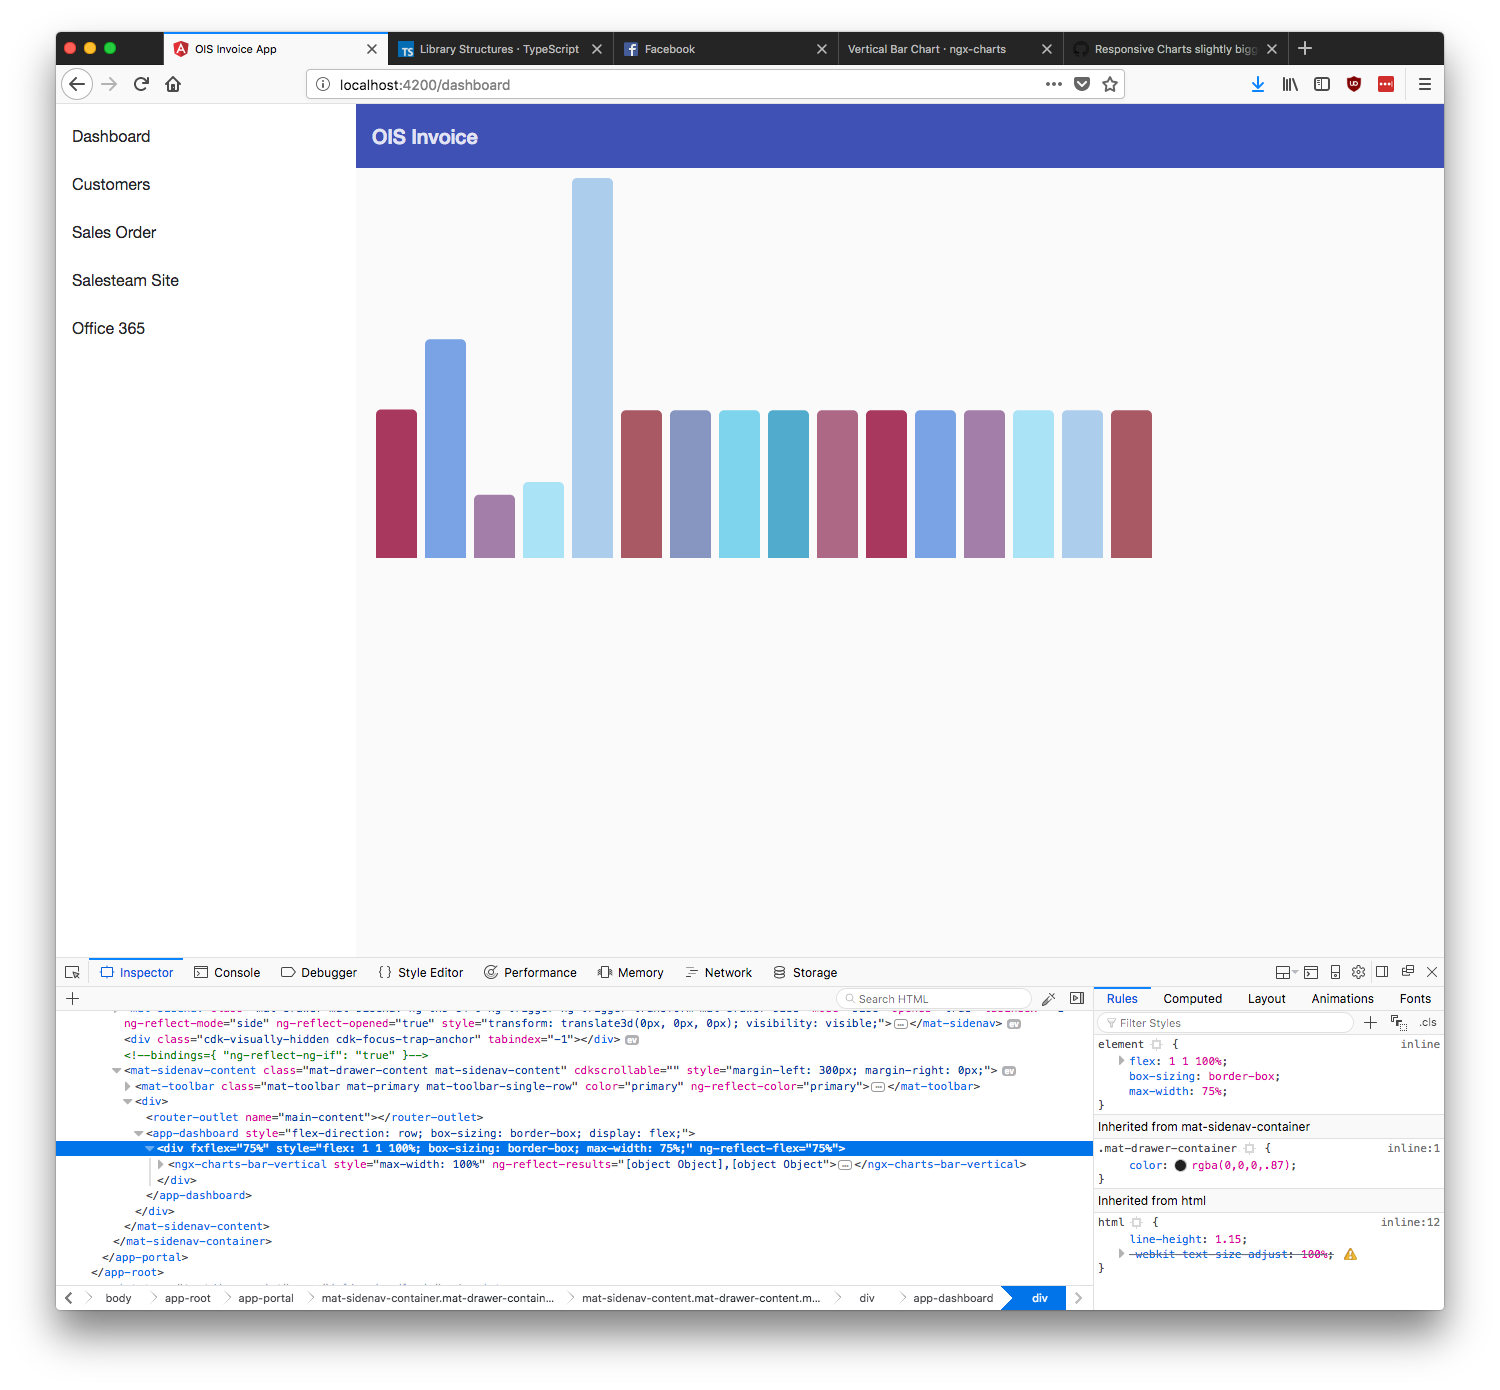
It also seems that when the charts are drawn within a fxFlex box, they are drawn before the flex box width is computed. Onload: After moving the window a little to get the observeables to fire:
Is there a way to get this polling to happen programmatically? |

|
Does the workaround still work? I didn't have any luck with "wrapping the chart in a div without padding". It seems like that the width of the chart ignores the parent element. Edit: It works for the height though. <div class="card">
<div class="card-body"><!-- this has padding -->
<div><!-- this is the workaround I tried -->
<ngx-charts-area-chart ...></ngx-charts-area-chart>
</div>
</div>
</div>Using Bootstrap 4.0.0 and ngx-charts 7.0.1. |
|
tobihagermann I had no luck with the wrap either. |
|
Please reopen if this is still an issue. |
|
some one found a solution for this??? |
|
This is still an issue for me, especially what @gpit2286 wrote. My version is |
|
Just as an FYI. I have moved on from the ngx charts and moved to ng2-charts but it has the same issue with flex boxes. The way I fixed it was by doing this.
What this does is delay's the rendering of the flex div until after there is content to display in it as the ngIf directive actually removes the HTML from the page. I don't really have time to make a stackblitz from this right now, but hopefully this helps everyone on thread. |
|
@gpit2286 sadly this doesn't work for me, I tried to set that variable to true OnInit, afterviewInit, aftercontentchecked, no luck, the containers still overlap. Any chance I could see some of your code? @marjan-georgiev how can I use @leon 's solution? it seems to be inside the component itself, should I clone the repo and just use my parallel version of ngx-charts or is there a better way? Thanks. |
|
@Hypercubed still an issue |
|
@willtheoct please post a stackblitz so we can look into it. To everyone, the immediate parent container must have its width and height set, and not have any padding, and the chart needs to be the only element inside of it. i.e. if you remove the chart from the parent container, and inspect the element, it should not have a height 0, because that's what the chart will use for its dimension. |
That's the problem. If you set width/height, you're not using flex. While it is a workaround, it limits the quality of the software produced. |
|
@willtheoct you can still use flex. We do in our product and it works fine. It just means you will need another container between your flex div and the chart. The chart will fit to whatever the width/height of the flex div is before the chart is inserted. The flex div will not resize based on the chart though, so that's why I am saying it would need to have a size in its empty state. If you still have issues, I would be happy to look at a stackblitz if you provide one. |
|
I found out why this is so hard to reproduce: you need to put a flex container within a container that has set dimensions. |
The issue in this particular example is the input in the same container as the chart. Here's what's happening:
|
|
Here's an updated stackblitz: https://stackblitz.com/edit/ngx-chart-in-flex-xmruvj?file=src/app/app.component.html |
|
edit: something is still off. If you refresh your example with the stackblitz console open, you can retract the console to increase the size of the blue area. when expanding it back, the blue area does not return to its original size, and the chart cannot shrink. |
I'm submitting a ... (check one with "x")
Current behavior
the svg element is marginally bigger than its parent container in responsive mode if parent container has padding
Expected behavior
the svg element would fit the parent container in responsive mode and take account of the padding
Reproduction of the problem
Use any container that has padding e.g. BS4 card
<div class="card"> <div class="card-header"> State Of The Parties </div> <div class="card-block" style="width:100%; min-height: 300px;"> <ngx-charts-bar-horizontal [scheme]="colorScheme" [results]="partyTotals" [yAxis]="true" [xAxis]="true" [legend]="false" [showGridLines]="false" [showXAxisLabel]="true" [showYAxisLabel]="true" [yAxisLabel]="Parties" [xAxisTickFormatting]="xBarFormat" (select)="onSelect($event)"> </ngx-charts-bar-horizontal> </div> </div>What is the motivation / use case for changing the behavior?
Chart hangs outside its container
Windows 10
The text was updated successfully, but these errors were encountered: