In this ReadMe we'll try to summarize all the results that we have obtained throughout the process of our research
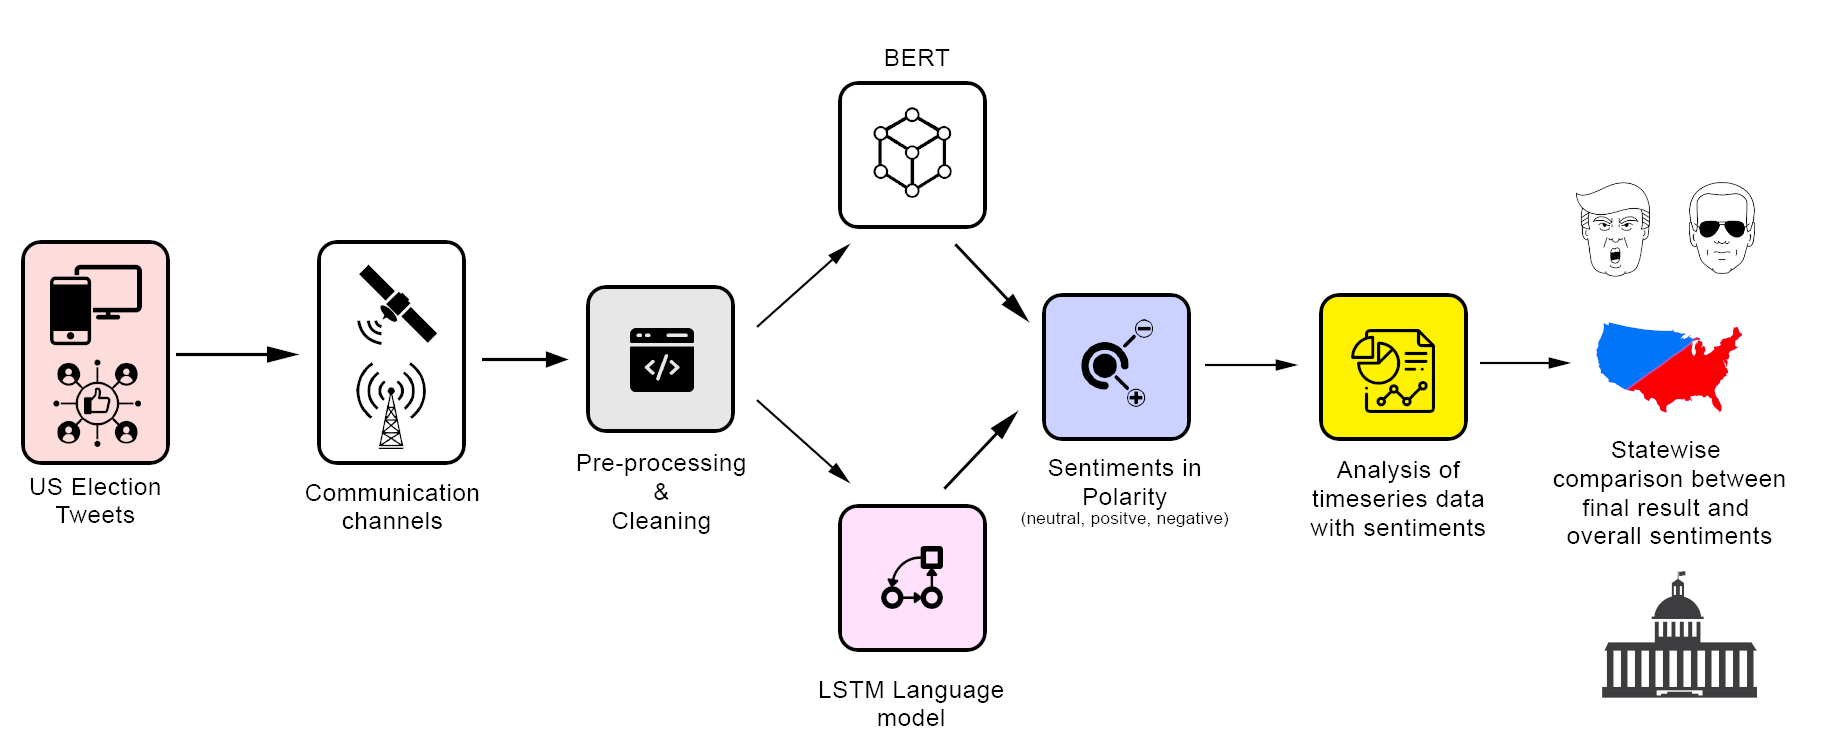
Social media has played a crucial role in shaping the worldview during election campaigns. It has been used as medium for political campaigns and tool for organising protests, some of which have been peaceful and while others led to riots. There has been some research that indicates that understanding user behaviour particular in terms of sentiments expressed during elections can provide some indication of election outcome. Recently, there has been tremendous progress in the area of language modeling with deep learning via long short-term memory (LSTM) models and variants known as bidirectional encoder representations from transformers (BERT). Motivated by these innovations, we develop a framework to model the US general elections. In this paper, we use BERT language model for Twitter sentiment analysis leading to the US 2020 presidential elections. We investigate if sentiment analysis can provide an indication of the results outcome using canonical LSTM and BERT language models. Our results show that sentiment analysis can form a general basis for modelling election outcomes where the BERT model indicated Biden winning the elections.
- Data set (Oct 15th 2020 - Nov 8th 2020, 1.72M Tweets)
created_at: Date and time of tweet creation
tweet_id: Unique ID of the tweet
tweet: Full tweet text
likes: Number of likes
retweet_count: Number of retweets
source: Utility used to post tweet
user_id: User ID of tweet creator
user_name: Username of tweet creator
user_screen_name: Screen name of tweet creator
user_description: Description of self by tweet creator
user_join_date: Join date of tweet creator
user_followers_count: Followers count on tweet creator
user_location: Location given on tweet creator's profile
lat: Latitude parsed from user_location
long: Longitude parsed from user_location
city: City parsed from user_location
country: Country parsed from user_location
state: State parsed from user_location
state_code: State code parsed from user_location
collected_at: Date and time tweet data was mined from twitter
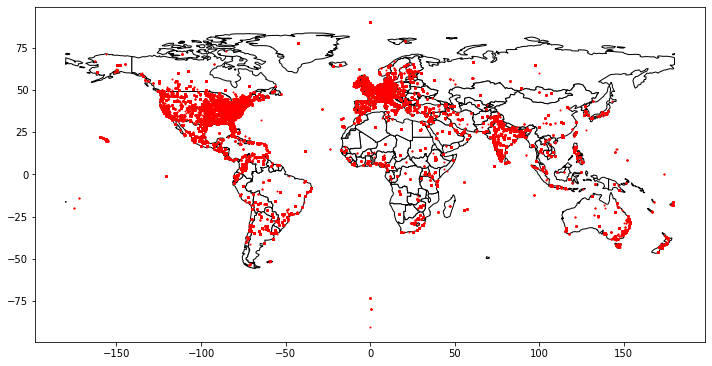
This figure presents a global visualisation by showing thelocations of tweets. There is interest in the US elections from many different countries in the world with tweets from 40different languages; however, a large proportion of the tweets are in English and originating from the US with 92,984 classifiedas English tweets from Lang-detect library of python. We note that only 47.25 percent of the data-set (544885 out of 1153079)tweets has user location since Twitter users can choose not to show their location. We find that majority of the tweets camefrom USA and Europe, followed by India which has a large population of growing internet and Twitter users.
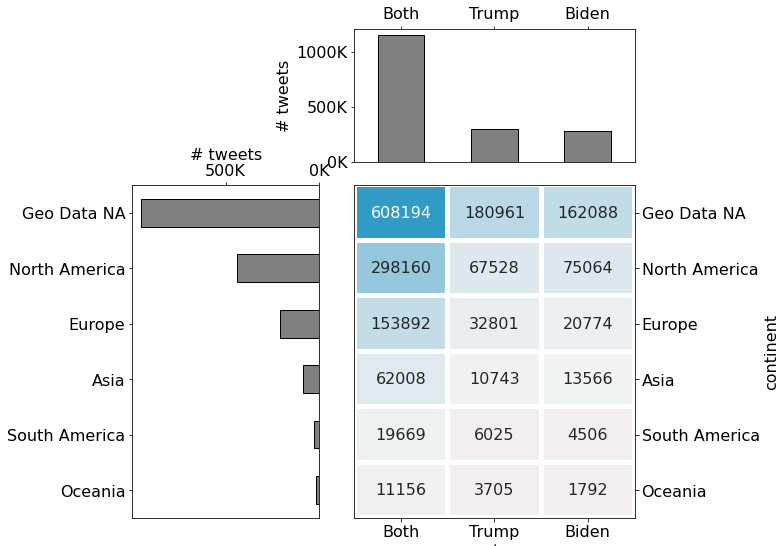
The information about the exact number of tweets for different location for Trump and Biden datasets is given in shown below, where we see that majority of the dataset is market by location not available.
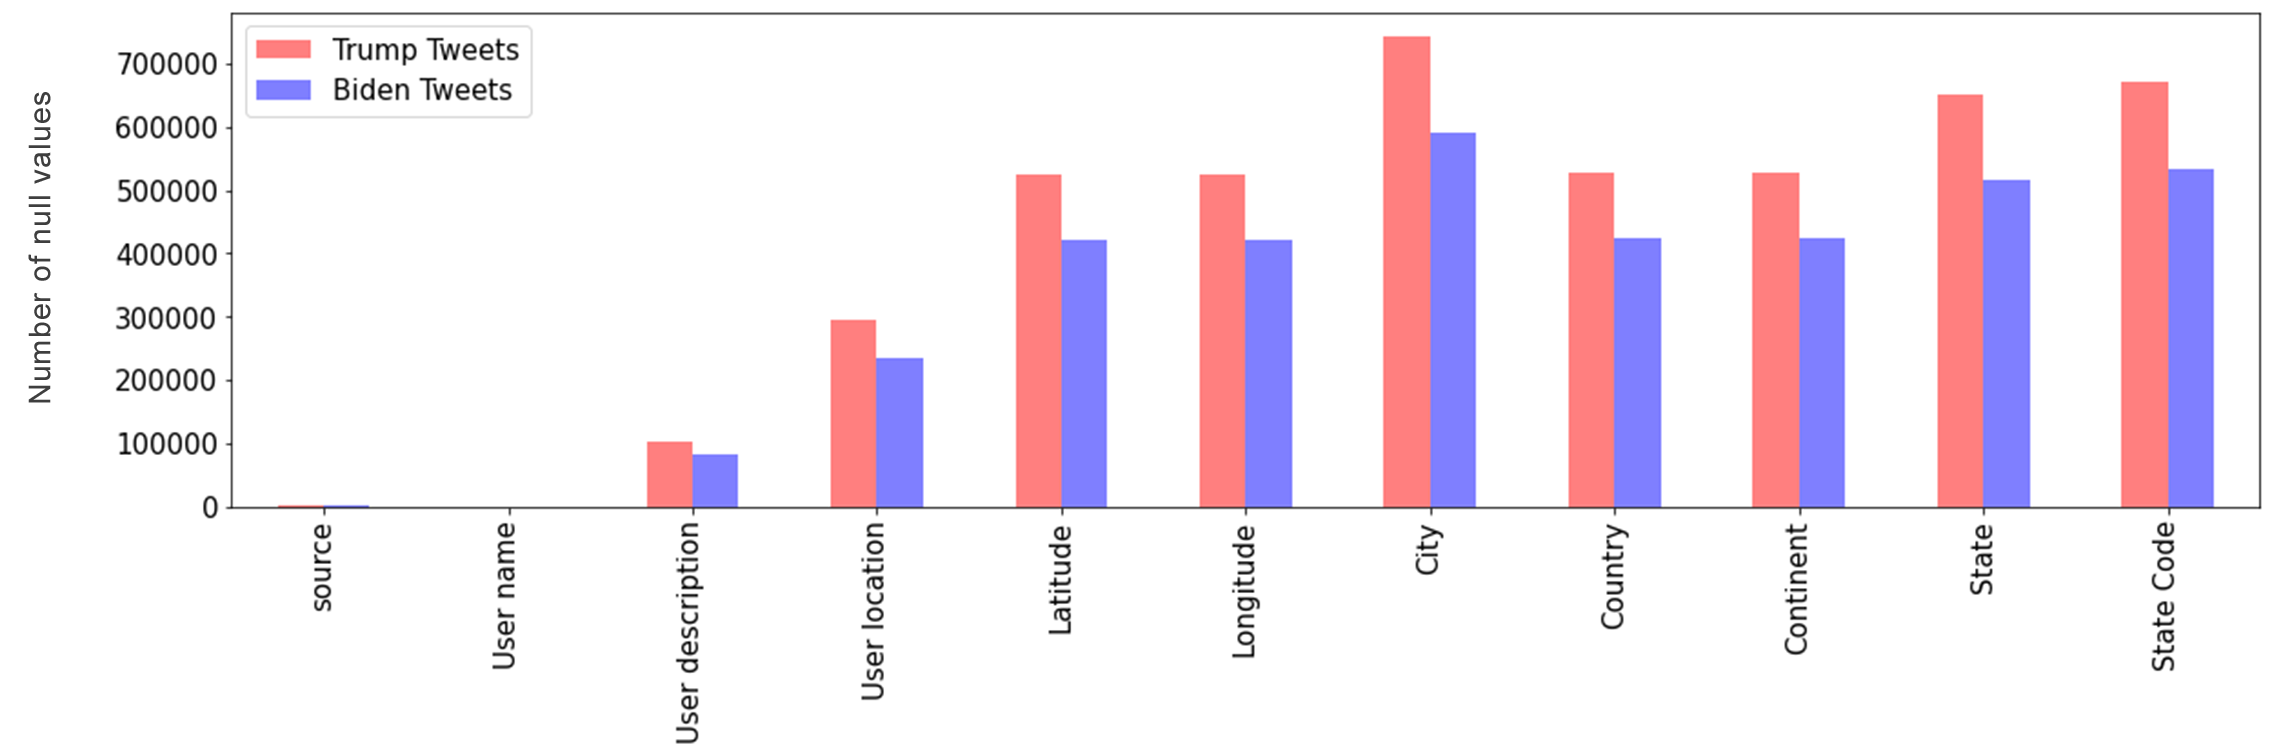
Number of missing (null) values present in tweets for the respective datasets (Trump and Biden) showing that thereis mostly missing information regarding user location and further details given by city, country, state and continent. Note thatthis is giving further information about the "Geo-data not available.
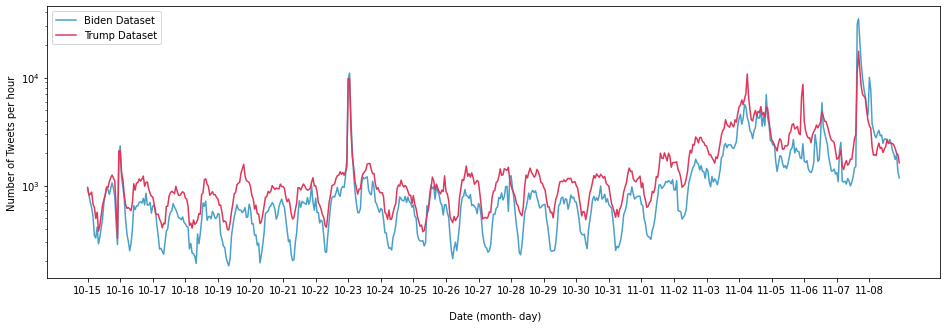
This figure shows the trend in the number of tweets per hour from 20th October to 20th November, 2020 which covers thespan before the elections. We note that there is a major spike around 23rd of October (10-23) which is due to the election debateheld6at the Belmont University. Similarly, from 1st November (11-01), the number of tweets gradually increased with majorspike around 8th November which is due to Biden being declared President Elect by majority of the news organization.
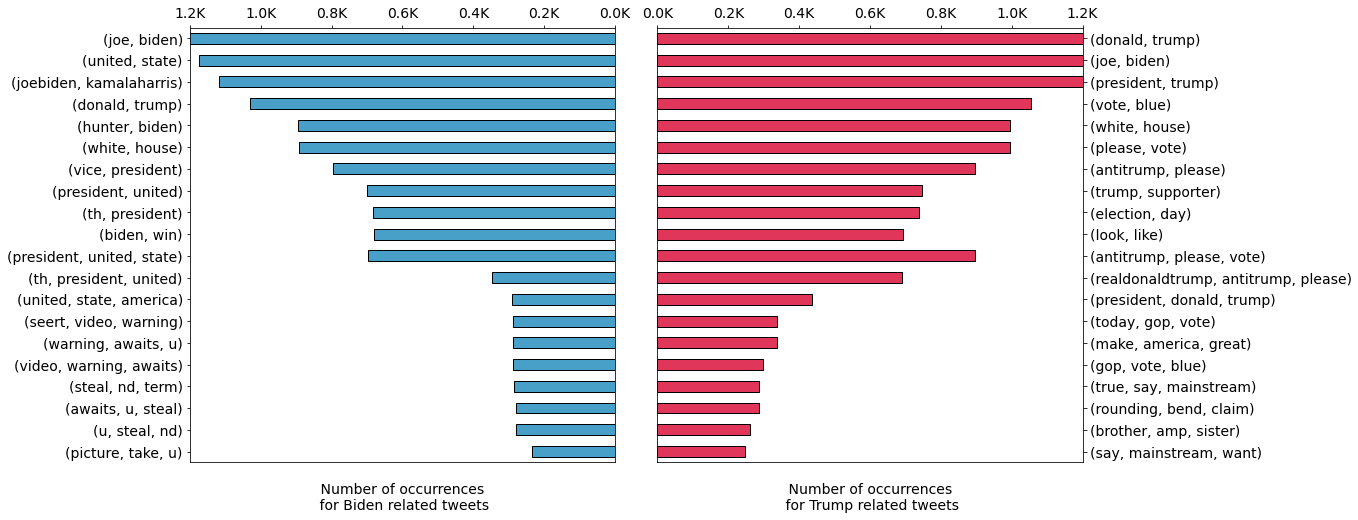
This figure presents the leading ten bi-grams and tri-grams from processed tweets from Trump and Biden datasets. We observethat the bi-grams are mostly descriptions of their respective roles and names. It is striking to see "joe - biden" as a secondhighest bi-gram in Trump dataset along with "antitrump - please". The tri-grams on the other hand are more descriptive ofsupport for Trump while in the case of Biden, we see "warning - awaits - u" and "video - warning - awaits" which seem to beeither negative sentiments or sentiments showing concern.
In this figure (Panel a) BERT for Trump dataset, we notice that in state of Montana (MA), the average polarity is much lower(below -0.1) when compared to the rest of the states. In the case if Biden dataset (Panel b), we find that there is no state withnegative average polarity. In the case of LSTM prediction for the Trump dataset, it can be observed that net sentiment polarityfor most of the sates is positive (Panel c). In (Panel d), the case of Biden dataset shows no negative polarity in predictions. Sofar, we can assert that both LSTM and BERT models have been predictive positive average polarity for Biden dataset, whileTrump dataset got some states with negative polari
BERT: Trump state-wise average polarity 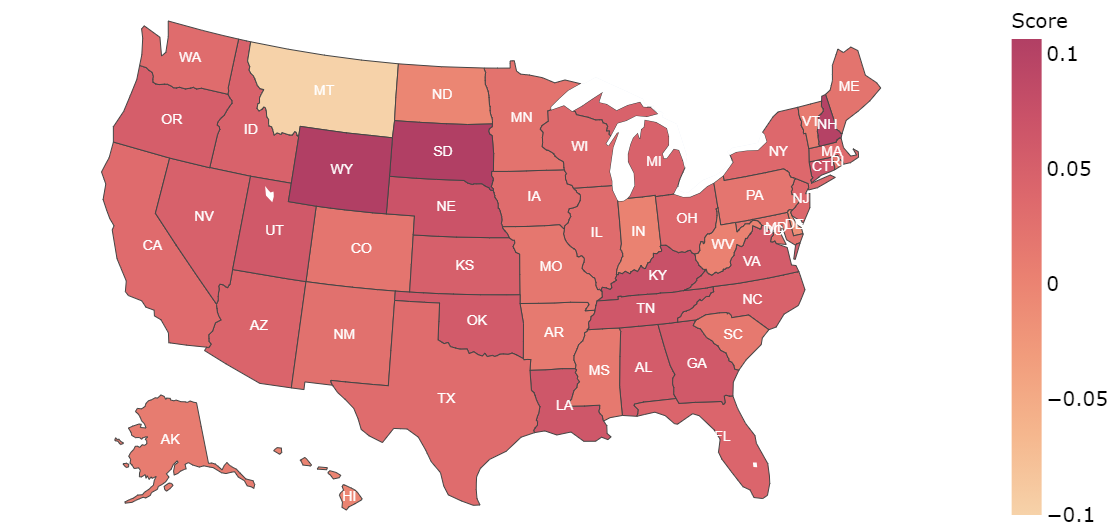 |
BERT: Biden state-wise average polarity 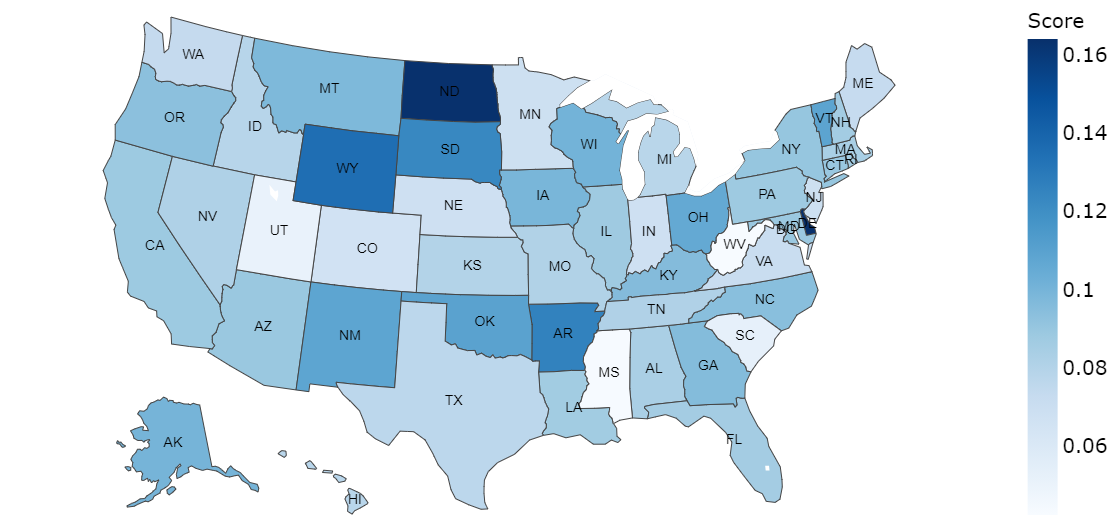 |
|---|---|
LSTM: Trump state-wise average polarity 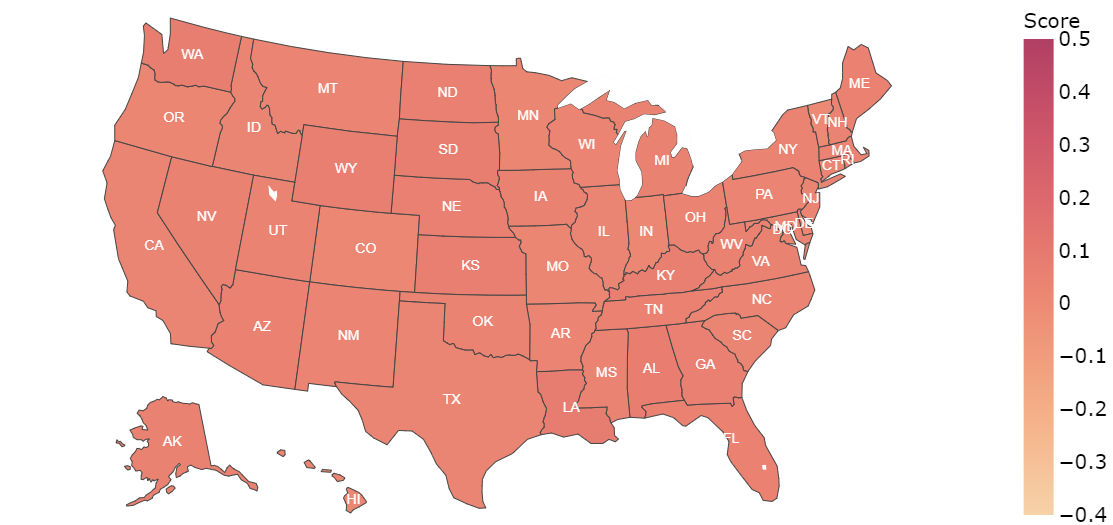 |
LSTM:Biden state-wise average polarity 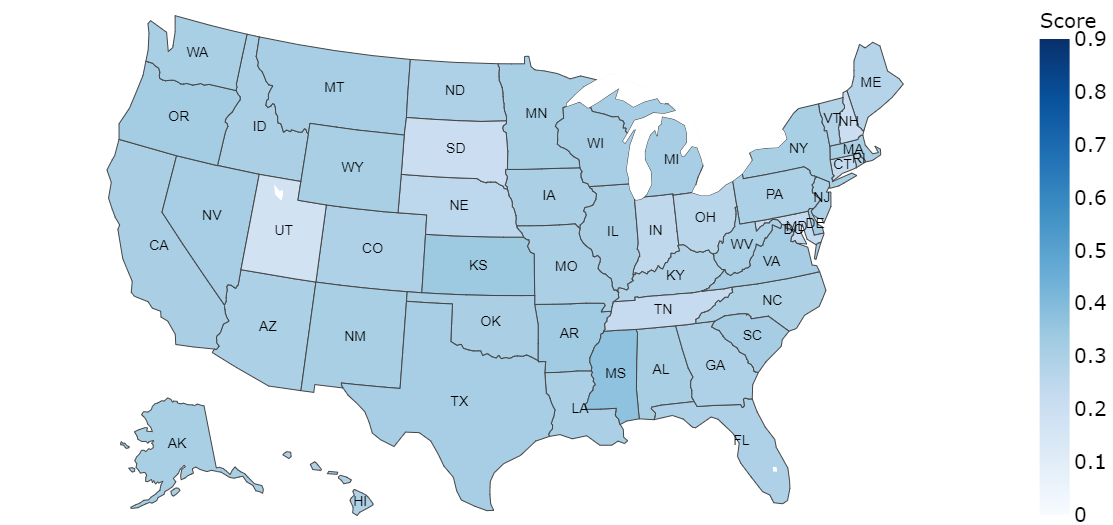 |
The results from BERT model in this Figure shows that sentiments analysis via Twitter can provide a good framework formodelling election results. If we compare the BERT model results (Panel a) with actual results (Panel d), we find that BERTmodel has been very promising in distinguishing the Trump and Biden states along with some of the contentious states. Wenote that the LSTM model could not fully capture the situation due to large number of neutral sentiments (Figure 7 - Panel b),and hence it has performed poorly in Figure 9 (Panel b) when compared with actual results (Panel d). There are a number offactors that needs to be considered for making a truthful prediction. While social media such as Twitter can give insights ofhow people vote, it must be noted that due to extreme viewpoints, a large percentage of voters do not express themselves insocial media. The factors such as distribution of tweets in terms of count, language, location plays a vital role which is evident from our results.
BERT model predictions 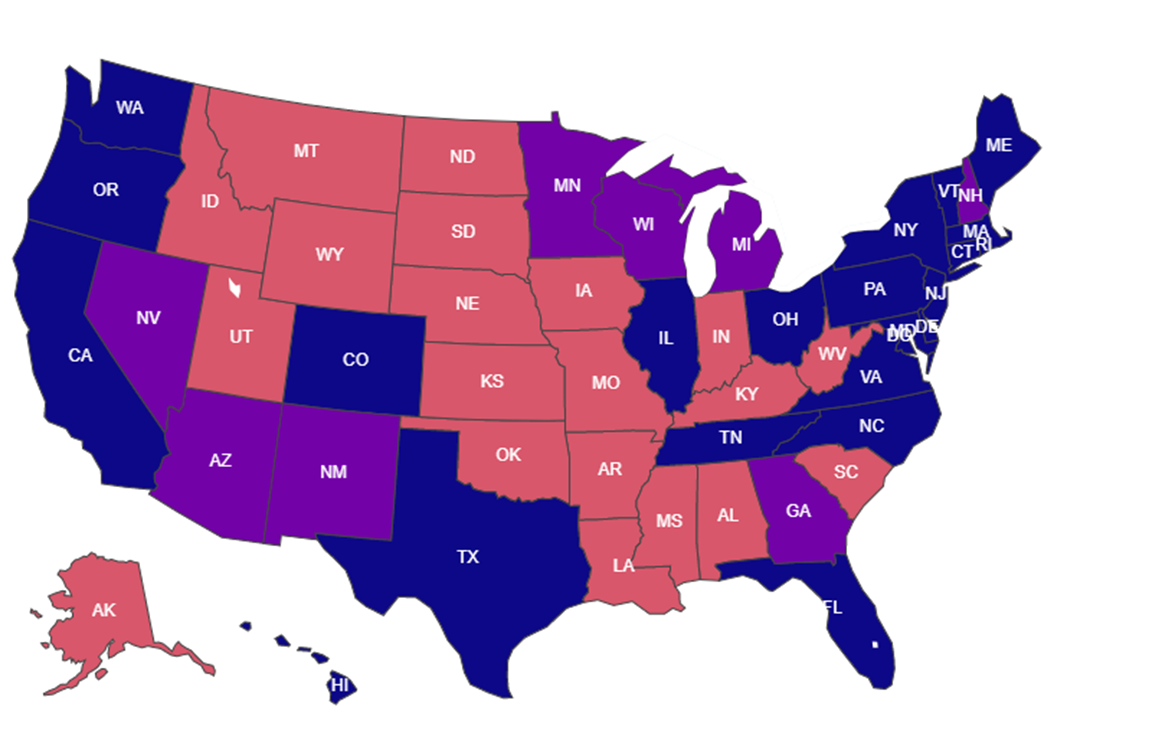 |
LSTM model predictions 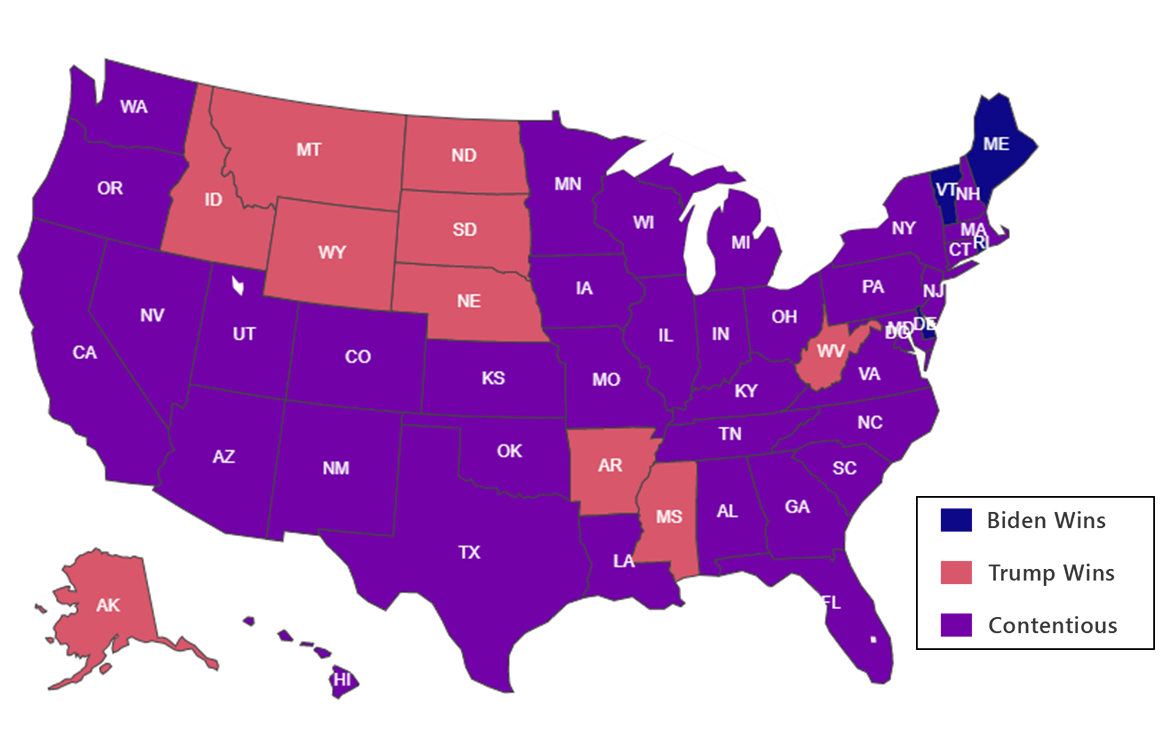 |
|---|---|
Major Swing States, 11th Nov 2020 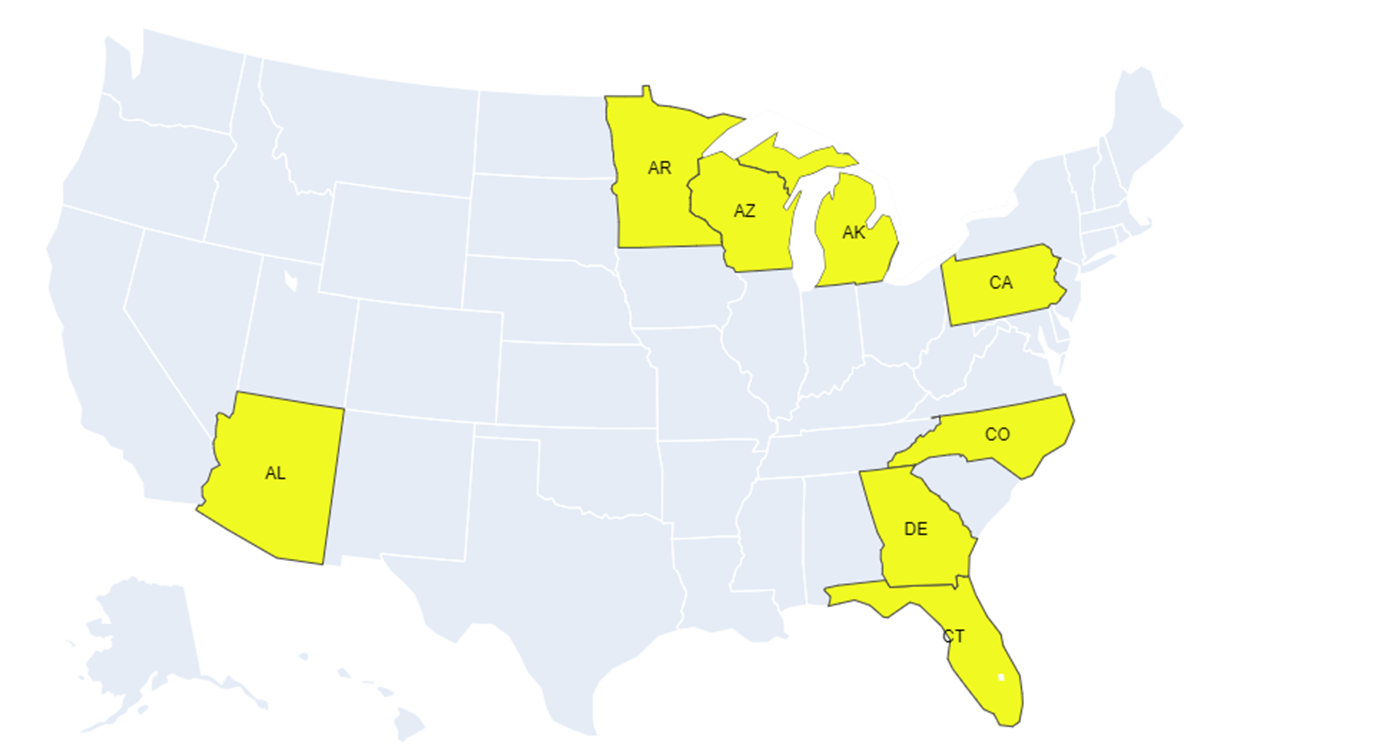 |
Actual Results, 15th Dec 2020 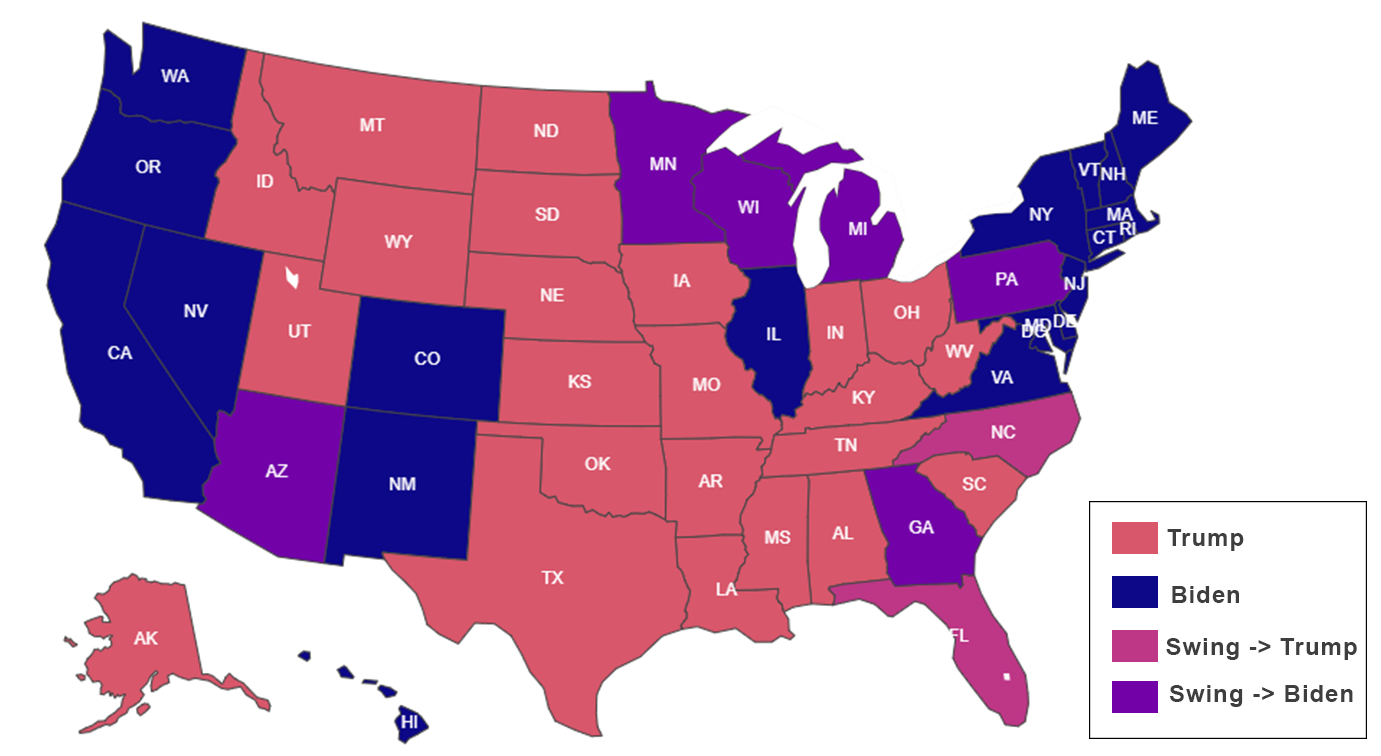 |
This figure shows the prediction by giving the percentage of tweets by positive, neutral, and negative sentiments for respectivecandidates using BERT and LSTM models. In the case of BERT, we observe that the both candidates had similar level ofneutral tweets and positive tweets, with lower number of negative tweets where Biden had more negative tweets than Trump.In the case of the LSTM model, we see that the number of negative and positive tweets is similar but there is a large influxof neutral tweets which is almost double when compared with the BERT model. These predictions show model bias whichcan be due to the model architecture and also due to the information that was already present in the pre-trained BERT model.We can quantify these predictions only by comparison with the actual election results, which is done later.
BERT 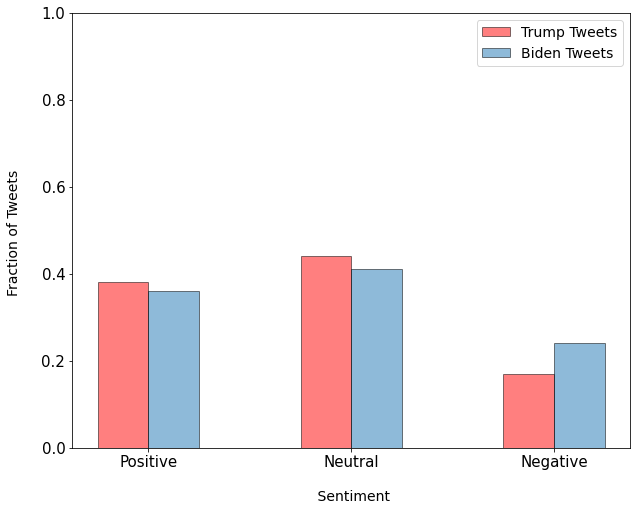 |
LSTM 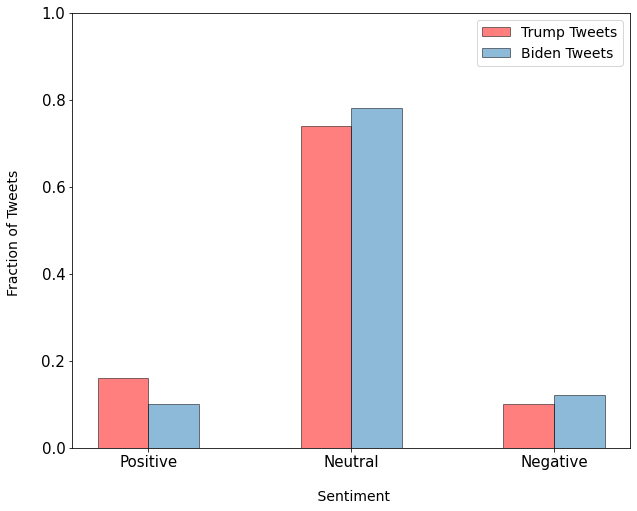 |
|---|
- UK General Election 2017: a Twitter Analysis
- Location-based Sentiment Analyses and Visualization of Twitter Election Data
- USA NOV.2020 ELECTION 20 MIL. TWEETS (WITH SENTIMENT AND PARTY NAME LABELS) DATASET
- PREDICTION OF USA NOVEMBER 2020 ELECTION RESULTS USING MULTIFACTOR TWITTER DATA ANALYSIS METHOD
- BERT: Pre-training of Deep Bidirectional Transformers for Language Understanding
- LSTM vs BERT
- Rohitash Chandra: Website Email: rohitash.chandra@unsw.edu.au
- Ritij Saini: Website Email: ritizsaini@iitb.ac.in
Distributed under the MIT License. See LICENSE for more information.