Incorrect plot of exponential expression #18920
Labels
Comments
|
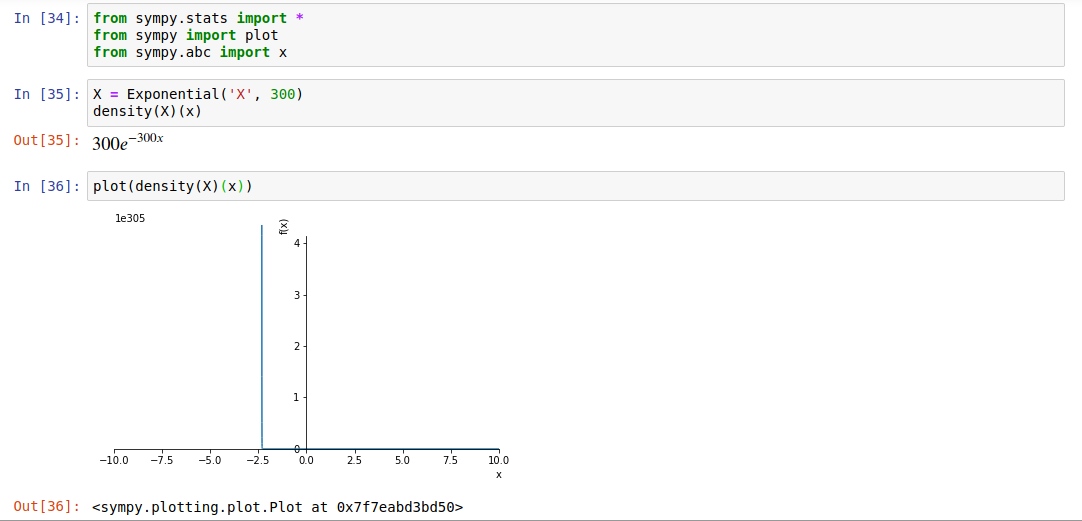
For a function that has an asymptote, you want to only use enough y-range to capture the asymptotic approach of the function to the vertical line defining the asymptote. A way to quantify this is to show approximately a length of asymptote that is about 2-5 times the length of the region beween asymptotes. So for tan(x) in the range of 0 to 2pi a vertical range of between 6 - 15 is about right. For an exponential-like function, perhaps no more than 3 decades of vertical change need be shown relative to the y resolution. Let's say y resolution is corresponds to 1e-5; then the y axis could go from 0 to 0.01. x axis range does not extend far past the point at which all points are less in magnitude than the y resolution. |
Sign up for free
to join this conversation on GitHub.
Already have an account?
Sign in to comment
While trying to add a plotting feature for the
statsmodule, I found the following issue with plotting.While plotting the density(X)(x), I got the following plot(in the below attached screenshot)
The text was updated successfully, but these errors were encountered: