
SBMLDiagrams is a Python package to visualize networks embedded in SBML Level 3 models. If the SBML layout and render extension are used, the package will use this data to display the network. SBMLDiagrams can export PNG, JPG, PDF files. SBMLDiagrams can be used to add SBML layout and render to an existing valid SBML model which can subsequently be exported.
We also have an interface of SBMLDiagrams to NetworkX to exploit the variety of layout algorithms.
Note that please make sure to save a copy of your SBML file before importing into SBMLDiagrams.
If you are using any of the code, please cite the article (https://doi.org/10.1093/bioinformatics/btac730) and the PYPI web page (https://pypi.org/project/SBMLDiagrams/).
pip install SBMLDiagrams
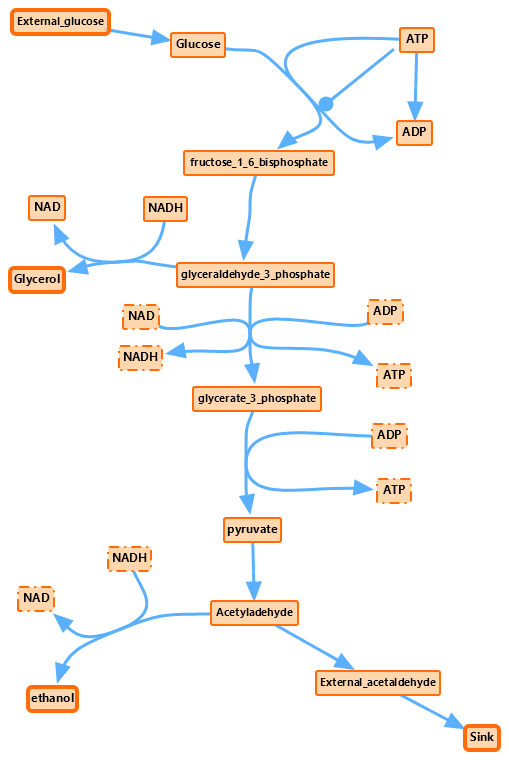
Here is a figure example visualized by SBMLDiagrams below. Users could use another GUI tool SBcoyote (https://github.com/sys-bio/SBcoyote; https://doi.org/10.1016/j.biosystems.2023.105001) together with SBMLDiagrams to adjust positions, i.e., bezier curves of reactions.
Its animation is also available at https://youtu.be/6VgjzrXLLoc. Please see more figure examples in the documentation.
Please see the documentation at https://sys-bio.github.io/SBMLDiagrams/ for details.