/
t9t-week5.md
159 lines (133 loc) · 5.83 KB
/
t9t-week5.md
1
2
3
4
5
6
7
8
9
10
11
12
13
14
15
16
17
18
19
20
21
22
23
24
25
26
27
28
29
30
31
32
33
34
35
36
37
38
39
40
41
42
43
44
45
46
47
48
49
50
51
52
53
54
55
56
57
58
59
60
61
62
63
64
65
66
67
68
69
70
71
72
73
74
75
76
77
78
79
80
81
82
83
84
85
86
87
88
89
90
91
92
93
94
95
96
97
98
99
100
101
102
103
104
105
106
107
108
109
110
111
112
113
114
115
116
117
118
119
120
121
122
123
124
125
126
127
128
129
130
131
132
133
134
135
136
137
138
139
140
141
142
143
144
145
146
147
148
149
150
151
152
153
154
155
156
157
158
159
---
title: 我的透明创业实验 - 第五周
description: 探究一个机灵程度中上的普通人, 给他一年时间让他自由创造, 是否有可能获得1000美元每月的被动收入.
date: 2019-06-17
---
<!-- > 码代码对我来说是做一个产品最轻松愉快的一部分, idea, marketing, communication, luck 是代码之外不可见却决定成败的因素 -- timqian -->
Hello world, 我是 [timqian](https://github.com/timqian), 正在进行为期一年的[透明创业实验](https://blog.t9t.io/transparent-startup-experiment-2019-05-20/). 这是关于这个实验第五周的实验记录.
记录主要分成 4 部分
1. 上周实验内容
2. 本周实验计划
3. 产品数据分享
4. 每日做的事记录
## 上周实验内容
### Product related
上周是思考 [wewe](https://github.com/t9tio/wewe) 应该长什么样以及埋头代码的一周.
<details>
<summary>对我具体做了哪些实际工作, 在什么事情上花了多长时间感兴趣的朋友可以点击这一行, 查看从 tomato-pie 截取的工作日志</summary>
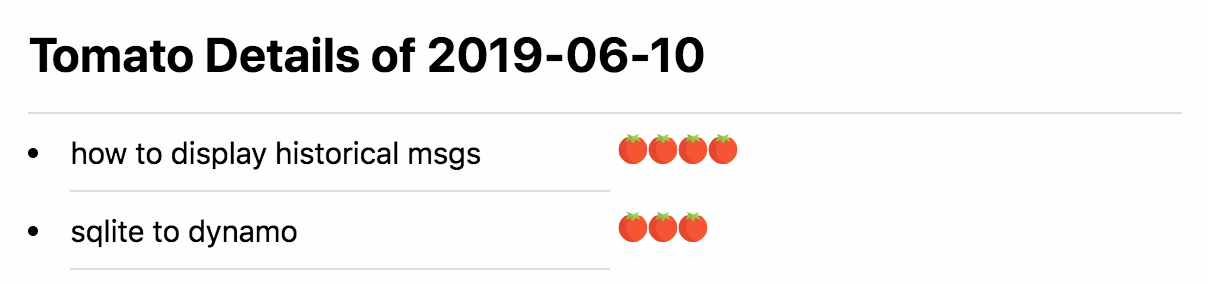
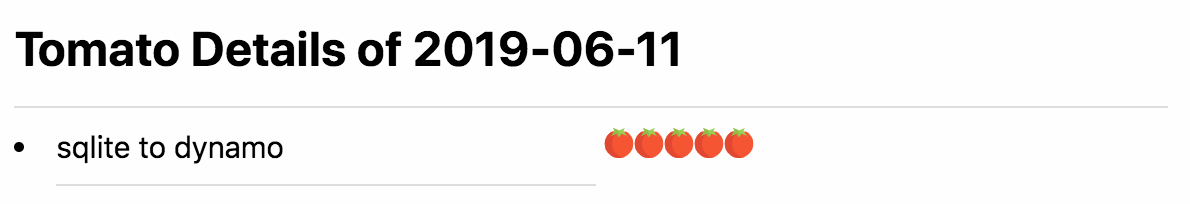
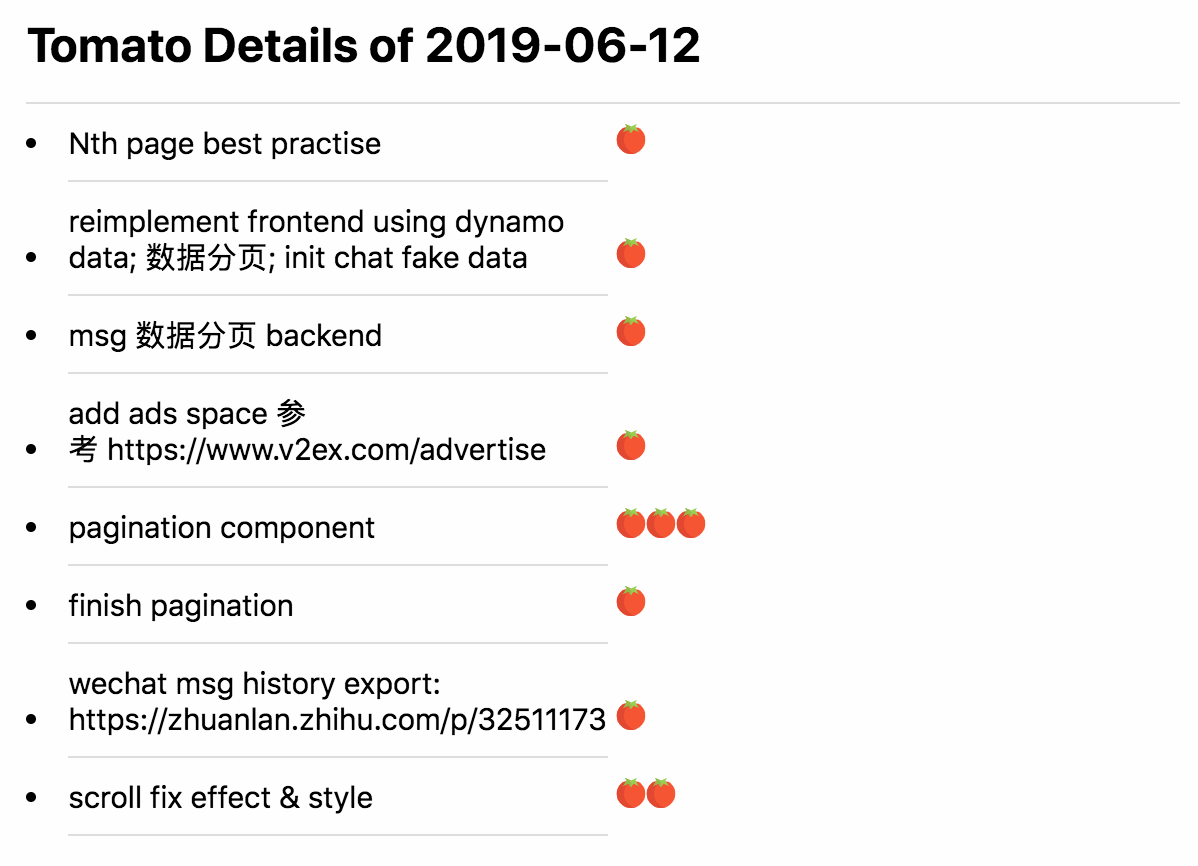
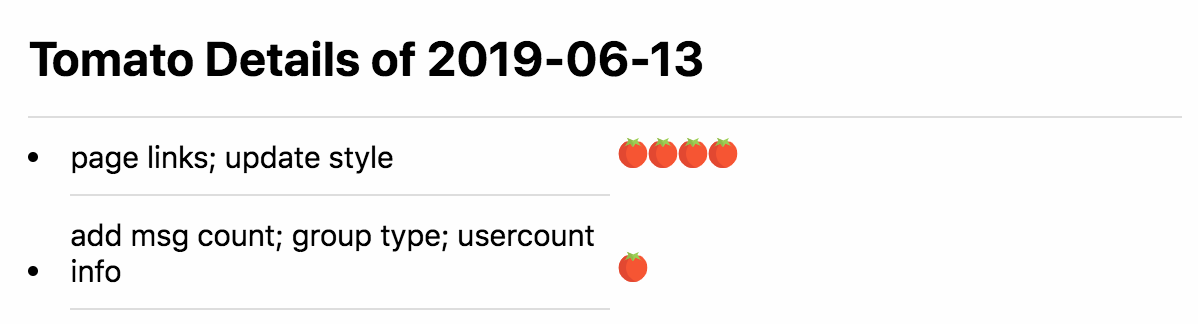
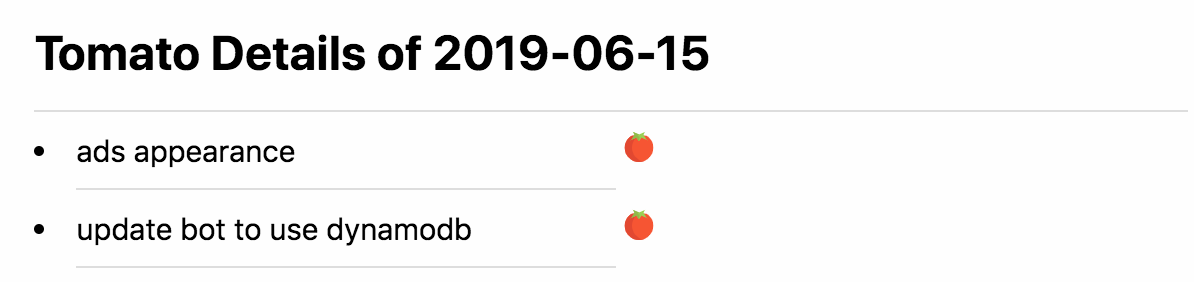
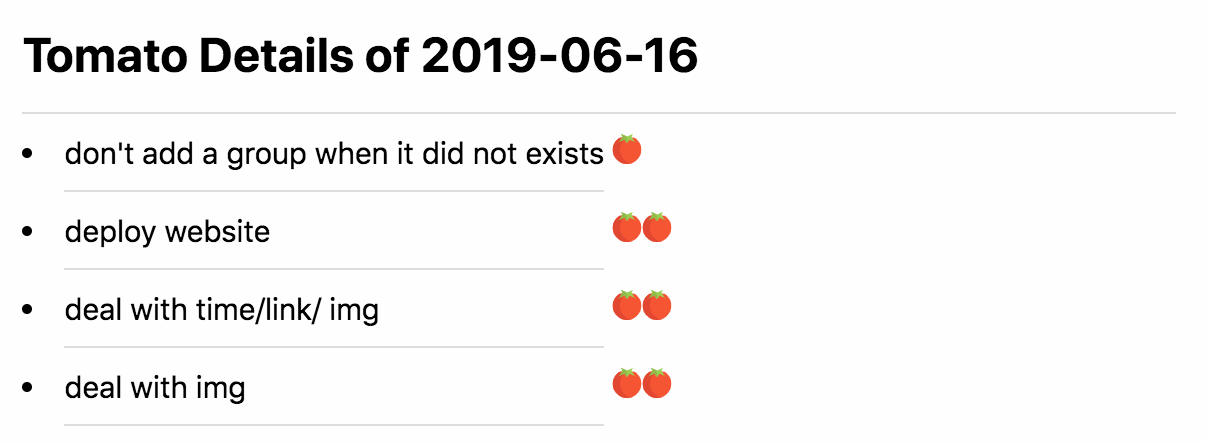
</details>
### Marketing related
上周没有做推广相关的事情, 但是一个月前在[阮一峰周报](http://www.ruanyifeng.com/blog/2019/06/weekly-issue-60.html) 投稿的透明创业实验博客发表了, 虽然只是在文章中部挂了一个链接和一句话简介, 还是给博客带来了两千多阅读量

- 这些阅读量转化为微信群友的有300多人, 转化率大约 10% (有点高到吓人, 怀疑有阅读量没被 Google analytics 拿到)
- 转化为 [github follower](https://github.com/timqian) 有100多人
- 转化为 [twitter follower](https://twitter/tim_qian) 70人
- 转化为 [spectrum 群友](https://spectrum.chat/t9tio) 20人
虽然上周关于 marketing 我啥也没做, 但可以说是在增加 follower 方面表现最好的一周..
## 本周计划
近一两天对 wewe 做一些扫尾工作, 应该马上会发布 beta 版在自己的群里做一下测试, 听一听反馈, 再继续动手.
## 数据分享
### 用户量
<canvas id="userChart"></canvas>
### github star 数
<canvas id="starChart"></canvas>
### 平均每月被动收入($)(本周收入 / 7 * 30)
<canvas id="incomeChart"></canvas>
<br/>
> [帮助我改进这篇文章](https://github.com/t9tio/blog/blob/master/source/_posts/t9t-week5.md)
<script src="https://cdn.jsdelivr.net/npm/chart.js@2.8.0"></script>
<script>
var chartColors = {
red: 'rgb(255, 99, 132)',
orange: 'rgb(255, 159, 64)',
yellow: 'rgb(255, 205, 86)',
green: 'rgb(75, 192, 192)',
blue: 'rgb(54, 162, 235)',
purple: 'rgb(153, 102, 255)',
grey: 'rgb(201, 203, 207)'
};
var userCtx = document.getElementById('userChart').getContext('2d');
var starCtx = document.getElementById('starChart').getContext('2d');
var incomeCtx = document.getElementById('incomeChart').getContext('2d');
new Chart(userCtx, {
type: 'line',
data: {
labels: ['week 1', 'week 2', 'week 3', 'week 4', 'week 5'],
datasets: [{
label: 'open source jobs',
backgroundColor: chartColors.red,
borderColor: chartColors.red,
fill: false,
data: [39, 60, 62, 80, 101]
},{
label: 'tomato-pie',
backgroundColor: chartColors.orange,
borderColor: chartColors.orange,
fill: false,
data: [653, 673, 722, 634, 647]
},{
label: 'star-history 插件',
backgroundColor: chartColors.green,
borderColor: chartColors.green,
fill: false,
data: [21, 21, 28, 33, 33]
}]
},
});
new Chart(starCtx, {
type: 'line',
data: {
labels: ['week 1', 'week 2', 'week 3', 'week 4', 'week 5'],
datasets: [{
label: 'open source jobs',
backgroundColor: chartColors.red,
borderColor: chartColors.red,
fill: false,
data: [731, 764, 763, 821, 872]
},{
label: 'tomato-pie',
backgroundColor: chartColors.orange,
borderColor: chartColors.orange,
fill: false,
data: [107, 113, 117, 118, 125]
},{
label: 'star-history 插件',
backgroundColor: chartColors.green,
borderColor: chartColors.green,
fill: false,
data: [921, 998, 1110, 1129, 1154]
}]
},
});
new Chart(incomeCtx, {
type: 'line',
data: {
labels: ['week 1', 'week 2', 'week 3', 'week 4', 'week 5'],
datasets: [{
label: 'open opptunities',
backgroundColor: chartColors.red,
borderColor: chartColors.red,
fill: false,
data: [0, 0, 0, 0, 0]
},{
label: 'tomato-pie',
backgroundColor: chartColors.orange,
borderColor: chartColors.orange,
fill: false,
data: [0, 0, 0, 0, 0]
},{
label: 'star-history 插件',
backgroundColor: chartColors.green,
borderColor: chartColors.green,
fill: false,
data: [0.69, 0, 25.7, 12.8, 0]
}]
},
});
</script>